Chapter 10 Continuous probability distributions - Ugrad.math.ubc.ca
Chapter 10 Continuous probability distributions - Ugrad.math.ubc.ca
Chapter 10 Continuous probability distributions - Ugrad.math.ubc.ca
- No tags were found...

Create successful ePaper yourself
Turn your PDF publications into a flip-book with our unique Google optimized e-Paper software.
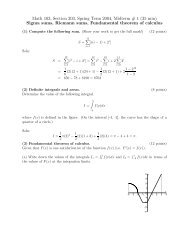
Math <strong>10</strong>3 Notes <strong>Chapter</strong> <strong>10</strong>cos( π 6 x m) = 0The angles whose cosine is zero are ±π/2, ±3π/2 etc. We select the angle in the relevant interval,i.e. π/2. This leads toπ6 x m = π 2so the median isx m = 3.RemarkA glance at the original <strong>probability</strong> distribution should convince us that it is symmetric about thevalue x = 3. Thus we should have anticipated that the mean and median of this distribution wouldboth occur at the same place, i.e. at the midpoint of the interval. This will be true in general forsymmetric <strong>probability</strong> <strong>distributions</strong>, just as it was for symmetric mass or grade <strong>distributions</strong>.<strong>10</strong>.3.2 How is the mean different from the median?p(x)p(x)xxFigure <strong>10</strong>.2:We have seen in Example 2 that for symmetric <strong>distributions</strong>, the mean and the median arethe same. Is this always the <strong>ca</strong>se? When are the two different, and how <strong>ca</strong>n we understand thedistinction?Re<strong>ca</strong>ll that the mean is closely associated with the idea of a center of mass, a concept from physicsthat describes the lo<strong>ca</strong>tion of a pivot point at which the entire “mass” would exactly balance. It isworth remembering thatmean of p(x) = expected value of x = average value of x.This concept is not to be confused with the average value of a function, which is an average valueof the y coordinate.The median simply indi<strong>ca</strong>tes a place at which the “total mass” is subdivided into two equalportions. (In the <strong>ca</strong>se of <strong>probability</strong> density, each of those portions represents an equal area,A 1 = A 2 = 1/2 since the total area under the graph is 1 by definition.)v.2005.1 - January 5, 2009 6