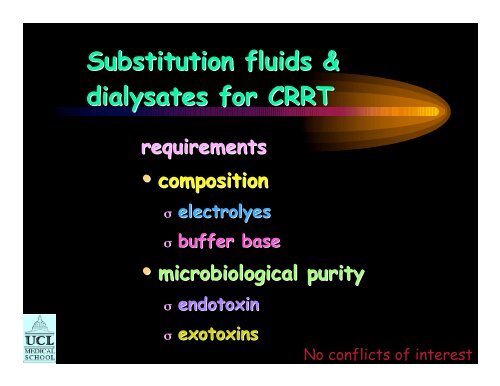
Substitution fluids & dialysates for CRRT - CRRT Online
Substitution fluids & dialysates for CRRT - CRRT Online
Substitution fluids & dialysates for CRRT - CRRT Online
- No tags were found...

Create successful ePaper yourself
Turn your PDF publications into a flip-book with our unique Google optimized e-Paper software.
as these measures could have been obtained from the padded and filtered acceleration time seriesthat is a part of the processing scheme. The second purpose of our article is to evaluate whetherthe post-processing method used by ITACA and PEER NGA has introduced biases or distortionsin the intensity measures. This is an important topic, because the intensity measures used <strong>for</strong>such things as deriving ground-motion prediction equations are often those from organizationsproviding data obtained using post-processing methods. The bulk of the article is devoted tothis topic.Using Initial Conditions with Pad-Stripped Filtered AccelerationsThe processing methods discussed in this article are illustrated with the EW component ofmotion recorded by an analog Kinemetrics SMA-1 strong-motion accelerograph at station Dinar-Meteorology Station ( R 5 km , V30 198 m/s ) from the 01 October 1995 Dinar earthquakeHYPS(M 6.4). The record is from the Turkish database (Akkar et al., 2010), and additionalin<strong>for</strong>mation about the station and the earthquake can be found in Anderson et al. (2001). Therecord was padded with zeros and then filtered with an acausal bandpass with corner frequenciesof 0.15 Hz and 30 Hz (these values are from the Turkish database). Figure 1 is a plot of thefiltered acceleration time series, with and without pads. No pre-event filter transient is obviousin the top graph, which illustrates our previous comment about the appearance of padded andfiltered accelerations. Such a transient exists, however, as is clearly shown when the ordinatescale is expanded greatly (Figure 1b). Even though relatively small in amplitude, thesetransients are important in the derivation of velocity, displacement, and response spectra, butthey are not available in the pad-stripped data. Ignoring the filter transient and integrating padstrippedaccelerations with the common assumption that the initial velocity and displacementsare 0.0 usually leads to long-period errors appearing as a drift in the displacement time series(Figure 2). In addition, computing response spectra from the pad-stripped acceleration timeseries, again with the common assumption of 0.0 initial conditions, leads to significantdifferences at long period relative to the response spectrum obtained from the paddedaccelerations (which we consider to be the correct response spectrum <strong>for</strong> the given choice offilter corner frequencies), as shown in Figure 3.C:\pad-stripped_initial_conditions\paper\using_pad-stripped_acausally_filtered_strongmotion_data_v3.4.doc3
Henderson 1996Convective transportbloodmembraneconcentrationC 1 C 2Q fS = 1C = 1 C 2Distance
Hemofiltration - clearanceClark et al ArtifOrgans 2003Post-dilutionK = Q F x SKQ FSclearance ml/minultrafiltration rate ml/minsieving coefficient
Filtration fractionBlood flowProteindepositionultrafiltrate
Gibbs – Donnan effect
Hemofiltration - clearanceClark et al ArtifOrgans 2003Post-dilution mode• small solutes S ~ 1.0 K ~ Q F• filtration fractionσ Q F /plasma water flow rateσ hct and albuminσ Q B
Predilutional hemofiltrationClark et al ArtifOrgans 2003K = Q F xSQ BW + Q SQ BWK clearance ml/minQ F ultrafiltration rate ml/minS sieving coefficientQ BWblood water flow rate ml/minQ S substitution fluid rate ml/min
Lower Predilution clearancesTroyanov et al NephrolDialTransplant 2003% ↓ clearance vs post dilution4035302520151050ureaphosphatecreatinineβ2-MmultiflowM60/M100Qb 125-150Qs 75ml/minUF 4.5 l/h
Pre vs post dilution isovolemic <strong>CRRT</strong>1.2Sieving coefficient1.110.9UreaCreat0.86 5 4 2 1 0pre0 1 2 4 5 6Uchino et al IntensivCareMed 2003post
Pre vs post dilution isovolemic <strong>CRRT</strong>21001800urea*Urea loss mmol/day1500120090060030006 5 4 2 1 0pre0 1 2 4 5 6Uchino et al IntensivCareMed 2003post
Pre vs post dilution isovolemic <strong>CRRT</strong>1cationsSieving coefficient0.90.80.7NaKMgCa0.66 5 4 2 1 0pre0 1 2 4 5 6Uchino et al IntensivCareMed 2003post
Pre vs post dilution isovolemic <strong>CRRT</strong>700sodiumMass balance mmol/day600500400300200100*06 5 4 2 1 0pre0 1 2 4 5 6Uchino et al IntensivCareMed 2003post
Hemofiltration -Pre-dilution mode• More sodium loss ↑ Na in replacement fkuidσ Na from other iv <strong>fluids</strong>σ Converse pre-dilution
post dilution <strong>CRRT</strong>sodiumUF Sodium concentration mmol/l160150140130120Lactate BicarbonateLactateBicarbonateNa140
What does this mean ?• High volume Predilution– Possible -ve balance• NamEq/lNaPrismaSateBGK4/0/1.2140Duosol4556136NxStageRFP-454130PrismaSateB22GK4/0140Mg1.21.51.51.5• High volume Postdilution– Positive balance
Hypocalcemia in the ICUZivin et al AmJKidDis 2001% patients10080604020UnivWashingtonStudy199 ptsionisedCa ++ < 1.16mmol/l0ICUpatientsICU buthospitalized48 h discharge non ICU
Pre vs post dilution isovolemic <strong>CRRT</strong>30total calciumMass balance mmol/day20100-10-20-30-40*-506 5 4 2 1 0preUchino et al IntensivCareMed 0 1 20032 4 5 6post
Hemofiltration -Pre-dilution mode• More calcium loss ↑ Ca in replacement fkuidσ Ca from other iv <strong>fluids</strong>σ Converse post-dilution
post dilution <strong>CRRT</strong>2Calcium & MagnesiumUF concentration mmol/l1.510.5CaCaMgMgCa1.75mmol/lMg0.75 & 0.5mmol/l0Lactate BicarbonateLactateBicarbonate
What does this mean ?• High volume Predilution– Possible -ve balance• Ca & MgmEq/lMgPrismaSateBGK4/0/1.21.2Duosol45561.5NxStageRFP-4541.5Monosol1.0Mg1.21.51.51.5• High volume Postdilution– Positive balance• Ca & Mg
Pre vs post dilution isovolemic <strong>CRRT</strong>1.3anions1.2Total CO 2Sieving coefficient1.110.9PiCl0.86 5 4 2 1 0pre0 1 2 4 5 6Uchino et al IntensivCareMed 2003post
Pre vs post dilution isovolemic <strong>CRRT</strong>1000chlorideMass balance mmol/day7505002500*-2506 5 4 2 1 0preUchino et al IntensivCareMed 0 1 20032 4 5 6post
Hemofiltration -Post-dilution mode• More phosphate lossσ Pi from other iv <strong>fluids</strong>σ pre-dilution smaller losses
post dilution <strong>CRRT</strong>chlorideUF chloride concentration mmol/l120115110105100Lactate BicarbonateLactateBicarbonateCl115&109.5
What does this mean ?• High volume Predilution– Possible +ve balance• ChloridemEq/lClPrismaSateBGK4/0/1.2110.2Duosol4556117NxStageRFP-454110.5PrismaSateB22GK4/0120.5Bic32252522• High volume Postdilution– Possible -ve balance
Lactate <strong>fluids</strong> <strong>for</strong> <strong>CRRT</strong>mmol/lHaemovex 2®Monosol® Filtrasol®lactate 44.5 30 44.5sodium 142 140 138chloride 103 115 98calcium 2.0 1.75 1.65magnesium 0.75 0.75 0.70
<strong>CRRT</strong> replacement <strong>fluids</strong>Davenport et al Lancet 1988range of <strong>fluids</strong>Chloride 105 95Lactate 35 46hyper -chloremicmetabolicacidosishypo -chloremicmetabolicalkalosis
Hyperlactatemia during <strong>CRRT</strong>Davenport et al NephrolDialTransplant 1997change in arterial H + nmol/l107.552.50-2.5-50 40 80 120 160 200UF lactate mmol17 lCVVHLac 43CKDAKIALF
Base excess during <strong>CRRT</strong>0Base excess mmol/l-2-4-6-8-10BicarbonateLactate with addedbicarbonatepre 1 2Duration <strong>CRRT</strong> daysLactate
Serum Bicarbonate during <strong>CRRT</strong>serum bicarbonate mmol/l282420BicarbonateLactateLactate withaddedbicarbonate16pre 1 2Duration <strong>CRRT</strong> days
Buffer base <strong>for</strong> <strong>CRRT</strong>MacLean et al KI 200010fall in arterial H + nmol/l7.552.50-2.52 l/hCVVHD53 ptsBicLac-51050 1150 1250Amount of base administered mmol/24 h
Temperature losses duringdialysis37.0 o C36.5 o C37.0 o C36.5 o Cc36.2 o C36.4 o C
Citrate anticoagulation <strong>for</strong> <strong>CRRT</strong>Van der Voort BloodPurif 2007Mass balance mmol/day403020100-10*LeeuwardenAmsterdam20 ptsCVVHFmean (SD)* p
Citric- and Acetic Acid <strong>dialysates</strong>ChemicalMeasureCitrate DialysateAcetic Acid DialysateSodiummmol/L138,0138,0Calciummmol/L1,251,25Magnesiummmol/L0,50,5Potassiummmol/L2,02,0Chloridemmol/L105,0105,3Acetatemmol/L0,34,0Citratemmol/L0,8-Glucoseg/L1,01,0Bicarbonatemmol/L35,234,2
Crossover StudyAcetateCITRATEiCa 2+ , Regular DialysateiCa 2+ , Citrate Dialysatemmol/l1,601,401,201,000,800,600,400,200,00Start 1 Hour 2 Hours 3 Hours End End + 1 H.mmol/l1,601,401,201,000,800,600,400,200,00Start 1 Hour 2 Hours 3 Hours End End + 1 H.Citrate, Regular DialysateCitrate, Citrate Dialysatemmol/l4,003,503,002,502,001,501,000,500,00Start 1 Hour 2 Hours 3 Hours End End + 1 H.mmol/l4,003,503,002,502,001,501,000,500,00Start 1 Hour 2 Hours 3 Hours End End + 1 H.*AJKD;Vol 35, No 3, March 2000: pp 493-499
Longer-Term StudyPre dialysis HCO 3 - , Citrate DialysatePre dialysis BUN, Citrate Dialysate29100mmol/l2725232119mg/dl90807060504017Start Week 4 Week 8 Week 1230Start Week 4 Week 8 Week 12Urea Reduction Ratio URR (p < 0,03)Delivered Kt/V (p < 0,01)901,35BUN mg/d l75604530150URR =68 +/- 5,9% URR =73 +/- 5,3%Pre BUNPost BUNPre BUNPost BUNFirst dialysisLast dialysisKt/V1,331,311,291,271,251,231,211,191,171,151,23 +/- 0,19First dialysis1,34 +/- 0,20Last dialysisAJKD;Vol 35, No 3, March 2000: pp 493-499
Citrate DialysateBlood Purif 2007;25:183-208
On-line <strong>fluids</strong> <strong>for</strong> HDFMaximum allowed contamination100806040200water<strong>for</strong> injsterilewaterbicarbultrapuredialysate dialysis fluidMicro-bacteriologicalcontaminationCFU /mlEndotoxinIU/ 10ml
Nitrite levels in tap waterNitrite concentration mg/lNitrite concentration mg/l0.20.150.10.05ULNdomesticwater0.1 mg/l0D D JanuaryFeb March Apr May June July2000 2001 year
Replacement <strong>fluids</strong> & <strong>dialysates</strong>Summary• electrolyte compositionσ high volume therapyσ pre vs post dilutionσ citrate