CHAPTER FIFTEEN - WH Freeman
CHAPTER FIFTEEN - WH Freeman
CHAPTER FIFTEEN - WH Freeman
- No tags were found...

Create successful ePaper yourself
Turn your PDF publications into a flip-book with our unique Google optimized e-Paper software.
354<strong>CHAPTER</strong> 15 The Climate SystemKey Figure 15.7Earth’s greenhouse atmosphere balances incoming and outgoing radiation.Earth’s albedo (31%) is energy reflected by clouds (22%) andEarth’s surface (9%). The remaining incoming solar radiationis absorbed by Earth’s atmosphere (20%) and the surface (49%).To achieve radiation balance, Earth radiates thesum of the radiation absorbed by the atmosphereand surface back into space.Reflected solar radiation Outgoing infrared(albedo), 31%radiation, 69%Incoming solar67 W/m 2radiation,342 W/m 2107 W/m 2net fromatmosphere168 W/m 2net fromsurfaceG R E E N H O U S E G A S E S168 W/m 230 W/m 277 W/m 2Absorbed bysurface67 W/m 2Absorbed byatmosphereSurfaceradiation,390 W/m 2Flow ofhot air andmoisture,102 W/m 2Backradiation,324 W/m 2Hot air, moisture, and radiationtransport more energy away(492 W/m 2 ) than is receivedas incoming solar radiation(168 W/m 2 ) because greenhousegases reflect most back asinfrared radiation (324 W/m 2 ).[IPCC, Climate Change 2001: The Scientific Basis.]changes it induces in other components, and negative feedback,in which a change in one component is reduced by thechanges it induces in other components. Positive feedbackstend to amplify changes in the system; negative feedbackstend to stabilize the system against change.Here are some of the feedbacks within the climate systemthat can significantly affect the temperatures achievedby radiation balance.• Water vapor feedback. A rise in temperature increases theamount of water vapor in the atmosphere through evaporation.Water vapor is a greenhouse gas, so this increase enhancesthe greenhouse effect and the temperature rises—apositive feedback.• Albedo feedback. A rise in temperature reduces the accumulationof ice and snow in the cryosphere, which decreasesEarth’s albedo and increases the energy its surface absorbs.The increased warming of the atmosphere enhances the temperaturerise—another example of positive feedback.• Radiation feedback. In “radiative damping,” a rise inatmospheric temperature strongly increases the amount ofinfrared energy radiated back into space, which reduces thetemperature rise—a negative feedback. Radiative dampingstabilizes Earth’s climate against major changes, keeping theoceans from freezing up or boiling off and thus maintainingan equable habitat for water-loving life.• Plant growth feedback. The stimulation of plant growthby carbon dioxide increases atmospheric CO 2, which causestemperatures to rise by enhancing the greenhouse effect.However, more plant growth also removes CO 2from theatmosphere by converting it to carbon-rich organic matter,thus reducing the greenhouse temperature rise. This secondaryeffect is a negative feedback.Feedbacks can involve much more complex interactionsamong components of the climate system. For example, anincrease in atmospheric water vapor produces more clouds.Because clouds reflect solar energy, they increase the planetaryalbedo, which sets up a negative feedback between watervapor and temperature. On the other hand, clouds absorb infraredradiation efficiently, so increasing the cloud coverenhances the greenhouse effect, thus providing a positivefeedback between water vapor and temperature. Does the neteffect of clouds produce a positive or negative feedback?
Climate Variability3571 There is a decline in both 3 Climate has been relativelytemperature and greenhouse warm and stable during the lastgas concentrations during 10,000 years—the Holoceneglacial periods…interglacial period.2…and a rapidrise duringdeglaciation.Figure 15.10 A graph showing three types of data recoveredfrom the Vostok ice core in East Antarctica: temperatures inferredfrom oxygen isotopes (black line) and the concentrations of twoimportant greenhouse gases, carbon dioxide (blue line) andmethane (red line).The gas concentrations come frommeasurements of air samples trapped as tiny bubbles within theAntarctic ice. [IPCC, Climate Change 2001: The Scientific Basis. ]Temperature relative to present climate (°C)40–4–8–12Key:TemperatureCO 2Methane400 300 200 100 0Thousands of years before presentHighRelative carbon dioxide andmethane concentrationsLowthe warm interglacial climate of the last 11,000 years, correspondingto the Holocene epoch. Three other ice ages arevisible in this record; they had minimum temperatures atabout 140,000, 260,000, and 350,000 years ago.Milankovitch Cycles The alternation between glacial andinterglacial ages observed during the Pleistocene epoch isexplained best by the Milankovitch cycles, named after aYugoslavian geophysicist who first calculated them in the1920s and 1930s. These cycles cause periodic variations inthe amount of heat Earth receives from the Sun. The shapeof Earth’s orbit around the Sun changes cyclically, beingmore circular at some times and more elliptical at others.The degree of ellipticity of Earth’s orbit around the Sun isknown as eccentricity. A nearly circular orbit has low eccentricity,and a more elliptical orbit has high eccentricity (Figure15.11a). The time interval of one cycle of variation fromlow to high eccentricity is about 100,000 years.(a)Eccentricity (100,000 years)(c)Precession (23,000 years)Wobble of axisAxis ofrotationLow eccentricityHigh eccentricity(b)Tilt (41,000 years)21.5° to 24.5°Orbital planeAxis ofrotationOrbital planeFigure 15.11 Three components of variations in Earth’s orbitaround the Sun and their time intervals for a single cycle.(a) Eccentricity is the degree of ellipticity of Earth’s orbit.(b) Tilt is the angle between Earth’s axis of rotation and thevertical to the orbital plane. (c) Precession is the wobble of theaxis of rotation. One can imagine this motion by thinking of thewobble of a spinning top.
358<strong>CHAPTER</strong> 15 The Climate SystemEARTH ISSUES15.1 Vostok and GRIP: Ice-CoreDrilling in Antarctica and GreenlandAt the Vostok science station in the frozen Antarctic,Russian scientists have been working year-round since1960 to discover the climatological history of Earth hiddenin the ice. In the 1970s, scientists at Vostok drilledboreholes 500 to 952 m deep in the East Antarctic icesheet and brought up a set of ice cores showing layersproduced by annual cycles of ice formation from snow.Careful counting of the layers, working from the topdown, revealed the age of the ice, much as tree ringsreveal the age of a tree. This time-stratigraphic record ofthe ice proved to correlate with the temperaturesthought to prevail when the layers formed. A low ratioof oxygen-18 to oxygen-16 in an ice layer indicates thatthe ice formed when atmospheric temperature wasrelatively high. High concentrations of carbon dioxide,methane, and other greenhouse gases in an ice layer alsosuggest that it formed during a period of atmosphericgreenhouse warming (see Figure 15.10).By the 1990s, ice borers at Vostok had drilled to adepth of 2755 m, penetrating ice not only from the lastglacial period but also from the interglacial periodbefore it. They thereby accumulated a stratigraphicrecord for the past 160,000 years. These cores showedthat eastern Antarctica, where the ice cores weredrilled, was colder and drier during the last glaciationthan during the 11,000 years of the current interglacialperiod.Variations in the oxygen isotope ratios of ice layersconfirm other evidence that variations in Earth’sorbit—the Milankovitch cycles—control the alternationof glacial and interglacial epochs. The carbon dioxideRussian scientists at Vostok science station in Antarcticacarefully remove an ice core from a drill.The layersproduced by annual cycles of ice formation are visible.[R. J. Delmas, Laboratoire de glaciologie et géophysique del’environnement, Centre National de la Recherche Scientifique.]content of ice layers formed during glacial intervalsdecreased markedly with climate cooling.Meanwhile, in the Arctic, a group of scientists in1992 completed 2 years of drilling the top 3 km of iceAnother astronomical cycle involves the angle of tilt ofEarth’s rotation axis. The angle cycles between 21.5° and24.5° over a time period of about 41,000 years. This cyclealso slightly changes the heat received from the Sun (see Figure15.11b). In addition, Earth wobbles about its axis of rotation,giving rise to a precession with a time period of about23,000 years (see Figure 15.11c). Precession, too, changes theamount of heat Earth receives from the Sun.The 100,000-year spacing of ice ages seen in Figure15.10 matches the times of high orbital eccentricity, whenEarth received less radiation on average from the Sun. Thiscorrelation has led scientists to conclude that glacial cyclesare externally forced by variations in the amount of solarradiation. The small changes in solar radiation during theMilankovitch cycles, however, cannot completely explainthe large changes observed in Earth’s surface temperature.Some type of positive feedback must be operating within theclimate system to amplify the external forcing. The data inFigure 15.10 clearly indicate that this feedback involves thegreenhouse gases CO 2and CH 4. Their concentrations preciselytrack the temperature variations throughout the glacialcycles—warm interglacial intervals are marked by highconcentrations, cold glacial intervals by low concentrations.Exactly how this feedback works has not yet been fullyexplained, but it demonstrates the importance of the greenhouseeffect in long-term climate variations.Ancient Ice Ages In addition to the Pleistocene ice ages,there is good evidence in the geologic record for earlierepisodes of continental glaciation during the Permian-Pennsylvanian and Ordovician periods and at least twice inthe Proterozoic eon. Evidently, there are long-term changes
Climate Variability359in the Greenland ice cap.The Greenland Ice Core Project,better known as GRIP, is an outstanding example ofinternational scientific cooperation in Europe. GRIP wassponsored by the European Science Foundation, whichincluded the governments of Belgium, Denmark, France,Germany, Iceland, Italy, Switzerland, and the United Kingdom.The GRIP core penetrated ice layers of the lastglacial period (11,000 to 115,000 years before the present)and the last interglacial period (the Eemian, 115,000to 135,000 years before the present). It stopped in layersgoing back 235,000 years, near the end of the previousinterglacial period. The accompanying diagramshows the relationship between depth of the ice coreand times of glacial and interglacial periods for the past135,000 years.A parallel core was drilled 30 km to the west of theGRIP site by the U.S. Greenland Ice-Sheet Project(known as GISP2).The GRIP and GISP2 ice cores agreedvery closely over the past 110,000 years, confirmed theglacial chronology at Vostok, and gave a good picture ofthe changes in climate and atmospheric composition ofthe past 250,000 years. Analysis of the cores also correctedearlier suggestions that the climates of the Eemianinterglacial period were unstable and changed appreciablyon a short time scale.The GRIP and GISP2 findings confirmedthe remarkably rapid climate oscillations of thelast glacial period. The GRIP and Vostok cores yieldedprecise oxygen-isotope profiles that correlated closelywith those of deep-sea sediments, providing additionaldetail and further supporting the chronology of glacialinterglacialclimate change.These triumphs have not been won easily. The scientistshad to take extreme care not to melt and contaminatethe ice cores while drilling them, transportingthem to the laboratories, and storing them until the iceand the air bubbles trapped in them could be analyzed.The scientists also had to guard against misleadingresults—caused, for example, by the reaction of carbondioxide with impurities in the ice. It is a tribute to thepatience, ingenuity, and care of these hardy bands ofresearchers that the worldwide scientific communityhas recognized the great importance of glacial ice-coreresearch in understanding the history and predicting thefuture of global climate change.Depth (m)160027802870Time(years ago)11,500115,000135,000Holocene interglacialEnd of Younger DryasBedrockLast glacialEemian interglacialSaale glacialComparison of ice depths and time before the present forrecent glacial and interglacial intervals. [After J.W. C.White,“Don’t Touch That Dial.” Nature 364 (1993): 186.]in the climate system that cause the formation of polar icecaps during certain periods of geologic history but not duringothers.In most cases, the general cooling of polar regions canbe well explained by rearrangements of the continents byplate tectonics, coupled with the albedo feedback and otherfeedbacks in the climate system. For most of Earth’s history,there were no extensive land areas in the polar regions, andthere were no ice caps. The oceans circulated through theopen polar regions, transporting heat from the equatorialregions and helping the atmosphere to distribute temperaturesfairly evenly over the Earth. When large land areasdrifted to positions that obstructed the efficient transport ofheat by the oceans, the differences in temperature betweenthe poles and the equator increased. As the poles cooled, theice caps formed.An example is the Permian-Pennsylvanian glaciation,which is preserved in glacial deposits across the continents ofthe Southern Hemisphere. During this ice age, about 300 millionyears ago, the southern continents were joined togethernear the South Pole as part of the ancient continent of Gondwanaland(see Figure 21.26). We will return to the subject ofancient ice ages in Chapter 21.Short-Term VariationsThe temperatures shown in Figure 15.10 do not varysmoothly over time. Superposed on the 100,000-year glacialcycles are climate fluctuations of shorter duration, somenearly as large as the changes from glacial to interglacialperiods. Geologists have combined the information fromcores in polar ice sheets, mountain glaciers, lake sediments,
360<strong>CHAPTER</strong> 15 The Climate SystemEARTH ISSUES15.2 El Niño: The Wayward ChildEl Niño is caused by an upset in the delicate balancebetween winds and currents of the tropical Pacific.Thetropical Pacific absorbs an enormous amount of solarheat—more than any other ocean. Normally, the warmerwaters of the western tropical Pacific off Indonesia causelower pressure, towering thunderstorms, and heavy rainfallin that region. In contrast, air pressure is higher andrainfall is less over the cooler waters in the eastern tropicalPacific. These prevailing pressure patterns drive thetrade winds that blow from east to west, pushing theheated tropical Pacific waters westward, where they pileup and maintain a large warm pool. In the eastern Pacific,colder deep water rises to replace the warm surfacewaters blown to the west, producing an equatorial “coldtongue” off the west coast of South America.Sporadically, this system balance breaks down. Airpressure rises over the western tropical Pacific and dropsin the central and eastern parts, causing the trade windsto weaken or occasionally even reverse direction. Thisrecurring swing in air pressure is called the SouthernOscillation. With the collapse of the trade winds, thetransport of warm water westward ceases and the warmpool migrates eastward, bringing with it thunderstormsand rainfall. The equatorial cold tongue fails to develop,and temperatures across the tropical Pacific that normallyare warmer in the west and cooler in the eastbecome equalized. These regional changes can triggeranomalous weather patterns worldwide.The jet stream,the atmospheric circulation, and the transport of moistureare changed in large parts of both the NorthernHemisphere and Southern Hemisphere. For example,cooler, wetter winters are more frequent in the southwesternUnited States, and milder winters tend to prevailin the Pacific Northwest and New England.The 1997–1998 El Niño was the strongest on record,and its particularly severe climatic effects werefelt throughout the world. Some examples of unusualweather attributed to this event were drought in Australia;record drought and forest fires in Indonesia; severehurricanes and typhoons in the Pacific and milder hurricanesin the Caribbean; severe storms in California thatcaused landslides and floods; and heavy rains and flashfloods in Peru, Ecuador, and Kenya. Crops failed and thefish catch was decimated in many areas. A single blizzardparalyzed Denver, and warmer than usual temperaturesstole Christmas in New York City. In regions withincreased rainfall, such as parts of South America andAfrica, waterborne diseases (cholera, dysentery, typhoid,hepatitis, Rift Valley fever) increased. According to oneestimate, the global disruption in weather patterns andecosystems may have cost 23,000 lives and caused $33 billionin damage.El Niño has a flip side, called La Niña (“the girl child”),that sometimes (but not always) follows El Niño by a yearor so. La Niña is characterized by stronger trade winds,colder sea-surface temperatures in the eastern tropicalPacific, and warmer temperatures in the western tropicalPacific than are the norm. Global weather anomalies aregenerally the opposite of those that occur during El Niño.Some scientists attribute the severe droughts on the EastCoast of the United States in the summer of 1999 to asevere La Niña event in the same year.and deep-sea sediments to reconstruct a decade-by-decade —and in some cases, a year-by-year—history of short-term climatevariations during the last glacial cycle. Here we summarizesome of the basic features of this remarkable chronicle.• During the last ice age, Earth’s climate was highly variable,with shorter (1000-year) oscillations between warmand cold superposed on longer (10,000-year) cycles. Themost extreme variations appear to have been in the NorthAtlantic region, where mean local temperatures rose and fellby as much as 15°C. Each 10,000-year cycle comprised a setof progressively cooler 1000-year oscillations and endedwith an abrupt warming. The massive discharges of icebergsand fresh water resulting from the warming altered the thermohaline“conveyor belt” circulation in the oceans (see Figure15.3b) and dumped large amounts of glacial drift intodeep-sea sediments.• The main phase of warming from the last ice age occurredin the interval between 14,500 and 10,000 years ago. It wasnot a smooth transition but involved two main stages, with apause in deglaciation and a return to cold conditions duringthe Younger Dryas event 13,000 to 11,500 years ago(see Feature 15.1). The extremely abrupt increases in temperatureat 14,500 and 11,500 years ago are perhaps themost astonishing aspect of this jerky transition. Broadregions of Earth experienced almost synchronous changesfrom glacial to interglacial temperatures during intervals asshort as 30 to 50 years. Evidently, atmospheric circulationcan reorganize very rapidly, flipping the entire climate systemfrom one state (glacial cold) to another (interglacialwarmth) in less than a human lifetime! This raises the possibilitythat human-induced global climate change couldinvolve abrupt shifts to a new (and unknown) climate state,rather than just a gradual warming.• The warm interglacial climate of the Holocene, sinceabout 11,000 years ago, has been much more stable than theprevious parts of the glacial cycle. The warmest tempera-
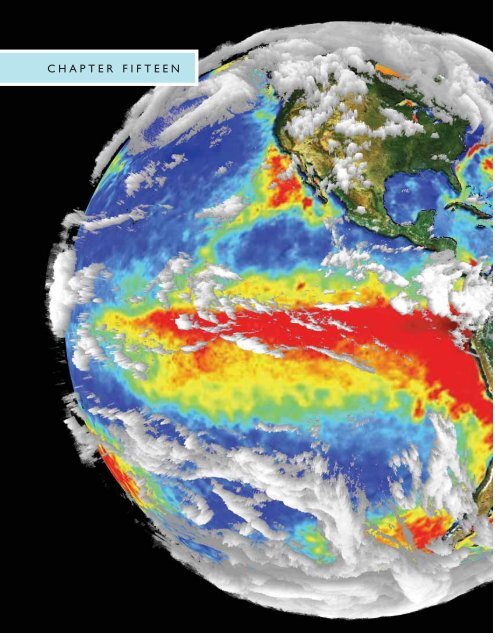
Climate Variability361NormalJuly 19961 During normal years,warm surface waters inthe Pacific lie in the east,off Indonesia,…2 …where they cause low pressure andheavy rainfall. The pressure patterndrives trade winds from east to west,pushing the warm water westward,…3…which also causes coldwater to rise off SouthAmerica and flow west.IndonesiaEquatorNE tradesSE tradesSouthAmericaEquatorWarm water poolUpwellingEl NiñoJuly 19974 Periodically, the pattern 5 The western 6…and low pressure over the warm easternoscillates to an El Niño, in Pacific experiences Pacific causes heavy rain and inhibits thewhich warm waters shift east. drought,… upwelling of cold water along South America.IndonesiaSouthAmericaWarm water poolLa NiñaJuly 19987 La Niña is characterized by coldersea-surface temperatures and strongertrade winds in the eastern tropical Pacific.The upper panel shows the normal pattern in the tropical Pacific Ocean, with trade winds(which blow east to west), an upwelling tongue of cold water in the east, and wind-drivenwarm water pooling in the west. The middle panel shows the El Niño pattern, with tradewinds slackening or reversing, warm surface water, and thunderstorms spreading eastward.The lower panel shows the La Niña pattern, with colder surface water in the centralPacific and a warmer pool in the western Pacific. [U.S.–French TOPEX/Poseidon mission.]tures occurred during the beginning of this epoch. Geologistshave documented regional variations of about 5°C ontime scales of 1000 years or so, but the global changes duringthis period are much smaller, with a total range of only2°C. It is interesting that the Holocene appears to be thelongest stable warm period over the last 400,000 years.Equable Holocene conditions no doubt promoted the rapidrise of agriculture and civilization that followed the end ofthe last ice age.Regional Patterns of VariabilityLocal and regional climates are much more variable thanglobal climate, because averaging over large surface areas,like averaging over time, tends to smooth out small-scalefluctuations. Over periods of years to decades, the predominantregional variations result from interactionsbetween atmospheric circulation and the sea and land surfaces.They generally occur in distinctive geographical pat-terns, although their timing and amplitudes can be highlyirregular.The most famous example is an anomalous warming ofthe eastern Pacific Ocean that occurs every 3 to 7 years andlasts for a year or so. Peruvian fishermen call such an eventEl Niño (“the Christ Child” in Spanish) because the warmingtypically reaches the surface waters off the coast ofSouth America about Christmastime. El Niño events can bedisastrous for local ecosystems, which depend on upwellingsof cold water for their nutrient supply. Besides disruptingfishing in the eastern Pacific, they can triggerchanges in wind and rain patterns over much of the globe,precipitating floods, prolonged droughts, forest fires, landslides,and the spread of waterborne diseases. Scientistshave shown that El Niño and the complementary coolingevents, known as La Niña, are part of a natural variation inthe exchange of heat between the atmosphere and the tropicalPacific Ocean. This variation is known as ENSO, or ElNiño–Southern Oscillation (see Feature 15.2).
362<strong>CHAPTER</strong> 15 The Climate SystemClimate scientists have identified similar patterns ofweather and climate variability in other regions. One exampleis the North Atlantic Oscillation, a highly irregular fluctuationin the barometric pressure between Iceland and theAzores Islands that has a strong influence on the movementof storms across the North Atlantic and thus affects weatherconditions throughout Europe and parts of Asia. Understandingthese patterns is improving long-range weatherforecasting and may provide important information aboutthe regional effects of human-induced climate change.THE CARBON CYCLEBefore the industrial era, which began early in the nineteenthcentury, atmospheric CO 2concentrations were about280 ppm for at least several thousand years. They have beenrising steadily since then, reaching 370 ppm in the year2000. Earth’s atmosphere has not contained this much CO 2for at least the last 400,000 years and probably for the last20 million years. The CO 2concentration is now increasingat an unprecedented rate of 0.4 percent per year (see Figure15.16), faster than at any time in recent geologic history.Yet the situation could be worse. In the 1980s, throughfossil-fuel burning and other industrial activities, our societyemitted about 5.4 gigatons of carbon each year (a gigaton, or1 billion tons, is 10 12 kg, the mass of 1 km 3 of water), andanother 1.7 gigatons were emitted by the burning of forestsand other changes in land use. If it had all stayed in the air,the CO 2increase would have been closer to 0.9 percent peryear, more than twice the observed rate. Instead, 3.8 gigatonsof carbon were removed from the atmosphere each yearby natural processes. Where did all this carbon go?We will answer this question by examining the carboncycle—the geosystem that describes the continual movementof carbon between the atmosphere and its other principalreservoirs: the lithosphere, hydrosphere, and biosphere.We will then be able to consider an even deeper set of issues:What are the interactions between the carbon cycle and theclimate system? Is the net feedback between these systemspositive or negative—that is, will changes in the carbon cycleenhance or reduce global warming? Finally, how mighthumans intervene in the carbon cycle to stabilize the climatesystem against global warming?Geochemical Cyclesand How They WorkIn discussing geochemical cycles, we view the componentsof the Earth system—atmosphere, hydrosphere, cryosphere,lithosphere, and biosphere—as geochemical reservoirs forholding terrestrial chemicals, linked by processes that transportchemicals among them. Geochemical cycles trace theflow, or flux, of chemicals from one reservoir to another. Byquantifying the amounts of the chemicals that are stored inand moved among the various reservoirs, we can gain newinsights into the workings of the Earth system.Residence Time When the inflow of an element into areservoir equals the outflow, the average time that an atomof the element spends in the reservoir before leaving iscalled the element’s residence time. Think of a crowdedbar where many more people want to get in than areallowed by the fire code. After the room fills up or reachesits capacity, the bouncer begins holding people at the door.During the most active hours, when people are waiting toget in, the bar is filled to capacity, or saturated, and is in asteady state, with arrivals exactly balancing departures.Even though some people come early and stay late and othersleave after only a short time, there is an average lengthof time between each person’s arrival and departure. Thisaverage is the residence time, which can be computed bydividing the capacity of the room by the rate of arrivals(inflow) or departures (outflow). If the room’s capacity is30 people and a new person is let in every 2 minutes onaverage, the residence time is 60 minutes.Visualize an element’s residence time in the ocean as theaverage time that elapses between its entry into the oceanand its removal through sedimentation or some other process.For example, the residence time of sodium in the oceanis extremely long, about 48 million years, because sodium isvery soluble in seawater (the reservoir capacity is high)and rivers contain relatively small amounts (the element’sinflow is low). Iron, in contrast, stays in the ocean onlyabout 100 years, because its solubility is very low and theinflow from rivers is relatively high.The residence times of elements in the atmosphere areusually shorter than those in the ocean, because the atmosphereis a smaller reservoir than the ocean and the fluxesinto and out of the atmosphere can be relatively high. Sulfurdioxide has a residence time of hours to weeks. Oxygen,about 21 percent of the atmosphere, has a residence time of6000 years. Nitrogen, about 78 percent of the atmosphere,has a residence time of 400 million years. A molecule ofnitrogen that went into the atmosphere in the late Paleozoicera, about 300 million years ago, is still likely to be there.Chemical Reactions Some chemicals are relatively inert,but most participate in chemical reactions. In fact, these reactionsgenerally govern a chemical’s residence time withina reservoir. A calcium ion (Ca 2+ ) can be removed from seawaterby reacting with two bicarbonate ions (2HCO 3 – ) toform carbonic acid (H 2CO 3) and calcite (CaCO 3). Carbonicacid can dissociate into water (H 2O) and carbon dioxide(CO 2), both of which can escape to the atmosphere, and calcitecan precipitate out of the ocean in limestone sediments.How much calcium can be dissolved in seawater thus dependson the availability of bicarbonate ions, which in turndepends on the influx of carbon dioxide into the seawater.As this example illustrates, chemical reactions can couple
The Carbon Cycle363ATMOSPHERELand-sea transport of dust,moisture, and other gasesVolcanicaerosols, dust,and gasesPrecipitationEvaporationRespirationBIOSPHEREEvaporation PrecipitationGasexchangeDustTransport of sediment byNutrient uptake,death and decayriversSedimentationHYDROSPHEREDustHydrothermalreactionsLITHOSPHEREFigure 15.12 Transport processes between components of the climate system.the geochemical cycle of one element (calcium) with that ofanother (carbon).This coupling implies that geochemical cycles canrarely be considered in isolation but must be treated as interactinggeosystems. Moreover, the chemical reactions dependon the physical conditions of the reservoirs, such as thelocal pressure and temperature. This dependence can couplegeochemical cycles to the climate system itself.Transport Across Interfaces Fluxes between reservoirsare governed by processes that transport chemicals into andout of them (Figure 15.12). For example, volcanic processestransport gases, aerosols, and dust from the lithosphere intothe atmosphere (see Chapter 12). Wind lifts dust into theatmosphere, and gravity pulls it back to the surface. Windbornedust is an important mechanism for transferring mineralsfrom the lithosphere to the hydrosphere, although by farthe largest flux comes from dissolved or suspended mineralsin the outflow from rivers.Evaporation and precipitation transport huge amounts ofwater between the atmosphere and the surfaces of both landand ocean. At the sea surface, gas molecules escape fromtheir dissolved state in the water and enter the atmosphere.Their escape is promoted by the evaporation of sea spray,which releases dissolved gases as well as dissolved salt inthe form of tiny crystals. The gas exchange is balanced bythe dissolution of atmospheric constituents into sea sprayand rain falling on the ocean or by the dissolution of gasesdirectly across the ocean surface.Sedimentation is the great flux that keeps the ocean in asteady state, primarily by counterbalancing the influx ofriver water. As sediments are buried, they become part of theoceanic crust. There they stay until they move into the mantlethrough subduction or become part of the continentalcrust through accretion. The uplift of continental regions byplate convergence and other mountain-building processesexposes crustal rocks to weathering and erosion, maintainingthe balance of fluxes among all the reservoirs.The biosphere is a unique reservoir, because each individualorganism maintains an active interface with its environment,which often includes three of the other main surfacereservoirs—atmosphere, hydrosphere, and lithosphere.The most important transport processes are the inflow andoutflow of atmospheric gases by respiration, the inflow ofnutrients from the lithosphere and hydrosphere, and the outflowof these nutrients through the death and decay of organisms.When the biosphere plays a key role in the flux ofa chemical, geologists refer to the geosystem that describesthe flux as a biogeochemical cycle (see Chapter 11). Thecarbon cycle, which depends critically on the organic pumpingof carbon into and out of the atmosphere, is clearly a biogeochemicalcycle.Example: The Calcium Cycle The calcium cycle providesa fairly simple illustration of the concepts involved ingeochemical cycles (Figure 15.13). The ocean containsabout 560,000 gigatons of calcium, dissolved in a totalocean mass of about 1.4 × 10 9 gigatons. Calcium steadilyenters this reservoir in large quantities through the rivers ofthe world, which transport dissolved and suspended calciumderived from the weathering of such minerals as calcite,gypsum, calcium feldspars, and other calcium silicates. A
364<strong>CHAPTER</strong> 15 The Climate SystemATMOSPHERECalcium dust (0.01Gt/yr)Evaporite deposits (0.01Gt/yr)Rivers(0.8 Gt/yr)Suspended calcium (0.3 Gt/yr)Dissolved calcium (0.5 Gt/yr)Ocean (560,000 Gt)HYDROSPHERECalcium carbonatesediments (0.9 Gt/yr)Hydrothermal reactionswith basalt (0.1 Gt/yr)Inflow to oceanOutflow from oceanLITHOSPHERESedimentationFigure 15.13 The calcium cycle, showing fluxes into and out ofthe ocean. Fluxes are in units of gigatons (10 12 kg) per year. Theinflow of calcium to the ocean is approximately equal to theoutflow, resulting in a steady state.much smaller amount enters the ocean via transport bywindblown dust.If the ocean continually received calcium liberated byweathering, without there being a way to remove excess calcium,it would quickly become supersaturated with this element.The flux that removes the majority of excess calciumfrom the ocean is the sedimentation of calcium carbonate,which we described in Chapter 5. A smaller amount of calciumis precipitated as gypsum in evaporite deposits.The system diagram in Figure 15.13 shows this steadystatesituation. The ocean’s calcium capacity (the amount ofcalcium the ocean can hold) is much larger than the inflowand outflow of calcium, so calcium has a fairly long residencetime in the ocean. By dividing the total annual influx(0.9 gigaton/ year) by the ocean’s calcium capacity (560,000gigatons), we obtain a residence time of about 600,000 years.The Carbon BudgetThe carbon cycle, depicted in Figure 15.14, involves fourmain reservoirs: the atmosphere; the global ocean, includingmarine organisms; the land surface, including terrestrialplants and soils; and the deeper lithosphere. We can describethe flux of carbon among these reservoirs in term of fourbasic subcycles. During times when Earth’s climate is stable,each subcycle is in a steady state and can therefore becharacterized by a constant flux.Air-Sea Gas Exchange The exchange of CO 2across theair-sea interface amounts to a carbon flux of about 90 gigatons/year.The process depends on many factors, includingair and sea temperatures and the composition of the seawater,but it is particularly sensitive to the wind velocity,which increases gas transfer by stirring up the surface waterand generating spray.Photosynthesis and Respiration in the TerrestrialBiosphere The greatest carbon flux, 120 gigatons/year,comes from the cycling of atmospheric CO 2by land plantsand animals through photosynthesis, respiration, and decay.Plants take in this entire amount during photosynthesis andrespire about half of it back into the atmosphere. The otherhalf is incorporated into plant tissues—leaves, wood, androots. Animals eat the plants, and microorganisms promotetheir decay; both processes oxidize plant tissues and respireCO 2. A small fraction (about 3 percent) is directly oxidizedthrough forest fires and other combustion.Dissolved Organic Carbon A small fraction of the CO 2incorporated into plant tissues (0.4 gigaton/year) is dissolvedinto surface waters and transported by rivers to theocean, where it is respired back into the atmosphere.Carbonate Weathering and Precipitation The weatheringof carbonate rocks removes about 0.2 gigaton of carbonper year from the lithosphere and an equal amountfrom the atmosphere. This inorganic carbon is dissolved into
The Carbon Cycle365Key Figure 15.14The carbon cycle regulates the flux of carbon in the climate system.ATMOSPHERE (730 Gt)CO 2 to dissolvedorganic carbon(0.4 Gt/yr)Volcanism(
366<strong>CHAPTER</strong> 15 The Climate System1 Human activities release a total2 New plant growth and3 …yielding a netof 7.1 Gt of carbon into theair-sea gas exchangeatmospheric increaseatmosphere each year.remove 3.8 Gt/yr,…of 3.3 Gt/yr.ATMOSPHEREFossilfuelburning(5.3 Gt/yr)Land-use change:deforestation,agriculture(1.7 Gt/yr)Land uptake bynew plant growth(1.9 Gt/yr)Ocean uptake byair-sea gas exchange(1.9 Gt/yr)Terrestrial biosphereOCEANLANDCement production(0.1 Gt/yr)Fossil organiccarbonRockcarbonatesGEOLOGIC RESERVOIRSFigure 15.15 Humans add CO 2to the atmosphere by burningfossil fuels; producing cement; and releasing carbon bydeforestation, agriculture, and other land-use practices.Theclimate system responds by absorbing some of this carbon intothe oceans and increasing plant production on land.Theremainder stays in the atmosphere, increasing the concentrationof CO 2. [IPCC, Climate Change 2001: The Scientific Basis.]TWENTIETH-CENTURYWARMING: HUMAN FINGERPRINTSOF GLOBAL CHANGESystematic measurements of weather and climate usingthermometers and other scientific instruments began only afew hundred years ago. By the mid-nineteenth century, temperaturesaround the world were being reported by enoughmeteorological stations on land and on ships at sea to allowaccurate estimation of Earth’s average annual surface temperature.Between the end of the nineteenth century and thebeginning of the twenty-first, the mean surface temperaturerose by about 0.6°C, a climate trend called the twentiethcenturywarming (Figure 15.16).Fossil-fuel burning and deforestation have substantiallyincreased the amount of atmospheric CO 2during the sameinterval, and human activities have also generated significantrises in other greenhouse gases, such as methane. Weknow that humans are responsible for the CO 2increase be-cause the carbon isotopes of fossil fuels have a distinctivesignature that precisely matches the changing isotopic compositionof atmospheric carbon. But how certain can we bethat the twentieth-century warming was a direct consequenceof the CO 2increase—that is, a result of the enhanced greenhouseeffect—and not some fortuitous change associatedwith natural climate variability? This question lies at theheart of the global warming controversy.Almost all experts on Earth’s climate are now convincedthat the twentieth-century warming was in part humaninducedand that the warming will continue into the twentyfirstcentury as the levels of atmospheric greenhouse gasescontinue to rise. They base this judgment on two principallines of reasoning: the climate-change record and theirunderstanding of how the climate system works.The twentieth-century warming lies within the range oftemperature variations that have been inferred for the Holocene.In fact, the average temperatures in many regionsof the world were probably warmer 10,000 to 8000 yearsago than they are today. The twentieth-century record is
Summary367(a)Global temperature anomaly (°C)0.40.20–0.2–0.41 A recent warming trend correlateswith the increase in CO 2 fromemissions since the industrialrevolution of the 19th century.Temperature–0.61850 1900YearsCO 2concentration3703503303102902701950 2000Figure 15.16 Earth heats up. A comparison of Earth’s averageannual surface temperature with CO 2concentrations in theatmosphere, showing that the recent warming trend correlatesCO 2 concentration (ppm)(b)Northern Hemisphere temperatureanomaly (°C)0.40.20–0.2–0.42 The 20th-century record isclearly anomalous when comparedwith climate change documentedduring the last millennium.Temperature370350330310290CO 2 concentration–0.62701000 1200 1400 1600 1800 2000Yearswith the increase in CO 2caused by human activities since theindustrial revolution. [IPCC, Climate Change 2001: The Scientific Basis.]CO 2 concentration (ppm)clearly anomalous, however, when compared with the patternand rate of climate change documented during the lastmillennium. Based on data from tree rings, corals, icecores, and other climate indicators, scientists have drawntwo major conclusions about climate during the 1000 yearsthat preceded the twentieth century: (1) there was an irregularbut steady global cooling of about 0.2°C over thisentire interval, and (2) the maximum fluctuation in meantemperatures during any one of the nine previous centurieswas probably less than 0.3°C. Against this background, thetwentieth-century warming appears to be very abnormal(see Figure 15.16b).The second argument, and to many scientists a morecompelling one, comes from the agreement between the observedpattern of warming and the pattern predicted by thebest climate-system models of the enhanced greenhouseeffect. Models that include changes in atmospheric greenhousegases not only satisfy the global temperature rise butalso reproduce the pattern of temperature change both geographicallyand with altitude in the atmosphere—what somescientists have called the “fingerprints” of the enhancedgreenhouse effect. For example, models of the enhancedgreenhouse effect predict that as global warming occurs,nighttime low temperatures at the surface should increasemore rapidly than daytime high temperatures, thus reducingthe daily variation of temperature. Climate data for the lastcentury confirm this prediction.As we emphasized earlier in this chapter, poorly understoodaspects of the climate system may introduce substantialerrors in climate model predictions. Nevertheless, theconsistency of the measured trends with the basic physics ofthe enhanced greenhouse effect lends powerful support tothe hypothesis that we ourselves are the agents responsiblefor the recent global warming. We will discuss global warmingand the societal issues it poses in Chapter 23.SUMMARYWhat is the climate system? The climate system includesall parts of the Earth system and all the interactions amongthese components needed to describe how climate behaves inspace and time. The main components of the climate systemare the atmosphere, hydrosphere, cryosphere, lithosphere,and biosphere. Each component plays a different role in theclimate system, depending on its ability to store and transportenergy.What is the greenhouse effect? For the global temperatureaveraged over daily and seasonal cycles to remain the same,Earth’s surface must radiate as much energy back intospace at it receives from the Sun. Much of the radiantenergy from the Sun passes through the atmosphere and isabsorbed by Earth’s surface. The warmed surface radiatesheat back to the atmosphere as infrared rays. Carbon dioxideand other trace gases absorb infrared rays selectively atcertain wavelengths and radiate infrared energy at otherwavelengths in all directions, including downward toEarth’s surface. The net effect is to increase the temperatureof the surface relative to the temperature at higher levels inthe atmosphere. In this way, the atmosphere acts like theglass in a greenhouse, allowing solar radiant energy to passthrough but trapping heat.How has Earth’s climate changed over time? Natural variationsof climate occur on a wide range of scales in both time
368<strong>CHAPTER</strong> 15 The Climate Systemand space. Some occur by the external forcing of climate,such as fluctuations in the amount of solar radiation receivedat Earth’s surface and changes in the distribution of landsurface caused by continental drift. Others result from internalvariations within the climate system itself, as mass andenergy are exchanged among its components. The largestrecent changes have been the 100,000-year glacial cycles,with surface temperature changes of 6° to 8°C. Superposedon the glacial cycles have been climate fluctuations of shorterduration, some as large as the changes from glacial to interglacialperiods. The warm interglacial climate of the Holocene,since about 10,000 years ago, has been much more stablethan the previous parts of the glacial cycle.What are geochemical cycles? Geochemical cycles tracethe flux of Earth’s elements from one reservoir to another,making it possible to quantify the amounts of elements thatare stored in and moved among the oceans, atmosphere,land surface, crust, and mantle. The calcium cycle showshow rivers transport calcium derived from rock weatheringto the oceans and how sedimentation transports calciumback into the lithosphere. If the cycle is in steady state,inflow balances outflow, and the residence time can be calculatedas the total amount of the element in the reservoirdivided by the inflow.What is the carbon cycle? The carbon cycle is the geosystemthat describes the continual movement of carbon betweenthe atmosphere and its other principal reservoirs—the lithosphere, hydrosphere, and biosphere. Major processesinclude gas exchange between the atmosphere andthe ocean; photosynthesis, respiration, and the burning oforganic materials; and the weathering and precipitation ofcalcium carbonate. Outflows of carbon dioxide from theatmosphere include the weathering of silicate rocks and theburial of carbon in the crust, which release oxygen to theatmosphere. Inflows of carbon into the atmosphere includevolcanism.How can internal geologic processes cause climaticchange? Over the short term of a few years, sulfuric acidaerosols emanating from large volcanic eruptions can absorbsolar radiation before it reaches the lower atmosphere andthus decrease global temperatures. Over the long term of millionsof years, plate tectonic movements can cause continentsto drift over the poles, stabilizing polar ice caps; block oropen gateways to ocean currents; and cause uplift, whichalters weather systems and rates of chemical erosion thatdraw down atmospheric CO 2.Was the twentieth-century warming caused by humanactivities? Global warming of about 0.6°C during thetwentieth century correlates with the significant rise inatmospheric CO 2and other greenhouse gases caused byfossil-fuel burning, deforestation, and other human activities.Most experts on Earth’s climate are now convincedthat the twentieth-century warming was in part humaninducedand that the warming will continue into the twentyfirstcentury as the levels of atmospheric greenhouse gasescontinue to rise.KEY TERMS AND CONCEPTSalbedo (p. 000)calcium cycle (p. 000)carbon cycle (p. 000)climate (p. 000)climate model (p. 000)climate system (p. 000)El Niño (p. 000)enhanced greenhouseeffect (p. 000)geochemical reservoir(p. 000)greenhouse effect (p. 000)ice age (p. 000)EXERCISESMilankovitch cycle(p. 000)negative feedback(p. 000)positive feedback (p. 000)residence time (p. 000)steady state (p. 000)stratosphere (p. 000)thermohaline circulation(p. 000)troposphere (p. 000)twentieth-century warming(p. 000)1. What is the relationship between weather and climate?2. What is a greenhouse gas, and how does it affect Earth’sclimate?3. Why is it incorrect to assert that greenhouse gases preventheat energy from escaping to outer space?4. Give an example not discussed in this chapter of a positivefeedback and a negative feedback in the climate system.5. From the information given in Figure 15.14, estimatethe residence time of carbon dioxide in the ocean.6. List two inflows of chemical components into the oceanand two outflows of the same chemical components fromthe ocean.7. List three causes of climate change that result from theinteraction of Earth’s internal and external systems.THOUGHT QUESTIONS1. Do Milankovitch cycles fully explain the warming andcooling of global climate during Pleistocene glacialcycles?2. How would the calcium geochemical cycle be affectedby a global increase in chemical weathering?3. Devise a simple geochemical cycle for the elementsodium, which is found in marine evaporites (halite) andclay minerals as well as dissolved in seawater.
Short-Term Team Project3694. What would the carbon cycle have looked like after lifehad originated but before photosynthesis had evolved?5. Assume that we keep pumping carbon dioxide into theatmosphere at a steadily increasing rate and Earth warmssignificantly in the next 100 years. How might this affectthe global carbon cycle?6. Why are scientists reasonably sure that most of thetwentieth-century warming was due to changes in the climatesystem caused by human activities?SHORT-TERM TEAM PROJECTYour Local ClimatologyInvestigate the climate at your locality by compiling dataon the maximum and minimum annual temperatures andaverage rainfall during the last 40 years. A good place tostart is the Web site of the National Climatic Data Center(http://www.ncdc.noaa.gov/oa/ncdc.html). Can you seeevidence of global warming in your local climate record?