Chapter 3 - Experimental Error - WH Freeman
Chapter 3 - Experimental Error - WH Freeman
Chapter 3 - Experimental Error - WH Freeman

You also want an ePaper? Increase the reach of your titles
YUMPU automatically turns print PDFs into web optimized ePapers that Google loves.
<strong>Experimental</strong> <strong>Error</strong> 3<br />
<strong>Experimental</strong> <strong>Error</strong><br />
[Courtesy 3M Company, St. Paul, MN.]<br />
Some laboratory errors are more obvious than others, but there is error associated with<br />
every measurement. There is no way to measure the “true value” of anything. The best<br />
we can do in a chemical analysis is to carefully apply a technique that experience tells<br />
us is reliable. Repetition of one method of measurement several times tells us the precision<br />
(reproducibility) of the measurement. If the results of measuring the same quantity<br />
by different methods agree with each other, then we become confident that the results<br />
are accurate, which means they are near the “true” value.<br />
Suppose that you determine the density of a mineral by measuring its mass<br />
(4.635 0.002 g) and volume (1.13 0.05 mL). Density is mass per unit volume:<br />
4.635 g / 1.13 mL 4.101 8 g/mL. The uncertainties in measured mass and volume are<br />
45
46<br />
3 <strong>Experimental</strong> <strong>Error</strong><br />
Significant figures: minimum number<br />
of digits required to express a value in<br />
scientific notation without loss of<br />
accuracy<br />
Significant zeros below are bold:<br />
106 0.010 6 0.106 0.106 0<br />
Interpolation: Estimate all readings to<br />
the nearest tenth of the distance<br />
between scale divisions.<br />
0.002 g and 0.05 mL, but what is the uncertainty in the computed density? And how<br />
many significant figures should be used for the density? This chapter discusses the<br />
propagation of uncertainty in lab calculations.<br />
3-1 Significant Figures<br />
The number of significant figures is the minimum number of digits needed to write a<br />
given value in scientific notation without loss of accuracy. The number 142.7 has four<br />
significant figures, because it can be written 1.427 10 2 . If you write 1.427 0 10 2 ,<br />
you imply that you know the value of the digit after 7, which is not the case for the<br />
number 142.7. The number 1.427 0 10 2 has five significant figures.<br />
The number 6.302 10 6 has four significant figures, because all four digits are<br />
necessary. You could write the same number as 0.000 006 302, which also has just four<br />
significant figures. The zeros to the left of the 6 are merely holding decimal places. The<br />
number 92 500 is ambiguous. It could mean any of the following:<br />
9.25 10 4 3 significant figures<br />
9.250 10 4 4 significant figures<br />
9.250 0 10 4 5 significant figures<br />
You should write one of the three numbers above, instead of 92 500, to indicate how<br />
many figures are actually known.<br />
Zeros are significant when they occur (1) in the middle of a number or (2) at the<br />
end of a number on the right-hand side of a decimal point.<br />
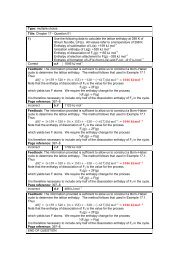
The last significant digit (farthest to the right) in a measured quantity always has<br />
some associated uncertainty. The minimum uncertainty is 1 in the last digit. The scale<br />
of a Spectronic 20 spectrophotometer is drawn in Figure 3-1. The needle in the figure<br />
appears to be at an absorbance value of 0.234. We say that this number has three significant<br />
figures because the numbers 2 and 3 are completely certain and the number 4 is an<br />
estimate. The value might be read 0.233 or 0.235 by other people. The percent transmittance<br />
is near 58.3. Because the transmittance scale is smaller than the absorbance<br />
scale at this point, there is more uncertainty in the last digit of transmittance. A reasonable<br />
estimate of uncertainty might be 58.3 0.2. There are three significant figures in<br />
the number 58.3.<br />
When reading the scale of any apparatus, try to estimate to the nearest tenth of<br />
a division. On a 50-mL buret, which is graduated to 0.1 mL, read the level to the<br />
nearest 0.01 mL. For a ruler calibrated in millimeters, estimate distances to the nearest<br />
0.1 mm.<br />
There is uncertainty in any measured quantity, even if the measuring instrument<br />
has a digital readout that does not fluctuate. When a digital pH meter indicates a pH of<br />
3.51, there is uncertainty in the digit 1 (and maybe even in the digit 5). By contrast,<br />
some numbers are exact—with an infinite number of unwritten significant digits. To<br />
calculate the average height of four people, you would divide the sum of heights (which<br />
is a measured quantity with some uncertainty) by the integer 4. There are exactly 4 people,<br />
not 4.000 0.002 people!<br />
Percent transmittance<br />
0 10 20 30 40 50<br />
60 70 80 90 100<br />
Figure 3-1<br />
Scale of a Bausch and<br />
Lomb Spectronic 20 spectrophotometer.<br />
Percent transmittance is a linear scale<br />
and absorbance is a logarithmic scale.<br />
• 2 1.0 0.5 0.4 0.3 0.2 0.1 0.05 0<br />
Absorbance
3-2 Significant Figures in Arithmetic<br />
We now consider how many digits to retain in the answer after you have performed<br />
arithmetic operations with your data. Rounding should only be done on the final answer<br />
(not intermediate results), to avoid accumulating round-off errors.<br />
47<br />
3-2 Significant Figures in Arithmetic<br />
Addition and Subtraction<br />
If the numbers to be added or subtracted have equal numbers of digits, the answer goes<br />
to the same decimal place as in any of the individual numbers:<br />
1.362 10 4<br />
3.111 10 4<br />
4.473 10 4 Inspect the legend of the periodic table<br />
The number of significant figures in the answer may exceed or be less than that in the<br />
original data.<br />
5.345<br />
6.728<br />
12.073<br />
If the numbers being added do not have the same number of significant figures, we<br />
are limited by the least certain one. For example, the molecular mass of KrF 2 is known<br />
only to the second decimal place, because we only know the atomic mass of Kr to two<br />
decimal places:<br />
18.998 403 2 (F)<br />
18.998 403 2 (F)<br />
83.80 (Kr)<br />
121.796 806 4<br />
123<br />
Not significant<br />
The number 121.796 806 4 should be rounded to 121.80 as the final answer.<br />
When rounding off, look at all the digits beyond the last place desired. In the preceding<br />
example, the digits 6 806 4 lie beyond the last significant decimal place.<br />
Because this number is more than halfway to the next higher digit, we round the 9 up to<br />
10 (i.e., we round up to 121.80 instead of down to 121.79). If the insignificant figures<br />
were less than halfway, we would round down. For example, 121.794 8 is correctly<br />
rounded to 121.79.<br />
In the special case where the number is exactly halfway, round to the nearest even<br />
digit. Thus, 43.550 00 is rounded to 43.6, if we can only have three significant figures.<br />
If we are retaining only three figures, 1.425 10 9 becomes 1.42 10 9 . The number<br />
1.425 01 10 9 would become 1.43 10 9 , because 501 is more than halfway to the<br />
next digit. The rationale for rounding to an even digit is to avoid systematically increasing<br />
or decreasing results through successive round-off errors. Half the round-offs will<br />
be up and half down.<br />
In adding or subtracting numbers expressed in scientific notation, all numbers<br />
should first be expressed with the same exponent:<br />
1.632 10 5<br />
4.107 10 3<br />
0.984 10 6 1<br />
7.26 10 14<br />
6.69 10 14<br />
0.57 10 14<br />
1.632 10 5<br />
0.041 07 10 5<br />
9.84 10 5<br />
11.51 10 5<br />
The sum 11.513 07 10 5 is rounded to 11.51 10 5 because the number 9.84 10 5<br />
limits us to two decimal places when all numbers are expressed as multiples of 10 5 .<br />
inside the cover of this book. Be sure<br />
you can interpret uncertainties in atomic<br />
masses. For F and Kr, the atomic<br />
masses are<br />
F: 18.998 403 2 0.000 000 5<br />
Kr: 83.80 0.01<br />
Rules for rounding off numbers<br />
Addition and subtraction: Express all<br />
numbers with the same exponent and<br />
align all numbers with respect to the<br />
decimal point. Round off the answer<br />
according to the number of decimal<br />
places in the number with the fewest<br />
decimal places.
48<br />
3 <strong>Experimental</strong> <strong>Error</strong><br />
Multiplication and Division<br />
In multiplication and division, we are normally limited to the number of digits contained<br />
in the number with the fewest significant figures:<br />
3.26 10 5<br />
1.78<br />
5.80 10 5 4.317 9 10 12<br />
3.6 10 19<br />
1.6 10 6 34.60<br />
2.462<br />
14.05<br />
87<br />
The power of 10 has no influence on the number of figures that should be retained.<br />
Logarithms and Antilogarithms<br />
The base 10 logarithm of n is the number a, whose value is such that n 10 a .<br />
Logarithm of n: n 10 a means that log n a<br />
(3-1)<br />
1 1<br />
10 3 0.001<br />
10 3 1 000<br />
Number of digits in mantissa of log x <br />
number of significant figures in x:<br />
log (5.403 10 8 ) 7.267 4<br />
123 123<br />
4 digits 4 digits<br />
Number of digits in antilog x ( 10 x ) <br />
number of significant figures in<br />
mantissa of x:<br />
10 6.142 {<br />
1.39<br />
{<br />
10 6<br />
3 digits 3 digits<br />
For example, 2 is the logarithm of 100 because 100 10 2 . The logarithm of 0.001 is<br />
3 because 0.001 10 3 . To find the logarithm of a number with your calculator,<br />
enter the number and press the log function.<br />
In Equation 3-1, the number n is said to be the antilogarithm of a. That is, the<br />
antilogarithm of 2 is 100 because 10 2 100, and the antilogarithm of 3 is 0.001<br />
because 10 3 0.001. Your calculator has either a 10 x key or an antilog key. To find the<br />
antilogarithm of a number, enter it in your calculator and press 10 x (or antilog).<br />
A logarithm is composed of a characteristic and a mantissa. The characteristic is<br />
the integer part and the mantissa is the decimal part:<br />
log 339 2.530log (3.39 10<br />
{{ 5 ) 4.470<br />
{ {<br />
Characteristic Mantissa<br />
Characteristic Mantissa<br />
2 0.530 4 0.470<br />
The number 339 can be written 3.39 10 2 . The number of digits in the mantissa<br />
of log 339 should equal the number of significant figures in 339. The logarithm of 339<br />
is properly expressed as 2.530. The characteristic, 2, corresponds to the exponent in<br />
3.39 10 2 .<br />
To see that the third decimal place is the last significant place, consider the following<br />
results:<br />
10 2.531 340 (339.6)<br />
10 2.530 339 (338.8)<br />
10 2.529 338 (338.1)<br />
The numbers in parentheses are the results prior to rounding to three figures. Changing<br />
the exponent in the third decimal place changes the answer in the third place of 339.<br />
In converting a logarithm to its antilogarithm, the number of significant figures in<br />
the antilogarithm should equal the number of digits in the mantissa. Thus,<br />
antilog (3.42) 10 3.42 3.8 10 4<br />
{ { {<br />
2 digits 2 digits 2 digits<br />
Here are several examples showing the proper use of significant figures:<br />
log 0.001 237 2.907 6 antilog 4.37 2.3 10 4<br />
log 1 237 3.092 4 10 4.37 2.3 10 4<br />
log 3.2 0.51<br />
10 2.600 2.51 10 3<br />
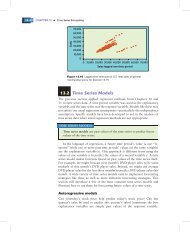
3-3 Significant Figures and Graphs<br />
When drawing a graph on a computer, consider whether the graph is meant to display<br />
qualitative behavior of the data (Figure 3-2) or precise values. If someone will use the
graph (such as Figure 3-3) to read points, it should at least have tic marks on both sides<br />
of the horizontal and vertical scales. Better still is a fine grid superimposed on the graph.<br />
3-4 Types of <strong>Error</strong> 49<br />
0.8<br />
+ 0.04<br />
0.4<br />
y<br />
0.0<br />
–0.4<br />
Correction (mL)<br />
+ 0.02<br />
0.00<br />
– 0.02<br />
29.43<br />
mL<br />
–0.8<br />
0 5 10 15 20<br />
Figure 3-2<br />
Example of a graph<br />
intended to show the qualitative<br />
behavior of the function y e x/6 cos x.<br />
You are not expected to be able to read<br />
coordinates accurately on this graph.<br />
x<br />
25<br />
– 0.04<br />
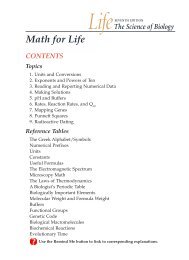
Figure 3-3<br />
10 20 30 40 50<br />
Volume delivered (mL)<br />
Calibration curve for a 50-mL buret. The volume delivered can be read to<br />
the nearest 0.1 mL. If your buret reading is 29.43 mL, you can find the correction factor<br />
accurately enough by locating 29.4 mL on the graph. The correction factor on the ordinate<br />
(y-axis) for 29.4 mL on the abscissa (x-axis) is 0.03 mL (to the nearest 0.01 mL).<br />
Rulings on a graph should be compatible with the number of significant figures of<br />
the coordinates. The graph in Figure 3-4a has reasonable rulings for the points (0.53,<br />
0.63) and (1.08, 1.47). Rulings correspond to every 0.1 unit, so you can estimate the<br />
position of the 0.01 unit. The graph in Figure 3-4b is the same size but is not ruled fine<br />
enough to estimate the position of the 0.01 unit. Plan the axes of a graph so that data are<br />
spread over as much of the sheet of paper as possible.<br />
1.50<br />
1.50<br />
1.00<br />
1.00<br />
0.50<br />
(a)<br />
0.50 1.00 1.50<br />
0.50<br />
(b)<br />
0.50 1.00 1.50<br />
Figure 3-4<br />
Graphs demonstrating<br />
choice of rulings in relation to significant<br />
figures in the data. Graph (b) does not<br />
have divisions fine enough to allow you<br />
to plot data that are accurate to the<br />
hundredths place.<br />
3-4 Types of <strong>Error</strong><br />
Every measurement has some uncertainty, which is called experimental error. Conclusions<br />
can be expressed with a high or a low degree of confidence, but never with complete<br />
certainty. <strong>Experimental</strong> error is classified as either systematic or random.<br />
Systematic <strong>Error</strong><br />
Systematic error, also called determinate error, arises from a flaw in equipment or<br />
the design of an experiment. If you conduct the experiment again in exactly the same<br />
manner, the error is reproducible. In principle, systematic error can be discovered and<br />
corrected, although this may not be easy.<br />
Systematic error is a consistent error that<br />
can be detected and corrected. Box 3-1<br />
describes Standard Reference Materials<br />
designed to reduce systematic errors.
50 3 <strong>Experimental</strong> <strong>Error</strong><br />
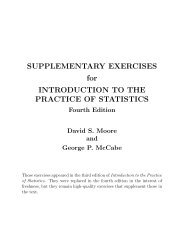
Box 3-1<br />
Standard Reference Materials<br />
Inaccurate laboratory measurements can mean wrong medical<br />
Before introduction of this reference material, five labo-<br />
diagnosis and treatment, lost production time, wasted Retracked ratories gain analyzing 1 line identical samples reported a range of<br />
energy and materials, manufacturing rejects, and product liability<br />
problems. To minimize errors in laboratory measurements,<br />
the U.S. National Institute of Standards and Technology<br />
results with relative errors of 40 to 110% of the expected<br />
value. After distribution of the reference material, the error<br />
was reduced to 20 to 40%.<br />
distributes more than 1 000 Standard Reference Materials,<br />
such as metals, chemicals, rubber, plastics, engineering<br />
materials, radioactive substances, and environmental and<br />
clinical standards that can be used to test the accuracy of<br />
analytical procedures used in different laboratories. 1<br />
For example, in treating patients with epilepsy, physicians<br />
depend on laboratory tests to measure concentrations of<br />
anticonvulsant drugs in blood serum. Drug levels that are too<br />
low lead to seizures; high levels are toxic. Because tests of<br />
identical serum specimens at different laboratories were giving<br />
an unacceptably wide range of results, the National Institute<br />
of Standards and Technology developed a Standard Reference<br />
Material containing known levels of antiepilepsy drugs<br />
120<br />
100<br />
80<br />
60<br />
40<br />
20<br />
Before<br />
After<br />
0<br />
in serum. The reference material now enables different laboratories<br />
to detect and correct errors in their assay procedures.<br />
Phenytoin Phenobarbital<br />
<strong>Error</strong> (% of target value)<br />
Primidone<br />
(Mysoline)<br />
Ethosuximide<br />
(Zarontin)<br />
Ways to detect systematic error:<br />
1. Analyze samples of known composition,<br />
such as a Standard Reference<br />
Material. Your method should reproduce<br />
the known answer. (See Box<br />
15-1 for an example.)<br />
2. Analyze “blank” samples containing<br />
none of the analyte being sought. If<br />
you observe a nonzero result, your<br />
method responds to more than you<br />
intend. Section 29-3 discusses different<br />
kinds of blanks.<br />
3. Use different analytical methods to<br />
measure the same quantity. If the<br />
results do not agree, there is error in<br />
one (or more) of the methods.<br />
4. Round robin experiment: Assign different<br />
people in several laboratories<br />
to analyze identical samples by the<br />
same or different methods.<br />
Disagreement beyond the estimated<br />
random error is systematic error.<br />
Random error cannot be eliminated, but<br />
it might be reduced by a better<br />
experiment.<br />
For example, using a pH meter that has been standardized incorrectly produces<br />
a systematic error. Suppose you think that the pH of the buffer used to standardize<br />
the meter is 7.00, but it is really 7.08. Then all your pH readings will be 0.08 pH<br />
unit too low. When you read a pH of 5.60, the actual pH of the sample is 5.68. This<br />
systematic error could be discovered by using a second buffer of known pH to test<br />
the meter.<br />
Another systematic error arises when you use an uncalibrated buret. The manufacturer’s<br />
tolerance for a Class A 50-mL buret is 0.05 mL. When you think you have<br />
delivered 29.43 mL, the real volume could be anywhere from 29.38 to 29.48 mL and<br />
still be within tolerance. One way to correct for an error of this type is to construct a<br />
calibration curve, such as that in Figure 3-3, by the procedure on page 44. To do this,<br />
deliver distilled water from the buret into a flask and weigh it. Determine the volume<br />
of water from its mass by using Table 2-7. Figure 3-3 tells us to apply a correction factor<br />
of 0.03 mL to the measured value of 29.43 mL. The actual volume delivered is<br />
29.43 0.03 29.40 mL.<br />
A key feature of systematic error is that it is reproducible. For the buret just discussed,<br />
the error is always 0.03 mL when the buret reading is 29.43 mL. Systematic<br />
error may always be positive in some regions and always negative in others. With care<br />
and cleverness, you can detect and correct a systematic error.<br />
Random <strong>Error</strong><br />
Random error, also called indeterminate error, arises from the effects of uncontrolled<br />
(and maybe uncontrollable) variables in the measurement. Random error has an<br />
equal chance of being positive or negative. It is always present and cannot be corrected.<br />
There is random error associated with reading a scale. Different people reading the<br />
scale in Figure 3-1 report a range of values representing their subjective interpolation<br />
between the markings. One person reading the same instrument several times might
eport several different readings. Another indeterminate error results from random electrical<br />
noise in an instrument. Positive and negative fluctuations occur with approximately<br />
equal frequency and cannot be completely eliminated.<br />
51<br />
3-5 Propagation of Uncertainty<br />
Precision and Accuracy<br />
Precision describes the reproducibility of a result. If you measure a quantity several<br />
times and the values agree closely with one another, your measurement is precise. If the<br />
values vary widely, your measurement is not very precise. Accuracy describes how<br />
close a measured value is to the “true” value. If a known standard is available (such as<br />
a Standard Reference Material, described in Box 3-1), accuracy is how close your value<br />
is to the known value.<br />
A measurement might be reproducible, but wrong. For example, if you made a<br />
mistake while preparing a solution for a titration, the solution would not have the<br />
desired concentration. You might then do a series of reproducible titrations but report an<br />
incorrect result because the concentration of the titrating solution was not what you<br />
intended. In this case, the precision is good but the accuracy is poor. Conversely, it is<br />
possible to make poorly reproducible measurements clustered around the correct value.<br />
In this case, the precision is poor but the accuracy is good. An ideal procedure is both<br />
precise and accurate.<br />
Accuracy is defined as nearness to the “true” value. The word true is in quotes<br />
because somebody must measure the “true” value, and there is error associated with<br />
every measurement. The “true” value is best obtained by an experienced person using a<br />
well-tested procedure. It is desirable to test the result by using different procedures,<br />
because, even though each method might be precise, systematic error could lead to poor<br />
agreement between methods. Good agreement among several methods affords us confidence,<br />
but never proof, that results are accurate.<br />
Precision: reproducibility<br />
Accuracy: nearness to the “truth”<br />
Absolute and Relative Uncertainty<br />
Absolute uncertainty expresses the margin of uncertainty associated with a measurement.<br />
If the estimated uncertainty in reading a calibrated buret is 0.02 mL, we say<br />
that 0.02 mL is the absolute uncertainty associated with the reading.<br />
Relative uncertainty compares the size of the absolute uncertainty with the size of<br />
its associated measurement. The relative uncertainty of a buret reading of 12.35 0.02<br />
mL is a dimensionless quotient:<br />
An uncertainty of 0.02 means that,<br />
when the reading is 13.33, the true<br />
value could be anywhere in the range<br />
13.31 to 13.35.<br />
Relative<br />
uncertainty:<br />
absolute uncertainty<br />
Relative uncertainty <br />
magnitude of measurement<br />
(3-2)<br />
The percent relative uncertainty is simply<br />
Percent<br />
relative<br />
uncertainty:<br />
<br />
0.02 mL<br />
12.35 mL 0.002<br />
Percent relative uncertainty 100 relative uncertainty<br />
100 0.002 0.2%<br />
(3-3)<br />
If the absolute uncertainty in reading a buret is constant at 0.02 mL, the percent relative<br />
uncertainty is 0.2% for a volume of 10 mL and 0.1% for a volume of 20 mL.<br />
If you use a 50-mL buret, design your<br />
titration to require 20–40 mL of reagent<br />
to produce a small relative uncertainty<br />
of 0.1–0.05%.<br />
In a gravimetric analysis, plan to<br />
have enough precipitate for a low<br />
relative uncertainty. If weighing precision<br />
is 0.3 mg, a 100-mg precipitate has a<br />
relative weighing error of 0.3% and a<br />
300-mg precipitate has an uncertainty<br />
of 0.1%.<br />
3-5 Propagation of Uncertainty<br />
We can usually estimate or measure the random error associated with a measurement,<br />
such as the length of an object or the temperature of a solution. The uncertainty might
52<br />
3 <strong>Experimental</strong> <strong>Error</strong><br />
Standard deviation and confidence<br />
interval are discussed in the next<br />
chapter.<br />
For addition and subtraction, use<br />
absolute uncertainty.<br />
be based on how well we can read an instrument or on our experience with a particular<br />
method. If possible, uncertainty is expressed as the standard deviation or as a confidence<br />
interval; these parameters are based on a series of replicate measurements. The<br />
following discussion applies only to random error. We assume that systematic error has<br />
been detected and corrected.<br />
In most experiments, it is necessary to perform arithmetic operations on several<br />
numbers, each of which has an associated random error. The most likely uncertainty in<br />
the result is not simply the sum of the individual errors, because some of these are<br />
likely to be positive and some negative. We expect some cancellation of errors.<br />
Addition and Subtraction<br />
Suppose you wish to perform the following arithmetic, in which the experimental<br />
uncertainties, designated e 1 , e 2 , and e 3 , are given in parentheses.<br />
(3-4)<br />
The arithmetic answer is 3.06. But what is the uncertainty associated with this result?<br />
For addition and subtraction, the uncertainty in the answer is obtained from the<br />
absolute uncertainties of the individual terms as follows:<br />
Uncertainty in addition<br />
and subtraction:<br />
1.76 (0.03)<br />
1.89 (0.02)<br />
0.59 (0.02)<br />
3.06 (e 4 )<br />
e 4 2e 2 1 e 2 2 e 2 3<br />
d e 1<br />
d e 2<br />
d e 3<br />
(3-5)<br />
For the sum in Equation 3-4, we can write<br />
e 4 2(0.03) 2 (0.02) 2 (0.02) 2 0.04 1<br />
The absolute uncertainty e 4 is 0.04, and we can write the answer as 3.06 0.04.<br />
Although there is only one significant figure in the uncertainty, we wrote it initially as<br />
0.04 1 , with the first insignificant figure subscripted. We retain one or more insignificant<br />
figures to avoid introducing round-off errors into later calculations through the number<br />
0.04 1 . The insignificant figure was subscripted to remind us where the last significant<br />
figure should be at the conclusion of the calculations.<br />
To find the percent relative uncertainty in the sum of Equation 3-4, we write<br />
For addition and subtraction, use<br />
absolute uncertainty. Relative<br />
uncertainty can be found at the end of<br />
the calculation.<br />
The uncertainty, 0.04 1 , is 1. 3 % of the result, 3.06. The subscript 3 in 1. 3 % is not significant.<br />
It is sensible to drop the insignificant figures now and express the final result as<br />
3.06 (0.04) (absolute uncertainty)<br />
3.06 (1%) (relative uncertainty)<br />
Example<br />
Percent relative uncertainty 0.04 1<br />
3.06 100 1. 3%<br />
Uncertainty in a Buret Reading<br />
The volume delivered by a buret is the difference between the final reading and the<br />
initial reading. If the uncertainty in each reading is 0.02 mL, what is the uncertainty<br />
in the volume delivered?<br />
SOLUTION Suppose that the initial reading is 0.05 (0.02) mL and the final reading<br />
is 17.88 (0.02) mL. The volume delivered is the difference:<br />
17.88 (0.02)<br />
0.05 (0.02)<br />
17.83 (e) e 20.02 2 0.02 2 0.02 8 0.03
Regardless of the initial and final readings, if the uncertainty in each one is 0.02 mL,<br />
the uncertainty in volume delivered is 0.03 mL.<br />
Multiplication and Division<br />
For multiplication and division, first convert all uncertainties to percent relative uncertainties.<br />
Then calculate the error of the product or quotient as follows:<br />
Uncertainty in multiplication<br />
%e 4 2(%e 1 ) 2 (%e 2 ) 2 (%e 3 ) (3-6)<br />
and division:<br />
2<br />
For example, consider the following operations:<br />
First convert absolute uncertainties to percent relative uncertainties.<br />
Then find the percent relative uncertainty of the answer by using Equation 3-6.<br />
The answer is 5.6 4 (4. 0 %).<br />
To convert relative uncertainty to absolute uncertainty, find 4. 0 % of the answer.<br />
4. 0 % 5.6 4 0.04 0 5.6 4 0.2 3<br />
The answer is 5.6 4 (0.2 3 ). Finally, drop the insignificant digits.<br />
5.6 (0.2) (absolute uncertainty)<br />
5.6 (4%) (relative uncertainty)<br />
The denominator of the original problem, 0.59, limits the answer to two digits.<br />
Mixed Operations<br />
1.76 (0.03) 1.89 (0.02)<br />
0.59 (0.02)<br />
1.76 (1. 7 %) 1.89 (1. 1 %)<br />
5.64 e<br />
0.59 (3. 4 %)<br />
4<br />
%e 4 2(1. 7 ) 2 (1. 1 ) 2 (3. 4 ) 2 4. 0 %<br />
Now consider a computation containing subtraction and division:<br />
1.76 (0.03) 0.59 (0.02)<br />
0.619<br />
1.89 (0.02)<br />
0 ?<br />
First work out the difference in the numerator, using absolute uncertainties. Thus,<br />
1.76 (0.03) 0.59 (0.02) 1.17 (0.03 6 )<br />
because 2(0.03) 2 (0.02) 2 0.03 6 .<br />
Then convert to percent relative uncertainties. Thus,<br />
5.64 e 4<br />
1.17 (0.03 6 )<br />
1.89 (0.02) 1.17 (3. 1%)<br />
1.89 (1. 1 %) 0.619 0 (3. 3 %)<br />
because 2(3. 1 %) 2 (1. 1 %) 2 3. 3 %.<br />
The percent relative uncertainty is 3. 3 %, so the absolute uncertainty is 0.03 3 <br />
0.619 0 0.02 0 . The final answer can be written as<br />
0.619 (0.02 0 ) (absolute uncertainty)<br />
0.619 (3. 3 %) (relative uncertainty)<br />
Because the uncertainty begins in the 0.01 decimal place, it is reasonable to round the<br />
result to the 0.01 decimal place:<br />
0.62 (0.02) (absolute uncertainty)<br />
0.62 (3%) (relative uncertainty)<br />
53<br />
3-5 Propagation of Uncertainty<br />
For multiplication and division, use<br />
percent relative uncertainty.<br />
Advice Retain one or more extra<br />
insignificant figures until you have<br />
finished your entire calculation. Then<br />
round to the correct number of digits.<br />
When storing intermediate results in a<br />
calculator, keep all digits without<br />
rounding.<br />
For multiplication and division, use<br />
percent relative uncertainty. Absolute<br />
uncertainty can be found at the end of<br />
the calculation.<br />
The result of a calculation ought to be<br />
written in a manner consistent with its<br />
uncertainty.
54<br />
3 <strong>Experimental</strong> <strong>Error</strong><br />
The real rule: The first uncertain figure<br />
is the last significant figure.<br />
The rationale for finding the uncertainty<br />
in the molecular mass of NH 3 is<br />
explained at the end of this chapter:<br />
N: 14.006 74 0.000 07<br />
3H: 3(1.007 94 0.000 07)<br />
N: 14.006 74 0.000 07<br />
3H: 3.023 82 0.000 21<br />
NH 3 : 17.030 56 20.000 07 2 0.000 21 2<br />
17.030 5 6 0.000 2 2<br />
17.030 6 0.000 2<br />
Convert absolute uncertainty to %<br />
relative uncertainty for multiplication.<br />
The Real Rule for Significant Figures<br />
The first uncertain figure of the answer is the last significant figure. For example, in the<br />
quotient<br />
the uncertainty (0.000 2) occurs in the fourth decimal place. Therefore, the answer is<br />
properly expressed with three significant figures, even though the original data have<br />
four figures. The first uncertain figure of the answer is the last significant figure. The<br />
quotient<br />
is expressed with four significant figures because the uncertainty occurs in the fourth<br />
place. The quotient<br />
0.821 (0.002)<br />
1.022 (0.004)<br />
0.803 (0.002)<br />
is expressed with four figures even though the dividend and divisor each have three<br />
figures.<br />
Example<br />
Significant Figures in Laboratory Work<br />
You prepared a 0.250 M NH 3 solution by diluting 8.45 (0.04) mL of 28.0 (0.5)<br />
wt % NH 3 [density 0.899 (0.003) g/mL] up to 500.0 (0.2) mL. Find the<br />
uncertainty in 0.250 M. The molecular mass of NH 3 , 17.030 6 g/mol, has negligible<br />
uncertainty relative to other uncertainties in this problem.<br />
SOLUTION To find the uncertainty in molarity, we need to find the uncertainty in moles<br />
delivered to the 500-mL flask. The concentrated reagent contains 0.899 (0.003) g<br />
of solution per milliliter. The weight percent tells us that the reagent contains<br />
0.280 (0.005) g of NH 3 per gram of solution. In the following calculations, we<br />
retain extra insignificant digits and round off only at the end.<br />
Grams of NH 3 per<br />
mL in concentrated<br />
reagent<br />
0.002 364 (0.000 003)<br />
0.025 00 (0.000 05)<br />
0.002 664 (0.000 003)<br />
0.025 00 (0.000 05)<br />
0.899 (0.003) g solution<br />
mL<br />
0.899 (0.334%) g solution<br />
mL<br />
0.251 7 (1.82%) g NH 3<br />
mL<br />
0.094 6 (0.000 2)<br />
0.106 6 (0.000 2)<br />
g NH 3<br />
0.280 (0.005)<br />
g solution<br />
g NH 3<br />
0.280 (1.79%)<br />
g solution<br />
because 2(0.334%) 2 (1.79%) 2 1.82%.<br />
Next, we find the moles of ammonia contained in 8.45 (0.04) mL of<br />
concentrated reagent. The relative uncertainty in volume is 0.04/8.45 0.473%.<br />
0.251 7 (1.82%) g NH 3<br />
mL<br />
mol NH 3 <br />
17.030 6 (0%) g NH 3<br />
mol<br />
0.124 9 (1.88%) mol<br />
8.45 (0.473%) mL<br />
because 2(1.82%) 2 (0.473%) 2 (0%) 2 1.88%.<br />
This much ammonia was diluted to 0.500 0 (0.000 2) L. The relative<br />
uncertainty in the final volume is 0.000 2/0.500 0 0.04%. The molarity is
mol NH 3<br />
L<br />
<br />
0.124 9 (1.88%) mol<br />
0.500 0 (0.04%) L<br />
0.249 8 (1.88%) M<br />
because 2(1.88%) 2 (0.04%) 2 1.88%. The absolute uncertainty is 1.88% of<br />
0.249 8 M 0.004 7 M. The uncertainty in molarity is in the third decimal place, so<br />
our final, rounded answer is<br />
55<br />
3-5 Propagation of Uncertainty<br />
[NH 3 ] 0.250 (0.005) M<br />
Exponents and Logarithms<br />
For the function y x a , the percent relative uncertainty in y(%e y ) is equal to a times the<br />
percent relative uncertainty in x(%e x ):<br />
Uncertainty for powers<br />
and roots:<br />
(3-7)<br />
For example, if y 2x x 1/2 , a 2% uncertainty in x will yield a (2%) 1% uncertainty<br />
in y. If y x 2 , a 3% uncertainty in x leads to a (2)(3%) 6% uncertainty in y<br />
(Box 3-2).<br />
If y is the base 10 logarithm of x, then the absolute uncertainty in y (e y ) is proportional<br />
to the relative uncertainty in x (e x /x):<br />
Uncertainty for<br />
logarithm:<br />
y x a 1 %e y a(%e x )<br />
y log x1 e y 1<br />
ln 10<br />
e x<br />
x 0.434 29 e x<br />
x<br />
(3-8)<br />
You should not work with percent relative uncertainty [100 (e x /x)] in calculations<br />
with logs and antilogs, because one side of Equation 3-8 has relative uncertainty and<br />
the other has absolute uncertainty.<br />
1 1 22<br />
To calculate a power or root on your<br />
calculator, use the y x button. For<br />
example, to find a cube root (y 1/3 ), raise<br />
y to the 0.333 333 333 ...power with<br />
the y x button.<br />
Use relative uncertainty (e x /x),<br />
not percent relative uncertainty<br />
[100 (e x /x)], in calculations involving<br />
log x, ln x, 10 x , and e x .<br />
Box 3-2<br />
Propagation of Uncertainty in the Product xx<br />
Table 3-1 says that the uncertainty in the function y x a is<br />
%e y a(%e x ). If y x 2 , then %e y 2(%e x ). A 3% uncertainty<br />
in x leads to a (2)(3%) 6% uncertainty in y.<br />
But what if we just apply the multiplication formula 3-6<br />
to the product xx?<br />
x(e 1 ) x (e 2 ) x 2 (e 3 )<br />
% e 3 2(%e 1 ) 2 (%e 2 ) 2<br />
2(3%) 2 (3%) 2 4. 2 %<br />
Which uncertainty is correct, 6% from Table 3-1 or 4. 2 %<br />
from Equation 3-6?<br />
Table 3-1 (6%) is correct. In the formula y x 2 , the<br />
error in a measured value of x is always positive or always<br />
negative. If the true value of x is 1.00 and the measured value<br />
is 1.01, the computed value of x 2 is (1.01) 2 1.02. That is, if<br />
the measured x is high by 1%, the computed value of x 2 is<br />
high by 2% because we are multiplying the high value by the<br />
high value.<br />
Equation 3-6 presumes that the uncertainty in each factor<br />
of the product x z is random and independent of the<br />
other. In the product x z, the measured value of x could be<br />
high sometimes and the measured value of z could be low<br />
sometimes. In the majority of cases, uncertainty in the product<br />
x z is not as great as the uncertainty in x 2 .<br />
Example. The distance traveled by a falling object in time<br />
1<br />
t is 2gt 2 , where g is the acceleration of gravity. If t has an uncertainty<br />
of 1%, the uncertainty in t 2 is 2(%e t ) 2(1%) 2%.<br />
1<br />
The uncertainty in distance computed from 2gt 2 will also be<br />
2%. If you (incorrectly) used Equation 3-6, you would compute<br />
an uncertainty in distance of 21% 2 1% 2 1. 4 %.<br />
Relative<br />
uncertainty<br />
in x<br />
Relative<br />
uncertainty<br />
in z<br />
Relative<br />
uncertainty<br />
in x · z<br />
Relative<br />
uncertainty<br />
in x 2
56<br />
3 <strong>Experimental</strong> <strong>Error</strong><br />
Table 3-1<br />
Summary of rules for propagation of uncertainty<br />
Function Uncertainty Function Uncertainty<br />
y x 1 x 2 e y 2e 2 x y x a<br />
1<br />
e 2 x 2<br />
%e y a %e x<br />
1 e x<br />
e x<br />
y x 1 x 2 e y 2e 2 x 1<br />
e 2 x 2<br />
y log x e y 0.434 29<br />
ln 10 x<br />
x<br />
e x<br />
y x 1 x 2 %e y 2%e 2 x 1<br />
%e 2 x 2<br />
y ln x e y <br />
x<br />
x 1<br />
e y<br />
y %e y 2%e 2 x y 10 x<br />
1<br />
%e 2 x 2<br />
(ln 10) e x 2.302 6 e<br />
x y<br />
x<br />
2<br />
e y<br />
y e x e<br />
y x<br />
NOTE: x represents a variable and a represents a constant that has no uncertainty. e x /x is the relative error in x<br />
and %e x is 100 e x /x.<br />
The natural logarithm (ln) of x is the number y, whose value is such that x e y ,<br />
where e ( 2.718 28 ...) is called the base of the natural logarithm. The absolute<br />
uncertainty in y is equal to the relative uncertainty in x.<br />
Uncertainty for<br />
natural logarithm:<br />
y ln x1 e y e x<br />
x<br />
(3-9)<br />
Now consider y antilog x, which is the same as saying y 10 x . In this case, the<br />
relative uncertainty in y is proportional to the absolute uncertainty in x.<br />
Uncertainty<br />
for 10 x :<br />
y 10 x 1 e y<br />
y (ln 10) e x 2.302 6 e x<br />
(3-10)<br />
If y e x , the relative uncertainty in y equals the absolute uncertainty in x.<br />
Uncertainty<br />
for e x :<br />
y e x 1 e y<br />
y e x<br />
(3-11)<br />
Appendix C gives a general rule for<br />
propagation of uncertainty for any<br />
function.<br />
Table 3-1 summarizes rules for propagation of uncertainty. You need not memorize the<br />
rules for exponents, logs, and antilogs, but you should be able to use them.<br />
Example<br />
Uncertainty in H Concentration<br />
Consider the function pH log[H ], where [H ] is the molarity of H . For<br />
pH 5.21 0.03, find [H ] and its uncertainty.<br />
SOLUTION First solve the equation pH log[H ] for [H ]: Whenever a b, then<br />
10 a 10 b . If pH log[H ], then log[H ] pH and 10 log[H ]<br />
10 pH . But<br />
10 log[H ]<br />
[H ]. We therefore need to find the uncertainty in the equation<br />
[H ] 10 pH 10(5.21 0.03)<br />
In Table 3-1, the relevant function is y 10 x , in which y [H ] and x (5.21 0.03).<br />
For y 10 x , the table tells us that e y /y 2.302 6 e x .<br />
e y<br />
y 2.302 6 e x (2.302 6)(0.03) 0.069 1<br />
(3-12)<br />
The relative uncertainty in y ( e y /y) is 0.069 1. Inserting the value y 10 5.21 <br />
6.17 10 6 into Equation 3-12 gives the answer:<br />
e y<br />
y <br />
e y<br />
6.17 10 0.069 11 e 6 y 4.26 10 7
The concentration of H is 6.17 (0.426) 10 6 6.2 (0.4) 10 6 M. An<br />
uncertainty of 0.03 in pH gives an uncertainty of 7% in H . Notice that extra digits were<br />
retained in the intermediate results and were not rounded off until the final answer.<br />
57<br />
3-5 Propagation of Uncertainty<br />
Uncertainty in Molecular Mass<br />
What is the uncertainty in the molecular mass of O 2 ? On the inside cover of this book,<br />
we find that the atomic mass of oxygen is 15.999 4 0.000 3 g/mol. Without thinking,<br />
I always used Equation 3-5 for the uncertainty of a sum:<br />
15.999 4 0.000 3<br />
15.999 4 0.000 3<br />
31.998 8e 14444244443<br />
20.000 32 0.000 32 0.000 4 2<br />
The rule for sums in Equation 3-5<br />
The wrong way!<br />
Equation 3-5 is appropriate when the errors in each term are random. One might be<br />
positive and one might be negative. In most cases, the uncertainty in the sum is less<br />
than 0.000 3 0.000 3 0.000 6.<br />
One day a student named Ian told me that he did not know the true mass of a mole of<br />
oxygen, but he was quite sure that every mole of oxygen has the same mass. The uncertainty<br />
of 0.000 3 means that the true mass is in the range 15.999 1 to 15.999 7. If the<br />
true mass were 15.999 7, then the mass of O 2 is 2 15.999 7 31.999 4 g/mol. If the<br />
true mass is 15.999 1, then the mass of O 2 is 2 15.999 1 31.998 2 g/mol. The mass<br />
of O 2 is somewhere in the range 31.998 8 0.000 6. The uncertainty is not<br />
20.000 3 2 0.000 3 2 0.000 4 2 . It is 2 (0.000 3) 0.000 6. The uncertainty<br />
of the mass of n atoms is n (uncertainty of one atom).<br />
Let’s apply this reasoning to find the molecular mass of C 2 H 4 :<br />
2C:2(12.010 7 0.000 8) 24.021 4 0.001 6 d<br />
4H:4(1.007 94 0.000 07) 4.031 76 0.000 28 d 4 0.000 07<br />
28.053 16 ?<br />
(3-13)<br />
To find the uncertainty in the sum of the masses of 2C 4H, we do use Equation 3-5<br />
because the uncertainties in the masses of C and H are independent of each other. One<br />
might be positive and one might be negative. So the molecular mass of C 2 H 4 is<br />
2 0.000 8<br />
28.053 16 20.001 6 2 0.000 28 2<br />
28.053 16 0.001 6<br />
28.053 0.002 g/mol<br />
Uncertainty in mass of n identical atoms<br />
n (uncertainty in atomic mass).<br />
To find the uncertainty in the sum in<br />
Equation 3-13, we do use Equation 3-5.<br />
Multiple Deliveries from a Pipet<br />
A 25-mL Class A volumetric pipet delivers 25.00 0.03 mL. The actual volume can<br />
be in the range of 24.97 to 25.03 mL. The precision of delivering this volume is much<br />
better—typically 0.005 mL. If you deliver 100 mL with 4 aliquots of 25 mL,<br />
the uncertainty in the total volume is approximately 4 0.03 0.12 mL, not<br />
20.03 2 0.03 2 0.03 2 0.03 2 0.06 mL. The reason is the same as the reason<br />
why the uncertainty in the mass of 4 H atoms is 4 0.000 07 g/mol. Whatever the<br />
error of one pipet is, it is always in the same direction.<br />
You can greatly improve the accuracy of using a pipet by calibrating it as described<br />
in Section 2-9. For example, a particular pipet delivers a mean volume of 24.991 mL with<br />
a standard deviation of 0.006 mL in replicate deliveries. If you used this pipet to deliver<br />
4 aliquots, the actual volume delivered would be 4 24.991 99.964 mL. The uncertainty<br />
is not 4 0.006 0.024 mL because the delivery error is sometimes positive and<br />
sometimes negative. The uncertainty is 20.006 2 0.006 2 0.006 2 0.006 2 <br />
0.012 mL.<br />
By calibrating the pipet, we reduce<br />
the uncertainty from 0.12 mL to<br />
0.012 mL.
58 3 <strong>Experimental</strong> <strong>Error</strong><br />
Terms to Understand<br />
absolute uncertainty<br />
accuracy<br />
antilogarithm<br />
characteristic<br />
determinate error<br />
indeterminate error<br />
logarithm<br />
mantissa<br />
natural logarithm<br />
precision<br />
random error<br />
relative uncertainty<br />
significant figure<br />
systematic error<br />
Summary<br />
The number of significant digits in a number is the minimum<br />
required to write the number in scientific notation. The first<br />
uncertain digit is the last significant figure. In addition and<br />
subtraction, the last significant figure is determined by the<br />
number with the fewest decimal places (when all exponents<br />
are equal). In multiplication and division, the number of figures<br />
is usually limited by the factor with the smallest number<br />
of digits. The number of figures in the mantissa of the logarithm<br />
of a quantity should equal the number of significant<br />
figures in the quantity. Random (indeterminate) error affects<br />
the precision (reproducibility) of a result, whereas systematic<br />
Exercises<br />
3-A. Write each answer with a reasonable number of figures.<br />
Find the absolute and percent relative uncertainty for each<br />
answer.<br />
(a) [12.41 (0.09) 4.16 (0.01)] 7.068 2 (0.000 4) ?<br />
(b) [3.26 (0.10) 8.47 (0.05)] 0.18 (0.06) ?<br />
(c) 6.843 (0.008) 10 4 [2.09 (0.04) 1.63 (0.01)] ?<br />
(d) 23.24 0.08 ?<br />
(e) (3.24 0.08) 4 ?<br />
(f) log(3.24 0.08) ?<br />
(g) 10 3.24 0.08 ?<br />
3-B. (a) You have a bottle labeled “53.4 (0.4) wt % NaOH—<br />
density 1.52 (0.01) g/mL.” How many milliliters of<br />
53.4 wt % NaOH will you need to prepare 2.000 L of<br />
0.169 M NaOH?<br />
(b) If the uncertainty in delivering NaOH is 0.01 mL,<br />
calculate the absolute uncertainty in the molarity (0.169 M).<br />
Assume there is negligible uncertainty in the formula mass<br />
of NaOH and in the final volume (2.000 L).<br />
Problems<br />
Significant Figures<br />
3-1. How many significant figures are there in the following<br />
numbers?<br />
(a) 1.903 0<br />
(b) 0.039 10<br />
(c) 1.40 10 4<br />
(determinate) error affects the accuracy (nearness to the<br />
“true” value). Systematic error can be discovered and eliminated<br />
by a clever person, but some random error is always<br />
present. Propagation of uncertainty in addition and subtraction<br />
requires absolute uncertainties 1e 3 2e 2 1 e 2 2 2, whereas<br />
multiplication and division utilize relative uncertainties<br />
1%e 3 2%e 2 1 %e 2 2. Other rules for propagation of error<br />
are found in Table 3-1. Always retain more digits than necessary<br />
during a calculation and round off to the appropriate number<br />
of digits at the end.<br />
3-C. We have a 37.0 (0.5) wt % HCl solution with a density<br />
of 1.18 (0.01) g/mL. To deliver 0.050 0 mol of HCl requires<br />
4.18 mL of solution. If the uncertainty that can be tolerated in<br />
0.050 0 mol is 2%, how big can the absolute uncertainty in<br />
4.18 mL be? (Caution: In this problem, you have to work<br />
backward. You would normally compute the uncertainty in<br />
mol HCl from the uncertainty in volume:<br />
mL solution <br />
g solution<br />
mL solution g HCl<br />
g solution<br />
mol HCl <br />
g HCl<br />
But here we know the uncertainty in mol HCl (2%) and we need<br />
to find what uncertainty in mL solution leads to that 2% uncertainty.<br />
The arithmetic has the form a b c d, for which<br />
%e2<br />
%e2<br />
%e2<br />
%e<br />
2<br />
a b c d. If we know %e a , %e c , and %e d , we<br />
can find %e b by subtraction: %e2<br />
%e2<br />
%e2<br />
%e 2.)<br />
b<br />
mol HCl<br />
3-2. Round each number as indicated:<br />
(a) 1.236 7 to 4 significant figures<br />
(b) 1.238 4 to 4 significant figures<br />
(c) 0.135 2 to 3 significant figures<br />
(d) 2.051 to 2 significant figures<br />
(e) 2.005 0 to 3 significant figures<br />
a<br />
c<br />
d
Problems 59<br />
Reading<br />
(1.46 mm)<br />
Digit 6 on lower scale aligned<br />
with marking on upper scale<br />
0 1 2 3 4 5<br />
0 1 2 3 4 5 6 7 8 9 0<br />
(a)<br />
0 1 2 3 4 5<br />
0 1 2 3 4 5 6 7 8 9 0<br />
0 1 2 3 4 5<br />
0 1 2 3 4 5 6 7 8 9 0<br />
(b)<br />
(c)<br />
Figure for Problem 3-4.<br />
3-3. Round each number to three significant figures:<br />
(a) 0.216 74<br />
(b) 0.216 5<br />
(c) 0.216 500 3<br />
3-4. Vernier scale. The figure above shows a scale found on<br />
instruments such as a micrometer caliper used for accurately<br />
measuring dimensions of objects. The lower scale slides<br />
along the upper scale and is used to interpolate between the<br />
markings on the upper scale. In (a) the reading (at the lefthand<br />
0 of the lower scale) is between 1.4 and 1.5 on the upper<br />
scale. To find the exact reading, observe which mark on the<br />
lower scale is aligned with a mark on the upper scale.<br />
Because the 6 on the lower scale is aligned with the upper<br />
scale, the correct reading is 1.46. Write the correct readings in<br />
(b) and (c) and indicate how many significant figures are in<br />
each reading.<br />
3-5. Write each answer with the correct number of digits.<br />
(a) 1.021 2.69 3.711<br />
(b) 12.3 1.63 10.67<br />
(c) 4.34 9.2 39.928<br />
(d) 0.060 2 (2.113 10 4 ) 2.849 03 10 6<br />
(e) log(4.218 10 12 ) ?<br />
(f) antilog(3.22) ?<br />
(g) 10 2.384 ?<br />
3-6. Using the correct number of significant figures, find the<br />
formula mass of (a) BaCl 2 and (b) C 6 H 4 O 4 . Use the periodic<br />
table inside the cover of this book to find uncertainties in<br />
atomic masses.<br />
3-7. Write each answer with the correct number of significant<br />
figures.<br />
(a) 1.0 2.1 3.4 5.8 12.300 0<br />
(b) 106.9 31.4 75.500 0<br />
(c) 107.868 (2.113 10 2 ) (5.623 10 3 ) 5 519.568<br />
(d) (26.14/37.62) 4.38 3.043 413<br />
(e) (26.14/(37.62 10 8 )) (4.38 10 2 ) 3.043 413 10 10<br />
(f) (26.14/3.38) 4.2 11.933 7<br />
(g) log(3.98 10 4 ) 4.599 9<br />
(h) 10 6.31 4.897 79 10 7<br />
Types of <strong>Error</strong><br />
3-8. Why do we use quotation marks around the word true in<br />
the statement that accuracy refers to how close a measured<br />
value is to the “true” value?<br />
3-9. Explain the difference between systematic and random<br />
errors.<br />
3-10. Suppose that in a gravimetric analysis, you forget to dry<br />
the filter crucibles before collecting precipitate. After filtering<br />
the product, you dry the product and crucible thoroughly<br />
before weighing them. Is the error in the mass of product that<br />
you report a systematic or a random error? Is the mass of product<br />
always high or always low?<br />
3-11. State whether the errors in (a)–(d) are random or systematic:<br />
(a) A 25-mL transfer pipet consistently delivers 25.031 <br />
0.009 mL when drained from the mark.<br />
(b) A 10-mL buret consistently delivers 1.98 0.01 mL when<br />
drained from exactly 0 to exactly 2 mL and consistently delivers<br />
2.03 mL 0.02 mL when drained from 2 to 4 mL.<br />
(c) A 10-mL buret delivered 1.983 9 g of water when drained<br />
from exactly 0.00 to 2.00 mL. The next time I delivered water<br />
from the 0.00- to the 2.00-mL mark, the delivered mass was<br />
1.990 0 g.<br />
(d) Four consecutive 20.0-L injections of a solution into a<br />
chromatograph were made, and the area of a particular peak<br />
was 4 383, 4 410, 4 401, and 4 390 units.
60 3 <strong>Experimental</strong> <strong>Error</strong><br />
Cheryl Cynthia Carmen Chastity Figure for Problem 3-12.<br />
3-12. Cheryl, Cynthia, Carmen, and Chastity shot the targets<br />
above at Girl Scout camp. Match each target with the proper<br />
description.<br />
(a) accurate and precise (c) precise but not accurate<br />
(b) accurate but not precise (d) neither precise nor accurate<br />
3-13. Rewrite the number 3.123 56 (0.167 89%) in the forms<br />
(a) number ( absolute uncertainty) and (b) number ( percent<br />
relative uncertainty) with an appropriate number of digits.<br />
Propagation of Uncertainty<br />
3-14. Find the absolute and percent relative uncertainty and<br />
express each answer with a reasonable number of significant<br />
figures.<br />
(a) 6.2 (0.2) 4.1 (0.1) ?<br />
(b) 9.43 (0.05) 0.016 (0.001) ?<br />
(c) [6.2 (0.2) 4.1 (0.1)] 9.43 (0.05) ?<br />
(d) 9.43 (0.05) {[6.2 (0.2) 10 3 ] <br />
[4.1 (0.1) 10 3 ]} ?<br />
3-15. Find the absolute and percent relative uncertainty and<br />
express each answer with a reasonable number of significant<br />
figures.<br />
(a) 9.23 (0.03) 4.21 (0.02) 3.26 (0.06) ?<br />
(b) 91.3 (1.0) 40.3 (0.2) / 21.1 (0.2) ?<br />
(c) [4.97 (0.05) 1.86 (0.01)] / 21.1 (0.2) ?<br />
(d) 2.016 4 (0.000 8) 1.233 (0.002) 4.61 (0.01) ?<br />
(e) 2.016 4 (0.000 8) 10 3 1.233 (0.002) 10 2 <br />
4.61 (0.01) 10 1 ?<br />
(f) [3.14 (0.05)] 1/3 ?<br />
(g) log[3.14 (0.05)] ?<br />
3-16. Verify the following calculations:<br />
(a) 23.141 5 (0.001 1) 1.772 4 3 (0.000 3 1 )<br />
(b) log[3.141 5 (0.001 1)] 0.497 1 4 (0.000 1 5 )<br />
(c) antilog[3.141 5 (0.001 1)] 1.385 2 (0.003 5 ) 10 3<br />
(d) ln[3.141 5 (0.001 1)] 1.144 7 0 (0.000 3 5 )<br />
20.104 (0.006)<br />
(e) loga 0.80 0 (0.01 5 )<br />
0.051 1 (0.000 9) b<br />
3-17. When using Class 1 standard weights (Table 2-1) to calibrate<br />
your balance, you want to place exactly 1 g on the balance.<br />
Is it more accurate to use a single 1-g weight or the combination<br />
500 mg 200 mg 200 mg 100 mg? Compare<br />
the uncertainties in mass for the two choices.<br />
3-18. Express the molecular mass (uncertainty) of<br />
C 9 H 9 O 6 N 3 with the correct number of significant figures.<br />
3-19. (a) Show that the formula mass of NaCl is 58.442 5<br />
(0.000 9) g/mol.<br />
(b) To prepare a solution of NaCl, you weigh out<br />
2.634 (0.002) g and dissolve it in a volumetric flask whose volume<br />
is 100.00 (0.08) mL. Express the molarity of the solution,<br />
along with its uncertainty, with an appropriate number of digits.<br />
3-20. What is the true mass of water weighed at 24°C in the air<br />
if the apparent mass is 1.034 6 0.000 2 g? The density of air<br />
is 0.001 2 0.000 1 g/mL and the density of balance weights<br />
is 8.0 0.5 g/mL. The uncertainty in the density of water in<br />
Table 2-7 is negligible in comparison to the uncertainty in the<br />
density of air.<br />
3-21. Twelve dietary iron tables were analyzed by the gravimetric<br />
procedure in Section 1-4 and the final mass of Fe 2 O 3<br />
(FM 159.688) was 0.277 4 0.001 8 g. Find the average mass<br />
of Fe per tablet. (Relative uncertainties in atomic masses are<br />
small compared with relative uncertainty in the mass of Fe 2 O 3 .<br />
Neglect uncertainties in atomic masses in this problem.)<br />
3-22. We can measure the concentration of HCl solution (a procedure<br />
called standardizing the solution) by reaction with pure<br />
sodium carbonate: 2H Na 2 CO 3<br />
B 2Na H 2 O CO 2 .<br />
A volume of 27.35 0.04 mL of HCl solution was required<br />
for complete reaction with 0.967 4 0.000 9 g of Na 2 CO 3<br />
(FM 105.988 0.001). Find the molarity of the HCl and its<br />
absolute uncertainty.<br />
3-23. Avogadro’s number can be computed from the following<br />
measurable quantities for a particular element: 2 (1) the atomic<br />
mass of the element (obtained from the mass and abundance of<br />
each isotope), (2) the density of a crystal of the element, (3)<br />
the size of the unit cell (the smallest repeating structural unit)<br />
in the crystal, and (4) the number of atoms in the unit cell.<br />
Extremely accurate measurements for silicon give an atomic<br />
mass of m Si 28.085 384 2 (35) g/mol, where 35 is the<br />
standard deviation in the last two digits. The density is <br />
2.329 031 9 (18) g/cm 3 , the size of the cubic unit cell is c 0 <br />
5.431 020 36 (33) 10 8 cm, and there are 8 atoms per unit<br />
cell. Avogadro’s number is computed from the equation<br />
N A <br />
m Si<br />
(ρc 03 )>8<br />
From the measured properties and their uncertainties (standard<br />
deviations), compute Avogadro’s number and its uncertainty. To<br />
find the uncertainty of c 03 , use the function y x a in Table 3-1.