Salton Sea Preliminary In-Sea Geotechnical Investigation
Salton Sea Preliminary In-Sea Geotechnical Investigation
Salton Sea Preliminary In-Sea Geotechnical Investigation

You also want an ePaper? Increase the reach of your titles
YUMPU automatically turns print PDFs into web optimized ePapers that Google loves.
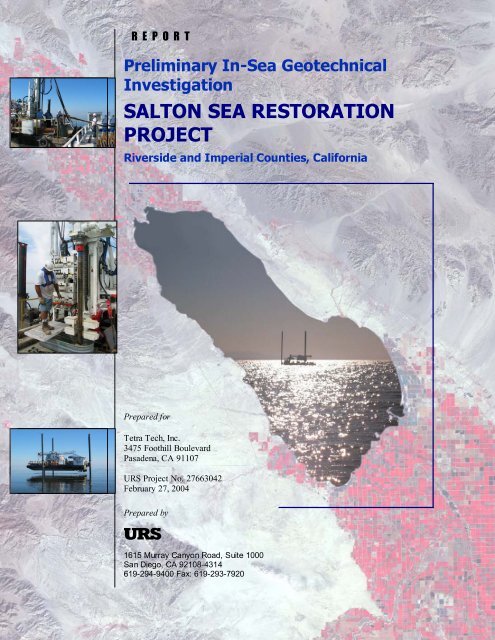
R E P O R T<strong>Preliminary</strong> <strong>In</strong>-<strong>Sea</strong> <strong>Geotechnical</strong><strong>In</strong>vestigationSALTON SEA RESTORATIONPROJECTRiverside and Imperial Counties, CaliforniaPrepared forTetra Tech, <strong>In</strong>c.3475 Foothill BoulevardPasadena, CA 91107URS Project No. 27663042February 27, 2004Prepared by1615 Murray Canyon Road, Suite 1000San Diego, CA 92108-4314619-294-9400 Fax: 619-293-7920
TABLE OF CONTENTSExecutive Summary................................................................................................................ ES-1Section 1 <strong>In</strong>troduction ........................................................................................................ 1-11.1 Background of Restoration Project ..................................................................1-11.2 Purpose and Scope of <strong>Preliminary</strong> <strong>In</strong>vestigation...............................................1-2Section 2 <strong>Preliminary</strong> <strong>Geotechnical</strong> <strong>In</strong>vestigation.......................................................... 2-12.1 Previous <strong>In</strong>vestigations ...................................................................................2-12.1.1 Bureau of Reclamation <strong>In</strong>vestigation....................................................2-12.1.2 Geothermal <strong>In</strong>vestigations...................................................................2-12.1.3 Sediment Characterization Studies.......................................................2-22.2 <strong>Geotechnical</strong> Explorations ..............................................................................2-22.2.1 Equipment Utilized.............................................................................2-22.2.2 <strong>In</strong>-<strong>Sea</strong> Borings ...................................................................................2-32.2.3 <strong>In</strong>-<strong>Sea</strong> Cone Penetration Testing..........................................................2-32.3 Laboratory Testing.........................................................................................2-42.3.1 <strong>In</strong>dex Testing .....................................................................................2-42.3.2 Strength Testing .................................................................................2-42.3.3 Consolidation Testing.........................................................................2-4Section 3 Site Conditions................................................................................................... 3-13.1 Geologic Setting.............................................................................................3-13.1.1 Structure ............................................................................................3-13.1.2 Stratigraphy .......................................................................................3-13.2 Tectonic Setting .............................................................................................3-23.2.1 Fault Zones ........................................................................................3-23.2.2 Historical Seismicity...........................................................................3-23.3 Surface and <strong>Sea</strong>floor.......................................................................................3-33.3.1 Surrounding Topography ....................................................................3-33.3.2 Bathymetry ........................................................................................3-33.4 Subbottom Conditions ....................................................................................3-43.4.1 <strong>Sea</strong>floor Deposits ...............................................................................3-43.4.2 Soft Lacustrine Deposits .....................................................................3-43.4.3 Upper Alluvial Deposits......................................................................3-43.4.4 Upper Stiff Lacustrine Deposits...........................................................3-53.4.5 Lower Alluvial Deposits .....................................................................3-53.4.6 Lower Stiff Lacustrine Deposits ..........................................................3-53.5 Currents and Waves........................................................................................3-5Section 4 Potential Geologic and Seismic Hazards........................................................ 4-14.1 Faulting and Seismic Ground Deformations .....................................................4-14.2 Ground Shaking.............................................................................................4-14.3 Liquefaction...................................................................................................4-24.4 Seiches ..........................................................................................................4-2W:\27663042\00005-c-r.doc\1-Mar-04\SDG i
TABLE OF CONTENTSSection 5 <strong>Preliminary</strong> Engineering Characterization...................................................... 5-15.1 Engineering Properties....................................................................................5-15.1.1 <strong>In</strong>dex Properties .................................................................................5-15.1.2 Strengths............................................................................................5-25.1.3 Compressibility ..................................................................................5-25.2 <strong>Sea</strong>floor Deposits...........................................................................................5-45.2.1 <strong>In</strong>dex Properties .................................................................................5-45.2.2 Strength.............................................................................................5-45.2.3 Compressibility ..................................................................................5-55.3 Soft Lacustrine Deposits.................................................................................5-55.3.1 <strong>In</strong>dex Properties .................................................................................5-55.3.2 Strength.............................................................................................5-65.3.3 Compressibility ..................................................................................5-65.4 Stiff Lacustrine Deposits.................................................................................5-65.4.1 <strong>In</strong>dex Properties .................................................................................5-65.4.2 Strengths............................................................................................5-75.4.3 Compressibility ..................................................................................5-75.5 Alluvial Deposits ...........................................................................................5-75.5.1 Material Properties .............................................................................5-75.5.2 Strength.............................................................................................5-75.5.3 Compressibility ..................................................................................5-85.6 Other Engineering Properties ..........................................................................5-85.6.1 Corrosivity.........................................................................................5-85.6.2 Pinhole Dispersion..............................................................................5-8Section 6 <strong>Preliminary</strong> Embankment Design Considerations......................................... 6-16.1 Embankment Stability ....................................................................................6-16.2 Foundation Preparation...................................................................................6-26.3 Ground Improvement .....................................................................................6-26.4 Post-Construction Settlements.........................................................................6-36.5 <strong>In</strong>-<strong>Sea</strong> Borrow Sources ...................................................................................6-4Section 7 Further Studies .................................................................................................. 7-17.1 Revised and Alternative Restoration Concepts .................................................7-17.2 Fault Locations ..............................................................................................7-17.3 Additional <strong>Geotechnical</strong> <strong>In</strong>vestigations............................................................7-27.4 Dynamic Response of Embankments ...............................................................7-2Section 8 Uncertainties and Limitations .......................................................................... 8-1Section 9 References.......................................................................................................... 9-1W:\27663042\00005-c-r.doc\1-Mar-04\SDG ii
List of Tables, Figures, and AppendicesTablesTable 1Table 2Table 3Table 4Table 5Table 6Table 7Table 8Table 9Table 10Table 11Summary of <strong>In</strong>-<strong>Sea</strong> ExplorationsSummary of Laboratory Tests PerformedSummary of Material PropertiesSummary of Unconsolidated Undrained Triaxial Test DataSummary of Consolidated Undrained Triaxial Test DataSummary of Consolidation Test DataRecent Large Earthquakes in the <strong>Salton</strong> Trough<strong>Preliminary</strong> Characterization of Material PropertiesResults of <strong>Preliminary</strong> Embankment Stability AnalysesResults of <strong>Preliminary</strong> Embankment Settlement AnalysesResults of <strong>Preliminary</strong> Settlement Rate AnalysesFiguresFigure 1 Vicinity MapFigure 2 Plan of ExplorationsFigure 3 Photographs of Field OperationsFigure 4 Photographs of SamplesFigure 5 Photographs of CPT OperationsFigure 6 Geology MapFigure 7 Legend for Geology MapFigure 8 Regional Fault and Epicenter MapFigure 9 Subsurface Cross-Section A-A’Figure 10 Subsurface Cross-Section B-B’Figure 11 Subsurface Cross-Section C-C’Figure 12 Subsurface Cross-Section D-D’Figure 13 Subsurface Cross-Section E-E’Figure 14 Comparison of Boring 7 with CPT 8Figure 15 Comparison of Boring 26 with CPT 3Figure 16 Water Content vs. Depth (Boring 2)Figure 17 Water Content vs. Depth (Borings 2, 4, 5, 6, 7 and 26)Figure 18 Water Content vs. Depth (Borings 11, 14 and 17)Figure 19 Water Content vs. Depth (Borings 19 and 20)Figure 20 Atterberg Limit Test ResultsFigure 21 Torvane TM Data vs. DepthFigure 22 Undrained Shear Strength vs. Effective StressFigure 23 Compression Ratio vs. Water ContentFigure 24 Particle Sizes of <strong>In</strong>-<strong>Sea</strong> Granular MaterialAppendicesAppendix AAppendix BAppendix CAppendix D<strong>In</strong>-<strong>Sea</strong> Borings<strong>In</strong>-<strong>Sea</strong> Cone Penetration TestingLaboratory TestingStatic Slope Stability AnalysesW:\27663042\00005-c-r.doc\1-Mar-04\SDG iii
List of Acronyms and AbbreviationsASTM American Society for Testing and Materialsc’ Effective cohesionC αCoefficient of Secondary CompressionC cCompression <strong>In</strong>dexC rRecompression <strong>In</strong>dexCPTCone Penetration TestCRCompression RatioC vCoefficient of Secondary Compressionc uUndrained Shear StrengthEIS/EIR Environmental Impact Statement/Environmental Impact ReportE sElastic ModulusGPSGlobal Positioning SystemICUIsotropically Consolidated Undrained (Triaxial Compression Test)LILiquidity <strong>In</strong>dexLLLiquid Limitmg/LMilligrams per LiterMSLMean <strong>Sea</strong> Level(N 1 ) 60 Normalized SPT sampler blow countNAD 83 North American Datum 1983OCROverconsolidation RatioPIPlasticity <strong>In</strong>dexPLPlastic LimitpsfPounds per square footq tUnit tip resistance from CPTR fRatio of unit friction to tip resistance from CPTSBTSoil Behavior TypeSPTStandard Penetration TestSSA<strong>Salton</strong> <strong>Sea</strong> AuthoritytsfTons per square footU dDynamic pore pressure from CPTUSCSUnified Soil Classification SystemUSBRUnited States Bureau of ReclamationUUUnconsolidated Undrained (Triaxial Compression Test)φ’ Effective friction angleσ p ’Preconsoldation pressureσ v ’Vertical effective stressW:\27663042\00005-c-r.doc\1-Mar-04\SDG iv
Executive SummaryThis report provides the results of a preliminary geotechnical investigation performed to support theconceptual design of a preferred restoration alternative for the <strong>Salton</strong> <strong>Sea</strong> (<strong>Sea</strong>). Various alternatives havebeen proposed to control the salinity and the elevation of the <strong>Sea</strong>. Many of these alternatives includeconstruction of some type of earthen structures (dikes, barriers or dams) within the area currentlyoccupied by the <strong>Sea</strong>. These structures would reduce the evaporative surface of the <strong>Sea</strong>, and provide areasfor discharge of salt water.The preliminary geotechnical investigation was performed primarily to evaluate the foundation conditionsfor earthen embankments. The requirements for preparation of foundations soils for the embankments area critical item in the conceptual designs of the restoration alternatives. Also, many of the contemplatedrestoration alternatives involve importing large quantities of materials for embankment construction. Asecondary objective of the investigation was to evaluate the potential of obtaining suitable borrowmaterials from within the <strong>Sea</strong> for embankment construction.Previous investigations within the <strong>Sea</strong> have been very limited. These past investigations have also beenprimarily focused at the southern end of the <strong>Sea</strong>. Drilled and sampled borings and Cone PenetrationsTests (CPTs) were utilized to further explore the subsurface conditions within the <strong>Sea</strong> for this preliminarygeotechnical investigation. A self-propelled jack-up barge was utilized to provide a stable platform for theexploration activities. A total of 11 borings and 17 CPTs were completed throughout the <strong>Sea</strong> during theexploration program, to depths ranging from 30 to 150 feet below the seafloor. A series of borings andCPTs were performed along a mid-<strong>Sea</strong> alignment, trending southwest to northeast at the narrowest part ofthe <strong>Sea</strong>, for a probable dam or barrier location. Soil samples obtained from the borings were furthercharacterized by laboratory testing. This testing included moisture content, bulk density, particle size,plasticity indices (Atterberg limits), strength and consolidation tests.The preliminary investigation identified six significant stratigraphic layers below the seafloor; a seafloordeposit, a soft lacustrine deposit, an upper alluvial deposit, an upper stiff lacustrine deposit, a loweralluvial deposit, and a lower stiff lacustrine deposit. The seafloor deposit consists of Recent sedimentsthat have most likely been deposited in the lake environment and have never been dried out or desiccated.As a result, they are soft in consistency and weak in strength. The lacustrine deposits are sediments thatwere laid down in ancient ephermeral lakes and have possibly gone through wetting and drying cycles. Asa result, the consistencies and strengths of these materials are variable. The alluvial deposits wereencountered near the shoreline of the present <strong>Sea</strong>, primarily along the western shore. The alluvial depositsdo contain some fine sands and typically grade laterally (with distance from the shoreline) into thelacustrine deposits.The soft seafloor and lacustrine deposits will have a significant impact on the design of embankments inthe <strong>Sea</strong>. <strong>In</strong> the central and eastern portion of the mid-<strong>Sea</strong> alignment, these soft soils extend to depths of 40to 45 feet. The low shear strength of the soft soils will require that they either be removed and replacedwith suitable materials, strengthened in situ, or the embankment/structure be designed such thatinstabilities would not occur in the weak soils. <strong>Preliminary</strong> static stability analyses indicate that somecombination of flatter embankment slopes with some overexcavation of the very soft soils may provide astable embankment. Alternatively, ground improvement could be used to strengthen the foundation soilsto allow steeper embankment slopes. However, the seismic response of the embankment may requireflatter slopes, ground improvement of the embankment fills, and/or alternative concepts that are notW:\27663042\00005-c-r.doc\1-Mar-04\SDG ES-1
Executive Summarysusceptible to seismic instabilities. The soft soils are also compressible, and post-construction settlementswill need to be a consideration in the design of any embankment or structure. <strong>Preliminary</strong> estimates of thesettlement magnitudes and rates are provided. <strong>Preliminary</strong> engineering characterization of the soils’strengths and compressibilities are also provided for use in conceptual design.The investigation indicates that most of the area of the <strong>Sea</strong> is immediately underlain by the soft seafloorand lacustrine deposits and areas were not identified that would have more favorable foundationconditions. Selection of favorable embankment alignments could be made based on bathymetry (tominimize height of embankment) and other environmental and political factors. Based on bathymetry andlength, the mid-<strong>Sea</strong> location would provide for an optimum location to maximize reduction in evaporativesurface area and minimize embankment quantities.Large quantities of suitable materials will be required to construct the proposed embankments. Themajority of the materials encountered in this investigation were fine-grained; granular materials would bepreferred for embankment construction. Some granular (sandy) materials were identified within thealluvial deposits that could possibly be excavated using dredging techniques and used as borrow forembankments. These were located primarily along the western shore of the <strong>Sea</strong>. However, hydraulicallyplaced embankment fills would be susceptible to seismically induced liquefaction.Additional studies should be performed to support selection and design of a preferred alternative forrestoration of the <strong>Sea</strong>. Conceptual designs should be developed for restoration alternatives that recognizethe subbottom conditions as they are currently defined. This may involve modifications of the conceptualdesigns that have already been developed for the mid-<strong>Sea</strong> dam or barrier, or entirely new concepts.The San Andreas Fault is mapped immediately east of the <strong>Sea</strong>. Seismicity data and the results of thecurrent investigations do not preclude that active fault strands could cross the locations of plannedstructures. Marine geophysical surveys should be performed to evaluate the presence, or absence of faultswithin the <strong>Sea</strong> and the potential for fault rupture.As the restoration concepts are further developed, additional geotechnical explorations will be warranted.The subsurface conditions encountered in those investigations could significantly influence the type of therestoration alternative and its location. These additional investigations should include marine geophysicalsurveys followed by in-<strong>Sea</strong> explorations. A reconnaissance level study should also be undertaken toidentify potential upland borrow areas for both granular materials and riprap in the vicinity of the <strong>Sea</strong>.Subsurface explorations should then be performed in the areas identified to confirm the quality of thepotential borrow materials.The San Andreas, or other nearby faults, will produce strong ground shaking at the <strong>Sea</strong>. Seismic responsestudies should be performed of any proposed embankments or structures to evaluate whether suitableperformance will be obtained with the conceptual designs.W:\27663042\00005-c-r.doc\1-Mar-04\SDG ES-2
SECTIONONE<strong>In</strong>troductionSECTION 1INTRODUCTIONThis report presents the results of URS Corporation’s (URS) preliminary geotechnical investigation tosupport selection of a preferred alternative for restoration of the <strong>Salton</strong> <strong>Sea</strong> (<strong>Sea</strong>). The <strong>Sea</strong> is located inRiverside and Imperial Counties in southern California, south of <strong>In</strong>dio and north of El Centro. Thevicinity of the <strong>Sea</strong> is shown in Figure 1. The <strong>Sea</strong> is situated in a closed basin, more than 200 feet belowsea (ocean) level, and has no natural outlet. The primary objective of the restoration alternative will to becontrol the salinity and elevation of the <strong>Sea</strong>.This report presents results of the field explorations and laboratory testing that have been performed aspart of the investigation. It also presents geotechnical considerations for conceptual development ofrestoration alternatives, and recommendations for additional studies that should be undertaken. Thisreport has been prepared for Tetra Tech, <strong>In</strong>c. and the <strong>Salton</strong> <strong>Sea</strong> Authority (SSA) for use in developmentof restoration alternatives.1.1 BACKGROUND OF RESTORATION PROJECTThe current <strong>Sea</strong> was formed between 1905 and 1907 when an irrigation control structure on the ColoradoRiver (in Mexico) was breached, allowing the entire river to flow into the <strong>Salton</strong> Basin for a period of 18months. Since that time, agricultural drainage flows from the Imperial, Coachella, and Mexicali Valleyshas sustained the <strong>Sea</strong>. Recent annual inflows have been in balance with the evaporative losses from the<strong>Sea</strong>, resulting in a fairly stable <strong>Sea</strong> elevation. However, seasonal fluctuations have contributed toalternately flooding and stranding of facilities along the shoreline. Currently, the <strong>Sea</strong> is about 35 mileslong and 15 miles wide with a surface elevation of about –227 feet Mean <strong>Sea</strong> Level (MSL).The inflows contribute four to five million tons of salt each year to the <strong>Sea</strong>. Since the <strong>Sea</strong> is a terminalbody of water, the salinity of the <strong>Sea</strong> has continued to rise since it was flooded. Currently, the salinity ofthe <strong>Sea</strong> is about 44,000 milligrams per liter (mg/L); about 25% saltier than the ocean. Water quality issuesare compounded by eutrophic (nutrient-rich) conditions that stimulate the growth in aquatic life, oftenresulting in the reduction of dissolved oxygen.The <strong>Sea</strong> is a productive sport fishery and provides important migratory and resident bird habitat withinthe Pacific Flyway. The increasing salinity and eutrophic conditions will threaten these habitats. <strong>In</strong>addition, the fluctuations in the sea level and the deteriorating water quality have limited the potential foreconomic and recreational development at the <strong>Sea</strong>. To improve the environmental conditions, andpromote recreational and economic development, various studies have been undertaken to evaluaterestoration alternatives for the <strong>Sea</strong>.An early investigative report was prepared in 1965, a Federal-State Reconnaissance <strong>In</strong>vestigation wasconducted in 1969, and a Federal-State Feasibility Study was completed in 1974 (USBR, 1974).However, a rising water surface elevation, and the consequential stabilization of salinity levels, delayedthe need for salinity control measures at that time.Further studies on the deterioration of the water quality of the <strong>Sea</strong> were initiated in the mid-1990s. Areport was issued in 1998 that outlined conceptual designs for various restoration alternatives (USBR,1998). A draft EIS/EIR was issued (Tetra Tech, 2000) that considered the environmental impacts ofW:\27663042\00005-c-r.doc\1-Mar-04\SDG 1-1
SECTIONONE<strong>In</strong>troductionvarious restoration alternatives. Because of uncertainties on future inflows to the <strong>Sea</strong>, this draft EIS/EIRwas never finalized. Since then, a number of alternative restoration schemes have been developed inresponse to new information and the Quantification Settlement Agreement (which will determine futureinflows to the <strong>Sea</strong>) being signed by southern California water and irrigation districts.Early in 2003, concepts were developed for a mid-<strong>Sea</strong> dam (USBR, 2003a). The dam would be locatedalong a northeast-southwest trending alignment at the narrowest width of the <strong>Sea</strong>. The dam would allowone side of the <strong>Sea</strong> to shrink where salt water would be released to control salinity levels on the otherside. The concepts developed for the mid-<strong>Sea</strong> dam included a 1) “seismic dike” consisting of ancompacted earthen embankment constructed in a dewatered area, 2) a steel sheet pile cellular dam with acompacted earth dam constructed when one side of the <strong>Sea</strong> became dry, and 3) a dumped fill dike withslurry wall cutoff.Later in 2003, concepts were developed for a mid-<strong>Sea</strong> barrier (USBR, 2003b). The barrier would onlyseparate water of different salinities and would not have a large hydraulic head difference between thesides of the barrier. The barrier would be in an alignment similar to that proposed for the mid-<strong>Sea</strong> dam.The concepts developed for the barrier included 1) a dumped fill barrier, 2) a rock dike with a dredged fillbarrier, and 3) a “beach barrier” constructed of hydraulically placed fills. Development of both the damand the barrier concepts recognized that the subbottom conditions at the mid-<strong>Sea</strong> location were unknownand were a critical factor in the feasibility and estimated cost of the conceptual designs. The suitability ofsubbottom materials for use in embankment construction was another unknown that could have a majorimpact on the cost of the restoration schemes.1.2 PURPOSE AND SCOPE OF PRELIMINARY INVESTIGATIONThe purpose of the preliminary geotechnical investigation was to evaluate the subbottom conditionsthroughout the <strong>Sea</strong>. This information could then be used to support the conceptual design of a preferredrestoration alternative. The scope of the investigation included the following tasks:• Task 1 – Mobilization• Task 2 – <strong>In</strong>-<strong>Sea</strong> Explorations• Task 3 – Laboratory Testing• Task 4 – <strong>Geotechnical</strong> <strong>In</strong>terpretation• Task 5 – <strong>Geotechnical</strong> Data Report• Task 6 – Update Conceptual Design MemosA self-propelled jackup barge was mobilized to the <strong>Sea</strong> to provide a stable platform for the explorations.The in-<strong>Sea</strong> explorations included drilled and sampled borings and Cone Penetration Tests (CPTs).Laboratory tests were performed on samples obtained from the borings to characterize the engineeringproperties of the subbottom soils. The results of the field explorations and laboratory testing were used toformulate interpretations of the subbottom stratigraphy and their respective engineering properties. Thisreport provides those interpretations, as well as detailed results of the field explorations and laboratorytesting. The updated conceptual design memos will be provided in separate documents.W:\27663042\00005-c-r.doc\1-Mar-04\SDG 1-2
SECTIONTWO<strong>Preliminary</strong> <strong>Geotechnical</strong> <strong>In</strong>vestigationSECTION 2PRELIMINARY GEOTECHNICAL INVESTIGATIONThe preliminary geotechnical investigation included a review of previous investigations at the <strong>Sea</strong>,additional field explorations, and laboratory testing. It should be recognized that the scope of theinvestigation is preliminary and additional investigations will be warranted as the restoration concepts arefurther developed.2.1 PREVIOUS INVESTIGATIONSPrevious investigations within the <strong>Sea</strong> have been very limited. These past investigations have also beenprimarily focused at the southern end of the <strong>Sea</strong>. However, this information was reviewed to helpformulate a characterization of the subbottom materials. The following sections summarize the mostsignificant of the previous investigations.2.1.1 Bureau of Reclamation <strong>In</strong>vestigationA water-based exploration program was conducted to evaluate the feasibility of a 37-mile long dikestructure that would impound about a 50 square mile area within the southeastern end of the <strong>Sea</strong> (USBR,1974). This exploration program included a marine geophysical program to profile the subbottomgeologic structure along part of the proposed dike alignment, a program of manually pushing ¾-inchdiameter rods into the soft seafloor sediments at 60 sites, and seven borings located along the proposeddike alignment. The geophysical program provided limited results due to problems with strong multiplereflections and equipment failures. The boring program included thin-wall sampling, Standard PenetrationTests, and vane shear testing. The locations of the borings are shown in Figure 2.This investigation found that the foundation soils of the proposed dike would be comprised primarily oflacustrine materials referred to as the Lake Cahuilla deposits. The materials typically encountered werefat clay and were primarily oxidized, exhibiting buff- to tan-brown colors. Primarily oxidized sedimentswould suggest a playa-type depositional environment. More sandy materials were encountered along theextreme southwest portion of the proposed dike area. Overlying the lacustrine materials, a seafloorsediment that may have been deposited subsequent to the creation of the <strong>Salton</strong> <strong>Sea</strong> was encountered.That sediment was a chemically reduced, dark gray to black, clay with infrequent thin sandy lenses.The thickness of the soft sediments as penetrated by the hand probes ranged from less than a foot toalmost 16 feet. However, it was stated that the skin friction on the rod appeared to contribute significantlyto the pushing resistance and that the thickness of the soft sediments may in fact be deeper than the depthof rod penetration achieved by manually pushing.2.1.2 Geothermal <strong>In</strong>vestigationsA number of investigations have performed in the <strong>Sea</strong> related to development of the geothermal resourcesat the southern end of the <strong>Sea</strong>. These have included regional geophysical surveys as well as drilled holes,primarily to measure temperature gradients. A local gravity maximum is centered over part of thegeothermal field (Biehler, 1971). This anomaly has been attributed to either an increase in density ofW:\27663042\00005-c-r.doc\1-Mar-04\SDG 2-1
SECTIONTWO<strong>Preliminary</strong> <strong>Geotechnical</strong> <strong>In</strong>vestigationsediments resulting from hydrothermal alteration, or the intrusion of dikes and sills into the sedimentarysection, or a combination of these factors.During the fall of 1985, the Lawrence Livermore National Laboratory and the Sandia NationalLaboratories cooperated in drilling a series of shallow (80 meters deep) holes for thermal studies in thesouthern <strong>Salton</strong> <strong>Sea</strong> (Lawrence Livermore National Laboratories, 1987). During this drilling program,samples of the cuttings were collected every three meters when possible. The holes penetrated sedimentscomposed predominately of clay, silts and sands. Detailed lithological information was not available inthe upper part of these boring logs.2.1.3 Sediment Characterization StudiesA number of studies have been recently completed to evaluate the chemical characteristics of the seafloorsediments. The most extensive of these included grab samples of the seafloor sediments throughout the <strong>Sea</strong>(Levine-Fricke, 1999). Particle size analyses were performed on the grab samples collected from the seafloor.That data indicate a preponderance of sand size particles covering the seafloor, contrasting with the primarilysilty sands and fine-grained sediments encountered in the current investigation. It was reported that theirsamples contained abundant barnacle shells and fish bones, and this may have biased the particle size analysesto the sand-size particles. The seafloor samples may have also had some sorting by currents.Another study focused on characterizing sediments around the perimeter of the <strong>Sea</strong> that may becomeexposed with lower <strong>Sea</strong> levels (Agrarian Research, 2003). This study indicated barnacle beds and sandysediments nearshore becoming finer grained with increasing water depth. The sandy and barnacle richshorelines are subject to high wave energies that sort the sediments.2.2 GEOTECHNICAL EXPLORATIONSThe field explorations associated with the preliminary geotechnical investigation consisted of drilling andsampling 11 offshore borings and performing 17 offshore CPTs. A summary of these explorations isprovided in Table 1 and below; details are provided in Appendices A and B.2.2.1 Equipment UtilizedA self-propelled jackup barge was mobilized from Louisiana to provide a stable working platform for thedrilling and CPT operations. The barge was approximately 18 feet wide and 45 feet long with a moonpool(opening for the drill string). The barge was jacked out of the water in depths less than about 40 feet,and anchored in deeper water. A large pontoon boat accompanied the jackup barge and provided storagefor equipment and supplies. Personnel were transported to and from the barge using either the pontoonboat or a speedboat. A photograph of the barge jacked out of the water is shown in Figure 3.The drilling was accomplished using a Mobile <strong>Sea</strong> 80-14 drill rig mounted on the jackup barge. A 4-inchdiameter conductor casing was installed between the deck of the barge and the seafloor. A 3.25-inch bitand N-size drill rod were used to advance the borings. The samples were obtained by pushing thin-walled(Shelby) 3-inch diameter tube samples, driving Standard Penetration Test (SPT) samplers, and using apunch core 134-mm (5.28-inch) coring system. A photograph of the drill rig is shown in Figure 3;photographs of the SPT samples and a punch core are shown in Figure 4.W:\27663042\00005-c-r.doc\1-Mar-04\SDG 2-2
SECTIONTWO<strong>Preliminary</strong> <strong>Geotechnical</strong> <strong>In</strong>vestigationA portable CPT system was used for the CPT soundings. The drill head on the drill rig was used to pushthe cone and casing was used to provide lateral support to the CPT rod string from the drill head to themud line. The soundings were conducted using a 20-ton capacity cone with a tip area of 15 squarecentimeters (2.3-inch 2 ) and a friction sleeve area of 225 square centimeters (34.9-inch 2 ). CPT datareduction and interpretation was provided in real-time on the barge deck. A photograph of the cone andthe CPT pushing operation is shown in Figure 5.The explorations were located using a Global Positioning System (GPS). The positions of theexplorations were located using the Latitude-Longitude decimal degree, North American Datum 1983(NAD 83) coordinate system. It is estimated that the accuracy of the horizontal locations of theexplorations is + 10-feet. <strong>Sea</strong>floor elevations were obtained by sounding the mudline with a weightedtape through the casing prior to drilling or CPT activities. The depth and elevation of the <strong>Sea</strong> bottom wasrecorded with respect to the <strong>Sea</strong> surface. The <strong>Sea</strong> surface was at approximately –227 feet MSL during theperiod of the field explorations.2.2.2 <strong>In</strong>-<strong>Sea</strong> BoringsEleven borings were drilled within the <strong>Sea</strong>. The locations of the borings are shown in Figure 2. Theborings were numbered to be consecutive with the CPTs. The borings were advanced to elevations ofbetween –274 and –407 feet MSL (30 to 149 feet below the seafloor). The borings were accomplishedusing rotary wash drilling techniques. Cuttings were flushed from the hole by circulation of a drillingfluid, which was then recirculated after the cuttings were removed in a settling basin.All of the borings were drilled under the direction of a certified engineering geologist. Samples of thesubsurface materials encountered in the borings were collected at approximately 5 to 10 foot intervals forfurther classification and laboratory testing. The samples were obtained using a Shelby tube sampler (inaccordance with ASTM D-1587) or a SPT sampler (in accordance with ASTM D-1586). The lowerportions of Boring 2 (the deepest boring) were also cored using a punch core 134-mm (5.28-inch) coringsystem.Additional details on the in-<strong>Sea</strong> borings are provided in Appendix A. A key to the log of the borings ispresented in Appendix A as Figure A-1, and logs of the borings are presented Figures A-2 through A-12.2.2.3 <strong>In</strong>-<strong>Sea</strong> Cone Penetration TestingSeventeen in-<strong>Sea</strong> CPT soundings where advanced to elevations between -270 and -332 feet MSL (32 to 67feet below the seafloor). The locations of the CPT soundings are shown in Figure 2. The CPT providedmeasurements of cone bearing (q c ), sleeve (f s ) and dynamic pore water pressure (u 2 ) at 2.5-centimeter (0.98-inch) intervals during penetration. All CPT soundings were performed in accordance with ASTM D-5778.Additional details of the CPT soundings are provided in Appendix B. A soil interpretation chart for theCPT data is provided in Figure B-1, and the CPT data are plotted in Figures B-2 through B-18.W:\27663042\00005-c-r.doc\1-Mar-04\SDG 2-3
SECTIONTWO<strong>Preliminary</strong> <strong>Geotechnical</strong> <strong>In</strong>vestigation2.3 LABORATORY TESTINGSamples of the subsurface materials obtained from the borings were returned to a geotechnical laboratoryfor testing. A summary of the laboratory testing performed is included in Table 2 and discussed below. Adetailed description of the testing program, and the results of the testing, are presented on the boring logsand in Appendix C. The following sections summarize the testing performed.2.3.1 <strong>In</strong>dex Testing<strong>In</strong>dex testing was performed on the samples to further characterize and classify the materials. The testingincluded water content (per ASTM D-4959), bulk densities, Atterberg limits (per ASTM D-4318), particle sizeanalyses (per ASTM D-422), percent passing the #200 sieve (per ASTM D-1140), pinhole dispersion analyses(per ASTM D-4647), and specific gravity tests (per ASTM D-854). A summary of the index testing isprovided in Table 3. Results of the index testing are presented on the boring logs and in Appendix C.Corrosivity testing was also performed on selected samples. A suite of tests including resistivity, electricconductivity and chemical analyses were performed. The results of these tests are presented in Table C-1in Appendix C.2.3.2 Strength TestingA preliminary evaluation of the shear strength of the soil samples was obtained during the field programby using a Torvane TM apparatus. Both Unconsolidated Undrained (UU) and Isotropically ConsolidatedUndrained (ICU) triaxial compression test were performed on selected samples. The UU samples wereconfined using a pressure similar to the existing overburden pressures at the sample depth. A set of threeICU tests were performed on three separate specimens extracted from the same or adjacent Shelby tubes;these specimens were consolidated at pressures ranging from near existing overburden to pressuresanticipated under embankment loads. The UU testing was performed in accordance with ASTM D-2850,the ICU testing was performed in accordance ASTM D-4767. A summary of the triaxial strength testingis provided in Tables 4 and 5; detailed results are provided in Appendix C.2.3.3 Consolidation TestingConsolidation tests were also performed on some of the samples. These consolidation tests wereperformed in accordance with ASTM D-2435. The results of the consolidation testing are summarized inTable 6. Detailed results from the consolidation tests are provided in Appendix C.W:\27663042\00005-c-r.doc\1-Mar-04\SDG 2-4
SECTIONTHREESite ConditionsSECTION 3SITE CONDITIONSKnowledge of the site conditions has been developed from a review of the area geology, the previousinvestigations within the <strong>Sea</strong>, the bathymetry and topography that was available, and the field andlaboratory programs undertaken for this preliminary geotechnical investigation.3.1 GEOLOGIC SETTINGThe <strong>Salton</strong> <strong>Sea</strong> currently occupies the lowest portion of the <strong>Salton</strong> Trough, a deep basin that representsthe structural extension of the Gulf of California into North America. The Trough is essentially a closedbasin, bounded by mountains within the Western Mojave Desert Province to the north, the Basin andRange Province to the east, and the Peninsular Range Batholith to the west. To the south, deltaic depositsof the Colorado River prevent marine inundation from the Gulf of California. A geologic map presentingthe surficial geology of the area surrounding the <strong>Sea</strong> is presented in Figure 6; a legend for the geologicmap is presented in Figure 7.3.1.1 StructureThe <strong>Salton</strong> Trough is a deep structural pull-apart basin characterized by high seismicity, high geothermalactivity, extensional tectonics, crustal thinning, and rapid sedimentation (Damiata et. al., 1986). The basinis bounded by major, northwest trending, strike slip faults and uplifted highlands of crystalline rock.Geophysical studies (Tarbet, 1951; Biehler et. al., 1964) suggest that upwards of 18,000 feet (3.4-miles)of sediment have accumulated in the <strong>Salton</strong> Trough since the Miocene epoch (Eberley and Standley,1978). The central portion of the valley is underlain by a 6 to 10-mile deep trough of sedimentary andmetasedimentary rocks (Fuis et. al., 1982).3.1.2 StratigraphyThe <strong>Salton</strong> Trough is a deep basin that has been filling with sediments since the Miocene epoch. Theoldest, basal sediments, are the coarse clastic materials of the Anza Formation that where shed off thesurrounding crystalline highlands. The Anza Formation outcrops at the surface along the margins of thebasin. Within the southern portion of the basin, the Anza Formation interfingers and is overlain by asequence of essentially continuous deposits including the Alverson volcanics, playa deposits of the FishCreek Gypsum, marine and non-marine sediments of the Split Mountain Formation, marine deposits ofthe Imperial Formation, terrestrial deposits of the Palm Springs Formation, the Canebrake Conglomerate,and the subsequent alluvial and terrace deposits of Quaternary age. The most recent deposits within thecentral portion of the Trough are dominated by lacustrine, deltaic, and fluvial deposition associated withHolocene and Pleistocene stands of ancient Lake Cahuilla.Around the margins of the <strong>Salton</strong> Trough basin, relict shoreline features mark the former high stands ofancient Lake Cahuilla. The ancient lake repeatedly filled and occupied the basin during the Holocene. Themost recent, pre-<strong>Salton</strong> <strong>Sea</strong> filling is thought to have occurred about 1,650 years ago (Norris and others,1979). The lake may have been in existence as recently a several hundred years ago (Morton, 1977). Sandand gravel deposits along the ancient shoreline have been locally mined for aggregate. Travertine depositsdelineate ancient lake levels above the west side of the <strong>Sea</strong>.W:\27663042\00005-c-r.doc\1-Mar-04\SDG 3-1
SECTIONTHREESite ConditionsThe <strong>Salton</strong> Trough has been repeatedly inundated by floodwaters of the Colorado River, with subsequentdrying to a playa desert surface. It is anticipated that some residual salt deposits may underlie the <strong>Sea</strong>. Areport from the State of California mineralogist in 1893 described the then-dry playa as having a thincrust underlain by up to 22 feet of “black ooze containing over 50 percent water, and consisting largely ofchlorides and carbonates of sodium and magnesium, the soda salts predominating, besides fine sand, ironoxide, and a small amount of organic matter.” Below the ooze was hard lacustrine clay.3.2 TECTONIC SETTINGThe origin of the <strong>Salton</strong> Trough has long been associated with the late Cenozoic extension that resulted inthe opening of the Gulf of California (Elders, 1972), which represents the northern extension of the EastPacific Rise spreading ridge system (Dibblee, 1954; Sharp, 1972). The extension on land occurs within afault-bounded pull-apart basin, similar to the spreading centers within the Gulf. The <strong>Salton</strong> Troughrepresents the transition zone between the crustal spreading centers in the Gulf and the right lateraltransform boundary between the North American and Pacific plates (Crowell and Sylvester, 1979;Crowell, 1981; Johnson et. al., 1982). Although the San Andreas fault zone is the primary element in thistransform boundary, the total plate motion is distributed across a broad zone of deformation thatessentially extends from the San Andreas fault to the offshore fault systems far to the west. The otherprimary structures in the right slip system of faults that compose the plate boundary are the San Jacinto,Imperial, Cerro Prieto, and Brawley fault zones. As a result of the active strike slip movements along themajor fault systems, vertical crustal movements are produced regionally within the <strong>Salton</strong> Trough.3.2.1 Fault ZonesThe primary seismic sources in the vicinity of the <strong>Sea</strong> are the right slip faults associated with thetransform plate boundary that include the San Andreas, San Jacinto and Elsinore fault systems. Within the<strong>Salton</strong> Trough, the Imperial, Brawley, and Cerro Prieto faults represent relatively short but active seismicelements of the San Andreas Fault system. More distant active faults include the San Miguel, and theCalabasas faults in northwestern Baja California, and the extensional faults of the Basin and Rangeprovince to the northeast. The locations of active faults (with displacement in the last 10,000 years) andother mapped faults in the vicinity of the <strong>Sea</strong> are shown in Figures 6 and 8.A number of faults have also been inferred based on a significant linear trend of recorded earthquakeepicenters in the vicinity (Jennings, 1994). These are generally aligned along strike slip faults havingQuaternary displacement, but not necessarily with historic surface rupture. These areas have been shownas green hatched areas on Figure 6.3.2.2 Historical SeismicityThe <strong>Salton</strong> Trough region is a very active tectonic region and as a result a high degree of seismicity is tobe expected. Historical earthquakes have been cataloged dating back to the mid-1800s based on feltreports from the San Diego, Yuma, and San Bernardino regions. Since that time many moderate (M4 toM6) and large (M6 to M7) earthquakes have occurred on faults in the <strong>Salton</strong> Trough. Although there havebeen no larger earthquakes (M>7) historically in the basin, the length of faults and rate of movementW:\27663042\00005-c-r.doc\1-Mar-04\SDG 3-2
SECTIONTHREESite Conditionsindicate that there is the potential for large earthquakes in the region. The epicenters of recorded since1932 earthquakes larger than M4 are shown in Figure 8.Since 1900, several large earthquakes have occurred on the Imperial, Cerro Prieto, and various segments of theSan Jacinto fault. Recent large earthquakes centered on faults in the <strong>Salton</strong> Trough are listed in Table 7.3.3 SURFACE AND SEAFLOORThe <strong>Sea</strong> is the largest inland body of water in California, with a current surface area of about 365 squaremiles. The area around the <strong>Sea</strong> is primarily in the Colorado Desert, with irrigated agricultural areas at thesouth and north ends of the <strong>Sea</strong>. A few residential communities are around the <strong>Sea</strong>.3.3.1 Surrounding TopographyThe <strong>Sea</strong> is located in the <strong>Salton</strong> Trough, a topographic low extending from the Gulf of Californianorthwest into southern California. The Santa Rosa Mountains to the west, the Orocopia Mountains to thenorth, and the Chocolate Mountains to the east surround the Trough. The bases of these mountains aretypically at elevations of 100 to 200 feet MSL to the west, and 200 to 300 feet MSL to the east. Shorelinefeatures associated with Holocone stands of ancient Lake Cahuilla generally aoccur at elevations between40 and 50 feet, MSL.The Whitewater River drains the Coachella Valley and enters the <strong>Sea</strong> at its north end. Salt Creek drainsthe southern slope of the Orocopia Mountains and the northern end of the Chocolate Mountains and entersthe northeast portion of the <strong>Sea</strong>. The San Felipe Creek is the largest drainage on the west and enters the<strong>Sea</strong> near its southwest corner. The New and Alamo Rivers drain the Imperial and Mexicali Valleys, enterthe <strong>Sea</strong> at its southern end, and provide the majority of the inflow to the <strong>Sea</strong>.The topography is very flat at the south and north ends of the <strong>Sea</strong>, with grades of 0.2 to 0.3 percent.Along the west side of the <strong>Sea</strong>, the topographic grades are 0.5 to 4.5 percent, and along the east side, thetopographic grades are 1.5 to 4.0 percent.3.3.2 BathymetryThe surface of the <strong>Sea</strong> was at elevation –195 feet MSL after flooding ceased in 1907. The <strong>Sea</strong> leveldropped to about elevation –250 feet MSL in the 1920s, and then steadily rose as additional lands wereirrigated in Imperial and Riverside Counties. The surface elevation of the <strong>Sea</strong> has been nearly constant atabout –227 feet MSL in the last few years.The bathymetry of the <strong>Sea</strong> is shown in Figure 2. The <strong>Sea</strong> actually includes two basins, separated by abathymetric high trending southwest to northeast near the middle of the <strong>Sea</strong>. The deepest part of thenorthern basin is an approximate elevation -276 feet MSL (a water depth of 49 feet) and the deepest partof the southern basin is elevation -275 feet MSL (a water depth of 48 feet). The seafloor slopes to thecenter of the basins generally at grades of 0.07 to 0.08 percent; steeper grades of 0.2 to 0.5 percent occurnear the west and east shorelines.W:\27663042\00005-c-r.doc\1-Mar-04\SDG 3-3
SECTIONTHREESite Conditions3.4 SUBBOTTOM CONDITIONSThe preliminary investigation identified six significant stratigraphic layers below the seafloor; a seafloordeposit, a soft lacustrine deposit, an upper alluvial deposit, an upper stiff lacustrine deposit, a loweralluvial deposit, and a lower stiff lacustrine deposit. Subbottom profiles depicting the layering of thesedeposits are shown in Figures 9 through 13; the locations of the sections are shown on Figure 2. Thelayering is also shown on Figures 14 and 15, which present CPT data and interpreted Soil Behavior Typesalong with the Unified Soil Classification System (USCS) soil descriptions and corresponding graphiclogs from the boreholes at locations where CPTs and boreholes were co-located. This comparisonindicates that rapid changes in tip resistance (q t ) are a good indication of stratigraphic changes and thelow friction ratios (R f ) are good indications of granular materials. These indicators were used to developstratigraphy at the CPT locations. The materials characterizations relied primarily on descriptions fromboring logs and laboratory tests, rather than SBT interpreted from the CPT data. The SBT generallyagreed with the borings on whether a material was fine-grained or not, but was not relied on as to whetherthe material was predominantly silt or clay. No attempt was made to make a site-specific correlationbetween SPT N-values and CPT tip resistance due to the low number of SPTs that were performed.Descriptions of these deposits are provided in the following sections. Photographs of samples of variousdeposits are shown in Figure C-1 through C-6 in Appendix C.3.4.1 <strong>Sea</strong>floor Deposits<strong>Sea</strong>floor deposits are generally encountered immediately below the seafloor mudline and are primarily theresult of Recent deposition. These unoxidized deposits vary from dark gray to gray, high plasticity (fat)clays to silty fine sands. The consistency is typically very soft to loose. Within our explorations, thethickness of the seafloor deposit ranged from 0 to 21½ feet, with the thickest deposits occurring in thesouthern basin of the <strong>Sea</strong> (in Boring 4), and in the easterly part of the mid-<strong>Sea</strong> alignment (in Borings 5,and 26 and CPTs 3 and 28).3.4.2 Soft Lacustrine DepositsSoft lacustrine deposits underlie the seafloor deposits across the majority of the sea. The unit is generallythickest within the central portion of the <strong>Sea</strong>. These oxidized deposits are composed of light brown todark brown, high plasticity clays. The materials range in consistency from very soft to stiff, but arepredominantly very soft to soft. Within the current explorations, the thickness of the soft lacustrinedeposits ranged from 0 to 26 feet, with the thickest deposits occurring in easterly part of the mid-<strong>Sea</strong>alignment (in CPT 3, CPT 27 and Boring 26) and the Whitewater River delta at the northern end of the<strong>Sea</strong> (in Boring 20).3.4.3 Upper Alluvial DepositsThe upper alluvial deposits interfinger between the soft lacustrine and upper stiff lacustrine deposits andare typically encountered near the perimeter of the <strong>Sea</strong>, thinning toward the central portion of the <strong>Sea</strong>.The unit is typically composed of brown to grayish brown silty fine sands with interbedded silt and sandlenses. The deposit ranges in consistency from loose to dense with localized zones of cementation (asW:\27663042\00005-c-r.doc\1-Mar-04\SDG 3-4
SECTIONTHREESite Conditionsindicated by CPT interpretations). Within the limits of the explorations, the unit ranged from 0 to 26½feet thick. The thickest deposits are encountered along the northeast (at CPT 25), southwest (in Boring 11and CPTs 10 and 12), and west-central (at CPTs 8, 9, Boring 7, and CPTs 21 and 23) margins of the <strong>Sea</strong>.3.4.4 Upper Stiff Lacustrine DepositsUpper stiff lacustrine deposits are encountered across the <strong>Sea</strong> and underlie both the soft lacustrine andupper alluvial deposits. The unit is typically composed of brown to grayish brown, highly plastic clayswith interbedded lenses of lean clay, silt, and silty sand. The deposit ranges in consistency from mediumstiff to hard, but is predominantly stiff to very stiff. The current explorations encountered this deposit inthickness ranging from about 4 to 31½ feet. The thickest deposits were encountered along the easternportion of the mid-<strong>Sea</strong> alignment (in Boring 2, and CPTs 27 and 28) and the southeastern portion of the<strong>Sea</strong> north of the Alamo River Delta (in Boring 17, and CPTs 15, 16, and 18).3.4.5 Lower Alluvial DepositsThe lower alluvial deposits underlie the upper lacustrine deposits. Similar to the upper alluvial unit, thedeposits are typically encountered near the perimeter of the <strong>Sea</strong>, thinning toward the central portion of the<strong>Sea</strong>. The unit is primarily composed of brown to olive gray, silty fine sand with interbedded lenses of siltand clay. The deposit ranges in consistency from medium dense to very dense. Within the limits of theexplorations, the thickness of the lower alluvial deposit ranged from 0 to 22 feet. The majority of thelower alluvial deposits were encountered within the southern portion of the <strong>Sea</strong>.3.4.6 Lower Stiff Lacustrine DepositsThe lower stiff lacustrine deposits are assumed to underlie the entire <strong>Sea</strong> at depth. The unit is similar incomposition to the upper stiff lacustrine deposit, consisting of dark grayish brown to dark gray, highlyplastic clay with interbedded zones and lenses of silt and silty sand. The deposit ranges in consistencyfrom very stiff to hard, but is primarily hard. Within the limits of the explorations, the unit ranges up to103 feet thick. The lower stiff lasuctrine deposits are anticipated to be much thicker as none of theexplorations fully penetrated this deposit.3.5 CURRENTS AND WAVESThe <strong>Sea</strong>’s currents have been studied by the University of California Davis (Cook, et.al., 1998). The currentsare primarily wind driven and the predominant wind direction throughout the year at the <strong>Sea</strong> is from northwestto southeast, with a more pronounced eastward component across the southern portion of the <strong>Sea</strong>. DuringOctober 1997, the winds and currents at the <strong>Sea</strong> were measured for the UC Davis study. The average windspeed was about 3.4 miles per hour in the northern end of the <strong>Sea</strong> and ranged to more than 7.8 miles per hourin the southern end of the <strong>Sea</strong>. Water current velocities were roughly one-tenth of the wind speeds.The north-south wind pattern results in a pattern of currents dominated by two large gyres, rotating inopposite directions in each of the two basins formed by the bathymetry. <strong>In</strong> the northern basin, the currentsrotate clockwise while in the southern basin the currents rotate counterclockwise. The speed of rotation istypically higher in the southern basin. The studies indicate that the current velocity pattern at the surfaceof the <strong>Sea</strong> is much the same near the bottom.W:\27663042\00005-c-r.doc\1-Mar-04\SDG 3-5
SECTIONTHREESite ConditionsVery little information is available on the wave regime in the <strong>Sea</strong>, which is also wind driven. It has beenreported that waves as high as 5 feet can build during strong wind storms.W:\27663042\00005-c-r.doc\1-Mar-04\SDG 3-6
SECTIONFOURPotential Geologic And Seismic HazardsSECTION 4POTENTIAL GEOLOGIC AND SEISMIC HAZARDSThis section provides a preliminary evaluation of the potential geologic and seismic hazards that couldimpact the restoration project. The primary hazards are fault rupture, strong ground shaking, soilliquefaction, and seiches. The following paragraphs qualitatively discuss these potential hazards,additional studies will be required to quantify and further define the potential hazards.4.1 FAULTING AND SEISMIC GROUND DEFORMATIONSAn active strand of the San Andreas Fault is mapped approximately 1.8 miles east of the east end of themid-<strong>Sea</strong> location. The nearest reach of the fault has been known to undergo longtime creep and triggeredslip following nearby large earthquakes (Agnew and Wyatt, 2003). The mapped alignment of the SanAndreas Fault is somewhat parallel to the long axis of the <strong>Sea</strong> and is projected to enter, or just skirt, thesoutheast corner of the <strong>Sea</strong> east of Bombay Beach. To the west and southwest, the active strands of theSan Jacinto and Elsinore faults trend sub-parallel to the San Andreas fault at respective distances of 13.4and 35.5 miles from the west end of the mid-<strong>Sea</strong> location. Surface delineations of historically activestrands of the Imperial and Brawley faults extend to within about 15 miles of the south end of the <strong>Sea</strong>.Two bands of seismicity suggest fault zones cross the southern end of the <strong>Sea</strong> (Figure 6), one trendingsouthwest to northeast and the other an apparent extension of the onshore mapped locations of either theSan Andreas or Imperial Faults. This north-northwest trending band of seismicity is known as theBrawley Seismic Zone.Surface rupture associated with earthquake faults is a potential hazard to the restoration project. Theresults of this preliminary investigation do not preclude the possibility that an active fault could crossproposed embankment locations. This potential fault rupture hazard should be further evaluated to assessthe possible presence and activity of the faults. A program to investigate this potential hazard is discussedin Section 7.2 of this report.Long term geodetic measurements indicate vertical crustal deformations along and near most of the activefaults in the area (Gilmore, 1986). Locally, the Lake Cahuilla shorelines show evidence of verticalwarping (Norris and others, 1979) and differences in elevation up to as much as 20 feet are indicated fromnortheast to southwest across the <strong>Sea</strong> (Grunsky, 1907). The geomorphic expression of the Durmid Hills(immediately east of mid-<strong>Sea</strong> location) suggests local topographic uplift along the San Andreas Fault. Therate of vertical uplift however, as indicated from the <strong>In</strong>dio Hills, suggests the vertical slip componentalong the San Andreas Fault is relatively low, and may be only about 3 percent of the horizontal slip rate(Norris and others, 1979). Potential seismic-induced ground deformations should be further evaluated.4.2 GROUND SHAKINGThe restoration project will likely be subjected to severe ground shaking in response to either a local ormore distant large magnitude earthquakes occurring during the life of the planned project. A ProbabilisticSeismic Hazard Analysis (PSHA) should be performed in future studies to estimate the recurrence andmagnitude of ground motions that could be expected at the <strong>Sea</strong>. This analysis is a mathematical processthat combines: (1) the probabilities of an earthquake of a particular magnitude occurring on a givensource; (2) the distance of the rupture surface to the site; and (3) the attenuation of the ground motions,W:\27663042\00005-c-r.doc\1-Mar-04\SDG 4-1
SECTIONFOURPotential Geologic And Seismic Hazardsconsidering the site conditions (Kulkarni et. al., 1979). The response will be unique to the site and willneed to account for near-fault directivity (Somerville et. al., 1997), soft soil effects (Idriss, 1990), andspatial incoherency, due to the size of the planned facilities.4.3 LIQUEFACTIONSeismically induced soil liquefaction is a phenomenon in which loose to medium dense, saturated,granular materials undergo matrix rearrangement, develop high pore water pressure, and lose shearstrength due to cyclic ground motions induced by earthquakes. This rearrangement and strength loss isfollowed by a reduction in bulk volume. Manifestations of soil liquefaction can include loss of bearingcapacity for foundations, surface settlements, and tilting in level ground. Soil liquefaction can also resultin instabilities and lateral spreading in embankments and areas of sloping ground.Evaluations of the potential for soil liquefaction are typically performed using empirical methods thatcorrelate in-situ evaluations of soil resistance (from either SPT or CPT data) with intensity of groundshaking. Rigorous analyses for the potential of soil liquefaction were not performed for this preliminaryinvestigation due to the paucity of granular deposits that were encountered. The majority of the sedimentsencountered in this investigation were high plasticity clays, which would have a low potential forliquefaction. However, extensive liquefaction of granular deposits in Imperial Valley during the 1979Imperial Valley earthquake is well documented (Youd and Bennett, 1983). Given the highly seismic area,it is likely that Recent granular deposits below the <strong>Sea</strong> would have a high liquefaction potential.Furthermore, uncompacted embankment fills placed below the <strong>Sea</strong> level would also have a high potential toliquefy. Further studies on restoration alternatives incorporating uncompacted embankments should evaluaterequirements to mitigate the effects of liquefaction of embankment materials. Alternative locations forembankments should also evaluate the presence of potentially liquefiable granular soils in the foundation.4.4 SEICHESSeiches are produced when seismic ground shaking causes massive wave oscillations of an enclosedwater body that continue after the originating force has vanished. The frequency of the oscillations is thesame as the natural frequency of the water body. Seiches can also be formed when faulting causespermanent vertical displacement beneath a body of water.There are no documented occurrences of seiches at the <strong>Salton</strong> <strong>Sea</strong>. However, given the shallowness andseismic exposure of the <strong>Sea</strong>, it is likely that one could occur. The wave that could be generated by aseiche should be estimated in future studies. However, it is possible that the height of wind driven waves,rather than seiches, would dictate the freeboard that would be required for in-<strong>Sea</strong> embankments.W:\27663042\00005-c-r.doc\1-Mar-04\SDG 4-2
SECTIONFIVE<strong>Preliminary</strong> Engineering CharacterizationSECTION 5PRELIMINARY ENGINEERING CHARACTERIZATIONThis section provides a preliminary characterization of the engineering properties associated with thestratigraphy that was identified and discussed in Section 3.4. This characterization can be used in formulatingconceptual designs for the restoration project. However, it should be recognized that the characterization isbased on limited data and will need to be refined as the restoration concepts are further developed.The sections below describe the three main engineering properties measured: index, strength andcompressibility, followed by a discussion of test results specific to each unit. Table 8 provides aninterpreted characterization that is recommended for use in further development of conceptual designs.5.1 ENGINEERING PROPERTIES5.1.1 <strong>In</strong>dex Properties<strong>In</strong>dex properties of the samples include total and dry unit weight, natural water content, Atterberg limits,particle size distribution, pinhole dispersion, and specific gravity. A summary of these test results for eachof the stratigraphic units is provided in Table 3. The test results in the stiff lacustrine deposits (upper andlower) and the alluvial deposits (upper and lower) were similar and are combined in the database shownin Table 3. The table lists the number of each test performed as well as the high, low, average, and medianof the test results. Summaries of water contents versus depth are presented in Figures 16 through 19,grouped by areas of the <strong>Sea</strong>. A summary of all of the plasticity indices is shown in Figure 20.The predominant Unified Soil Classification System (USCS) group symbol for a particular deposit isshown bolded in Table 3, along with the percentage of the other classifications for the samples tested.This distribution is a good indicator of the variability of the deposit.The samples obtained were typically saturated and the water content (based on dry weight) is generally agood indicator of the soil’s strength and compressibility, i.e. higher moisture contents (andcorrespondingly lower dry unit weights) usually indicate lower strengths and higher compressibilities.Particle size distribution and Atterberg limits tests allow a particular soil to be categorized into differentgroups: clay and silt (fine-grained materials) or sand and gravel (coarse-grained materials). Atterberg limitsalso provide qualitative indications of the particle size; soils that are above the Atterberg limit “A” Line areclay, and those below are silt. <strong>In</strong> addition, soils are considered fine grained if they possess 50% or more silt andclay. Other soils are considered to behave as fine-grained soils if they possess 30% or more clay fraction. TheAtterberg limits also indicate whether the fine-grained soil is of high or low plasticity.Pinhole dispersion tests provide an indication of the erodibility of a particular soil. Dispersive soils differfrom ordinary, erosion resistant soils, because they have a higher relative content of dissolved sodium inthe pore water. Dispersive clays erode as individual colloidal clay particles go into suspension in stillwater, whereas considerable velocity in the eroding water is required to erode normal clays. This isparticularly relevant in evaluating the potential use of materials in water retention embankments. Thepinhole dispersion tests are summarized in Table C-2.W:\27663042\00005-c-r.doc\1-Mar-04\SDG 5-1
SECTIONFIVE<strong>Preliminary</strong> Engineering Characterization<strong>In</strong>-situ properties of the deposits include relative density (loose to very dense) for coarse-grainedmaterials and consistency (very soft to hard) for fine-grained materials. Field tests, such as SPT, CPT, orTorvane TM tests, and manual penetration (“thumbnail test”) of samples, were the main methods ofinterpretation of density or consistency.Physical properties were also interpreted using the SBT classification developed by Robertson (1990) foruse with CPT data. This study considered the relationship between cone tip resistance and friction ratio.5.1.2 StrengthsThe strength testing was concentrated in the soft seafloor and lacustrine deposits; the strength of thesedeposits will be a controlling factor in the stability of embankments constructed within the <strong>Sea</strong>. <strong>In</strong>normally to lightly overconsolidated cohesive soils, such as the seafloor and soft lacustrine deposits, theundrained shear strength (c u ) is used to evaluate the short-term stability of embankments. The undrainedstrength is used to simulate that the soils may be loaded rapidly enough (with an embankment) that theinduced pore pressures do not dissipate enough for significant strength gain in the foundation soils. Fornormally consolidated soils, the c u is often directly proportional to the effective overburden pressure (σ v ’),the ratio c u /σ v ’ is typically 0.2 to 0.4 for normally or lightly overconsolidated clays.The c u has been assessed for this investigation using the following techniques:• Torvane TM tests on thin walled samples.• Unconsolidated Undrained (UU) triaxial compression test results.• Isotropically Consolidated Undrained (ICU) triaxial compression test results.A plot of the Torvane TM shear strength test data versus depth is shown in Figure 21. These results aregenerally much higher than what was indicated by the sample’s consistency, and the results of the UU andICU tests. A summary of the UU test results is presented in Table 4. A plot of c u versus the σ v ’ at the UUsample depth (or the confining pressure for ICU results) is presented in Figure 22 for the soft deposits.Effective stress shear strength parameters, c' (cohesion) and φ' (friction angle), are used to evaluate longterm stability conditions. ICU (with pore pressure measurements) triaxial compression tests wereperformed on the cohesive soils to evaluate these parameters. A summary of these test results is providedin Table 5. <strong>Preliminary</strong> values for the effective stress shear strength parameters for use in conceptualdesigns were interpreted from these results, and published correlations with other material properties.5.1.3 CompressibilityThe compressibility of the subbottom deposits will be a factor in maintaining sufficient freeboard on in-<strong>Sea</strong> embankments, and in estimating ultimate quantities of materials for embankment construction. Theconsolidation testing was also concentrated in the soft seafloor and lacustrine deposits as the largestmagnitudes of settlement will likely come from these deposits. A summary of the compressibilityparameters obtained from the consolidation testing is provided in Table 6.W:\27663042\00005-c-r.doc\1-Mar-04\SDG 5-2
SECTIONFIVE<strong>Preliminary</strong> Engineering CharacterizationThe compressibility characteristics of fine-grained materials have been interpreted from laboratoryoedometer testing and published correlations to index properties. Correlations to index properties wereused to interpret potential variability, considering the limited number of oedometer tests performed withineach deposit compared to the more numerous index testing. For example, the Liquidity <strong>In</strong>dex (LI)provides qualitative assessments of the compressibility of fine-grained soils.LI is defined as:LI = (w-PL)/PIWhere: w = water contentPL = plastic limitPI = plasticity indexA LI less than or equal to zero may indicate a heavily overconsolidated soil. A LI equal to 1.0 may indicaterelatively weak and compressible materials. A LI greater than 1.0 may indicate that the material is sensitive.Soils with a LI greater than approximately 0.7 may experience significant consolidation settlements.The parameters used to characterize compressibility are the Compression <strong>In</strong>dex (C c ), Recompression<strong>In</strong>dex (C r ), Overconsolidation Ratio (OCR or σ p ’ /σ v ’ ) and/or Preconsolidation Pressure (σ p ’), Coefficientof Secondary Compression (C α ) and the Coefficient Consolidation (c v ).The C c was interpreted as the slope of the oedometer test data in the range of the anticipated stresschanges, as shown below:C c = ∆e / ∆ log σ v 'Where: ∆e = change in void ratio∆σ v ’ = change in effective vertical overburden stressThe C r has been interpreted from the reloading portion of the laboratory oedometer testing, or taken to bethe commonly adopted values of ten to twenty percent of C c .The Overconsolidation Ratio (OCR) and Preconsolidation Pressure (σ p ’) were estimated by inspection ofthe strain – log σ’ oedometer test data and various published correlations to index parameters.The Compression Ratio (CR) is related to C c as follows:CR = C c / (1 + e 0 )Where: e 0 = initial void ratioThe CR is also commonly related to natural water content; a plot of published correlations with test datafrom this investigation is shown in Figure 23.Conceptual design parameters for secondary compression have not been developed for this study. Themagnitude of secondary compression should provide a relatively small contribution to overall settlement,or be part of a long-term maintenance burden, depending on the design life adopted.W:\27663042\00005-c-r.doc\1-Mar-04\SDG 5-3
SECTIONFIVE<strong>Preliminary</strong> Engineering CharacterizationThe time over which settlement could occur is calculated using c v , which is a function of soil permeabilityand therefore the choice of this parameter can vary considerably. For this study, the parameter wasinterpreted from oedometer tests and published correlations to liquid limit.5.2 SEAFLOOR DEPOSITS5.2.1 <strong>In</strong>dex PropertiesThis unit consists predominantly of fine-grained materials. Most of the soils were classified as fat clay(Unified Soil Classification of CH). However, the average fines content (silt and clay) variedconsiderably (14 to 100 percent) and averaged about 64 percent, with the remaining fraction comprisingfine sand. The plasticity of this unit is high based on an average Plasticity <strong>In</strong>dex (PI) of 48%. The averagewater content (63%) is nearer to the average Liquid Limit (LL) of 77% relative to the average PlasticLimit (PL, 30%). Table 3 summarizes the index test data.The consistency of fine-grained materials ranged from firm to stiff at shallow water locations andpredominately soft and locally firm at deep-water locations (mid-<strong>Sea</strong> locations only). Where coarsegrainedmaterials exist, the relative density ranged from loose to medium dense.The SBT interpretations show similar variability between coarse- and fine-grained materials. SBT mostlyranged from clay to sand and silt mixtures as shown on the CPT plots in Appendix B (mid-<strong>Sea</strong> locationsonly). More variability was evident at shallow water locations.5.2.2 StrengthThe c u of this unit ranges from about 75 to 200 pounds per square foot (psf) considering six UU triaxialcompression test results and discounting one anomalous test of 800 psf. The undrained shear strengthdeveloped from four ICU triaxial compression test points (Mohr Circles) tested at a confining pressureapproximately equal to effective overburden pressure ranged from 300 to 660 psf. The ICU dataproduced higher undrained shear strengths, when comparing the two data sets (UU and ICU).Data from Torvane TM tests were only considered qualitatively, which shows a marked increase inundrained shear strength at shallow water locations.Undrained shear strength for normally consolidated soils is often presented as the ratio of undrained shearstrength to effective overburden stress (σ v ’) for slope stability and other forms of geotechnical analyses.A c u /σ v ’ ratio of 0.35 was interpreted from the data for conceptual design. This assessment considers adesign line interpreted from a scatter plot of undrained shear strength versus effective stress (refer toFigure 22) and published correlations to index parameters (also shown on Figure 22).Data from the ICU triaxial compression tests and reference to published correlations to index tests wereused to estimate peak and ultimate effective cohesion (c') and friction angle (φ'). A cohesion of zero psfand friction angle of 27 and 25 degrees for peak and ultimate conditions respectively were interpretedfrom the data. The ultimate condition is defined as the point where continuous shear defomation continueswith no further changes in volume. To interpret these parameters, Mohr circle plots of shear stress versusW:\27663042\00005-c-r.doc\1-Mar-04\SDG 5-4
SECTIONFIVE<strong>Preliminary</strong> Engineering Characterizationeffective stress were developed at individual sample locations and for all the samples within the unit,excluding anomalous points. Figures in Appendix C of this report provide the test results.5.2.3 CompressibilityThis unit is interpreted to be slightly overconsolidated with an OCR of 1.5 recommended for conceptualdesign. A graphical interpretation of the preconsolidation pressure (σ p ) using the strain versus the log ofvertical effective stress (σ v ’) test data was the primary method of interpretation. However, engineeringjudgment considering the varied geologic environment of the surface of the <strong>Sea</strong> bottom along withundrained shear strength versus depth profiles were also considered to develop this assessment.Assessment of OCR based on the water content relative to the Liquid and Plastic Limit, could suggest adifferent interpretation for this unit and the other fine-grained soil units. However, for conceptual designpurposes, we recommend adopting normally consolidated to slightly overconsolidated conditions.A C C of 0.65 and C r of 0.10 are recommended for conceptual design. The C c data from six tests rangedfrom 0.23 to 1.10. One sample swelled and therefore it was discounted from further interpretation. Theseparameters were developed from graphical interpretations of the strain versus log of effective stress (σ v ’)plots and inspection of this data relative to a plot of CR correlated to water content (refer to Figure 23).The Compression <strong>In</strong>dex was also related to the commonly used expression C C = 0.009 (LL-10). Therecommended C r was taken as 15 percent of the C C . Table 6 summarizes the consolidation test data.A complete discussion of potential consolidation settlement is presented elsewhere in this report.However, an average LI of 0.81 suggests a potential for significant consolidation settlement.A coefficient of consolidation (c v ) of 15 feet squared per year (ft 2 /yr) is recommended for conceptualdesign. However, considering the variability of this parameter, conceptual design analyses shouldconsider using a range from 10 to 40 ft 2 /yr. This parameter was developed using the relevant portions ofthe oedometer test data and correlation to the LL. The lab data ranged from 8 to 43 ft 2 /yr. Correlations toLiquid Limit ranged from 12 to 40 ft 2 /yr.5.3 SOFT LACUSTRINE DEPOSITS5.3.1 <strong>In</strong>dex PropertiesSamples tested from this unit consist of fine-grained materials classified predominantly as fat clay (CH).The plasticity of these materials is high based on the average PI of 40%. The average water content (43%)is nearer to the average PL (26%) relative to an average LL of 66%. Table 3 summarizes the index testdata. The consistency was generally stiff for shallow water locations and soft to firm for deep-waterlocations (mid-<strong>Sea</strong> locations only).The SBT ranged from sand and silt mixtures to clay and silt mixtures. Shallow water location appeared toexhibit a tendency towards more coarse-grained SBT interpretations as shown on the CPT plots inAppendix B (mid-<strong>Sea</strong> locations only).W:\27663042\00005-c-r.doc\1-Mar-04\SDG 5-5
SECTIONFIVE<strong>Preliminary</strong> Engineering Characterization5.3.2 StrengthThe undrained shear strength of this unit ranges from about 350 to 1,100 psf considering six UU triaxialcompression test results. The undrained shear strength developed from two ICU triaxial compression testpoints (Mohr Circles) tested at a confining pressure approximately equal to effective overburden stressranged from 600 to 700 psf. Data from Torvane TM tests show a marked increase in undrained shearstrength at shallow water locations.For conceptual design purposes, a c u /σ v ’ ratio of 0.35 was interpreted from inspection of a scatter plot ofundrained shear strength versus effective overburden stress (refer to Figure 22) and published correlationsto index parameters (also shown on Figure 22). A cohesion of zero psf and friction angle of 25 and 23degrees for peak and ultimate conditions respectively was interpreted from the data using Mohr circleplots of shear stress verses effective stress and correlations of angle of friction to index tests. Figures inAppendix C provide the test results.5.3.3 CompressibilityThis unit is interpreted to be normally consolidated considering graphical interpretations of thepreconsolidation pressure (σ p ’) and engineering judgment. A C C of 0.35 and C r of 0.05 are recommendedfor conceptual design. The C c data from five tests ranged from 0.14 to 0.61, while data correlated to indextests range from 0.20 to 0.54. Figure 23 shows the parameters interpreted from oedometer tests relative toa plot of CR correlated to water content. An average LI of 0.6 with a median of 0.4 suggests a moderate tohigh potential for consolidation settlement.A c v of 20 feet squared per year (ft 2 /yr) with a range of 10 to 40 ft 2 /yr is recommended for conceptualdesign. The data ranged from 9 to 39 ft 2 /yr discounting one anomalously high data point; correlationsranged from 15 to 25 ft 2 /yr.5.4 STIFF LACUSTRINE DEPOSITSThe test results on samples from the upper and lower stiff lacustrine units were similar, and were combined forengineering characterization purposes. <strong>In</strong> addition, the strength and compressibility properties of this unitshould not significantly influence conceptual design analyses for embankment stability and consolidationsettlement. Therefore, fewer laboratory tests were assigned for strength and compressibility assessments andthe interpretations were not developed as thoroughly as for the overlying units.5.4.1 <strong>In</strong>dex PropertiesThe stiff lacustrine deposits generally consist of fine-grained materials classified predominately as fatclay (CH), but with more heterogeneity than the upper deposits. The plasticity of these materials ismoderate to high based on the median PI of 34%. The average water content (32%) is nearer to theaverage PL (21%) relative to the average LL (55%). The consistency was generally stiff for shallow waterlocations and firm to stiff for deep-water locations (mid-<strong>Sea</strong> locations only).W:\27663042\00005-c-r.doc\1-Mar-04\SDG 5-6
SECTIONFIVE<strong>Preliminary</strong> Engineering CharacterizationThe SBT ranged from clays to sand and silt mixtures. Shallow water location appeared to exhibit atendency towards more coarse-grained SBT interpretations as shown on the CPT plots in Appendix B(mid. <strong>Sea</strong> locations only).5.4.2 StrengthsThe undrained shear strength of these units range from about 600 to 4,300 psf considering twenty UUtriaxial compression test results and discounting three anomalously low results from an upper stiff unitthat were less than 500 psf. A ratio of undrained shear strength to effective overburden stress was notdeveloped, however the average undrained shear strength, excluding three anomalous data, is about 2,000psf. Data from Torvane TM tests show a marked increase in undrained shear strength at shallow waterlocations.ICU triaxial compression tests, which are used to estimate peak effective cohesion and angle of frictionwere not completed on this unit. However, considering correlations to index tests, the friction angle couldbe about 25 degrees.5.4.3 CompressibilityThis unit is interpreted to be overconsolidated considering graphical interpretations of thepreconsolidation pressure (σ p ’) and engineering judgment. A C C of 0.14 and C r of 0.02 are recommendedfor conceptual design. The c c data from three tests ranged from 0.13 to 0.26. A median LI of 0.2 suggestsa potential for low consolidation settlement. The c v ranged from 14 to 18 ft 2 /yr, discounting an anomalousresult.5.5 ALLUVIAL DEPOSITSThe test results on samples from the upper and lower alluvial deposits were similar, and were combinedfor engineering characterization purposes.5.5.1 Material PropertiesThese units consist predominately of coarse-grained materials that comprise silty sand (SM) and poorlygraded sand-silt mixture (SP-SM) with an average of 43% fines content. About one-fifth of thesematerials were classified as inelastic silt (ML) to low plasticity clay (CL). The relative density rangedfrom medium dense to dense.The SBT, where this unit was interpreted to be was mostly correlated as sands as shown on the CPT plotsin Appendix C and Table 3 (mid-<strong>Sea</strong> locations only).5.5.2 StrengthThe undrained shear strength ranged from about 900 to 5,150 psf considering the three UU triaxialcompression test results completed on samples obtained within these units. ICU triaxial compressiontests were not completed on these samples, however a friction angle would be about 30 degrees,considering physical characteristics.W:\27663042\00005-c-r.doc\1-Mar-04\SDG 5-7
SECTIONFIVE<strong>Preliminary</strong> Engineering Characterization5.5.3 CompressibilityA C C of 0.10 and C r of 0.02 have been interpreted using the data from one consolidation test plot.5.6 OTHER ENGINEERING PROPERTIES5.6.1 CorrosivityThe results of five suites of corrosity tests (resistivity, pH, electrical conductivity, cation and anions) onsamples obtained at depths ranging form 6 to 16 feet below the mudline indicates that these material arevery corrosive to buried metal structures with severe potential for sulfate attack on concrete and a severepotential for chloride attack. Table C-1 provides the test results.5.6.2 Pinhole DispersionThe results of seven pinhole dispersion tests on samples obtained at depths ranging from 1 to 25 feetbelow the mudline indicate the materials possess “moderate to slight” dispersion characteristic asestablished by ASTM D4647, Method C. The results of one sample at 25 feet below the mudline was“nondispersive”. Table C-2 provides the test results.W:\27663042\00005-c-r.doc\1-Mar-04\SDG 5-8
SECTIONSIX<strong>Preliminary</strong> Embankment Design ConsiderationsSECTION 6PRELIMINARY EMBANKMENT DESIGNCONSIDERATIONSThis section provides preliminary considerations for the design of embankments that may be incorporatedinto the restoration project. It provides a preliminary evaluation of the requirements to obtain a stableembankment, alternatives that could be used to prepare the foundation of the embankment, potentialground improvement techniques for both embankment and foundation soils, an estimate of postconstruction settlement magnitudes and rates, and potential in-<strong>Sea</strong> borrow sources.6.1 EMBANKMENT STABILITYA critical element of the embankment design will be the stability of the embankment slopes both duringconstruction and during an earthquake. The current concepts generally incorporate embankment slopesthat are at inclinations of 2½:1 (horizontal:vertical) or flatter, with seafloor deposits that had beenoverexcavated to a depth of 25 feet and replaced with suitable materials. The slope inclinations wereselected based on engineering judgment; no specific slope stability analyses were performed. The depthof overexcavation was selected based only on the data that was available at the time, the 1974 Bureau ofReclamation investigation that was only in the southern end of the <strong>Sea</strong>, and on construction experience ofthe Great Salt Lake railroad causeway in the 1950s.The results of the preliminary geotechnical investigation indicate that the soft/weak soils may extenddeeper than 25 feet in the central and easterly portion of the mid-<strong>Sea</strong> alignment. Greater depths ofoverexcavation and replacement below planned embankments would greatly increase the cost of thoseembankments. Alternatively, the embankments could be constructed with flatter inclinations that wouldbe stable. The embankment construction may also need to be staged to allow pore pressures induced bythe embankment fills in the fine-grained foundation soils to dissipate, and allow the strengths to increasein the foundation soils.Static slope stability analyses have been performed using the undrained strength test results from thisinvestigation. These tests indicate that the c u /σ v ’ ratio for the seafloor and soft lacustrine deposits is about0.3 to 0.4. Limited parametric analyses were performed by varying the inclination of the embankmentslopes and the depths of foundation soil overexcavation. The results of these analyses are presented inTable 9. Graphical results of the stability analyses are contained in Appendix D. The results of theseanalyses indicate that an embankment with a crest elevation of -225 feet MSL and 2½:1 slopes wouldgenerally require 35 feet of overexcavation to be statically stable. These simplified analyses assumed apotential failure in the foundation soils and generally loose to medium dense granular embankmentmaterials (with a friction angle of 30 degrees); some sort of rock shell would need to be incorporated intothe design for 2½:1 embankment slopes to be stable. Embankments with 6:1 slopes would generally bestatically stable with about 10 feet of overexcavation, and embankments with 10:1 slopes could staticallybe stable if placed directly on the seafloor. Less overexcavation would be required for embankments withcrest elevations of -240 feet MSL, a case that was analyzed for a lower <strong>Sea</strong> level.The static analyses assume that neither the foundation or embankment soils lose strength during anearthquake. These soils could lose strength if they were to liquefy, or have strain-softening behavior thatcould be exhibited in sensitive clays. It is anticipated that the majority of the foundation soils will be fine-W:\27663042\00005-c-r.doc\1-Mar-04\SDG 6-1
SECTIONSIX<strong>Preliminary</strong> Embankment Design Considerationsgrained and not susceptible to liquefaction. The results of the laboratory testing indicate that the seafloorand soft lacustrine deposits should not be susceptible to significant strength loss based on publishedempirical criteria (Seed, et al, 2001). However, uncompacted embankment fills would be susceptible toliquefaction. Dynamic response analyses (as discussed in Section 7.4) should be performed to evaluate theseismic response of the embankments and the need for ground improvement (as discussed in Section 6.3).Alternatively, consideration should be given to utilizing materials that would not loose strength during anearthquake; e.g. large blasted rock.6.2 FOUNDATION PREPARATIONIt had been assumed that 25 feet of soft (weak) foundation materials would need to be removed andreplaced in the conceptual designs for the dams and barriers in the current restoration alternatives. Theresults of this preliminary geotechnical investigation indicate that soft soils extend to depths of 40 to 45feet in some parts of the <strong>Sea</strong>. Alternatives to the complete overexcavation and replacement of the weaksoils may be more cost-effective. These alternatives could include building the embankments with flatterside slopes with minimal overexcavation (as discussed in Section 6.1) or using ground improvement (asdiscussed in Section 6.3) to strengthen the foundation soils. These alternative schemes should be furtherevaluated as the current concepts are revised, or new concepts are developed.6.3 GROUND IMPROVEMENTGround improvement techniques could be used to either strengthen the foundation soils or densifyuncompacted embankment soils. A variety of innovative ground improvement methods have beendeveloped and verified over the years, several of which would be applicable for the foundation soils andproposed embankments.The primary problem with the foundation soils is the low strengths of the soft fine-grained seafloor andlacustrine deposits. Steeper embankment slopes could be utilized if these soils were to be strengthened.“Stone columns” could be used to increase the shear strength of the foundation soils; they would alsoaccelerate the consolidation of the soils by allowing radial drainage of the pore water to the columns.Stone columns consist of a dense column of gravel that is typically installed using a casing that is vibratedor driven into the foundation soils. The stone columns are typically 2 to 3 feet in diameter, and are spacedat 5 to 10 feet center-to-center.Grouting and mixing techniques could also be used to strengthen the foundation soils. Groutingtechniques involve the injection of cementitious materials into the voids of the soil such that the particlestructure of the majority of the soil remains intact. Grouting would probably have limited applicability forthis project due to the predominantly fine-grained nature of the foundation soils. Mixing techniqueswould introduce the cementitious materials by physically mixing (either mechanically or hydraulically)them with the soil, completely disturbing the particle structure of the soil. Deep soil mixing and jetgrouting are mixing techniques that would be applicable to the majority of the foundation soils.Ground improvement may be required to compact embankment fills that are placed below <strong>Sea</strong> level andare uncompacted. This may be required to both maintain static stability, as well as to mitigate potentialliquefaction of the fills. A number of methods have been developed to densify fill soils by vibration.W:\27663042\00005-c-r.doc\1-Mar-04\SDG 6-2
SECTIONSIX<strong>Preliminary</strong> Embankment Design Considerations"Vibro-compaction" consists of inserting a large vibratory probe into the soil. The “vibro-wing" methodconsists of drilling a metal rod with a number of metal wings affixed to it into the soils with a vibratoryhammer. These techniques have been found to work well on silty sands and clean sands. "Vibroreplacement"is a modification of vibro-compaction in which granular columns (stone columns) are usedto backfill the hole created by the vibratory probe. As discussed above, this method can also be used onfiner-grained material as it provides reinforcement to the soil and drainage for excess pore waterpressures. Vibro-replacement will most likely be required in areas that have high silt and clay contents(greater than about 15 percent fines). The spacing of these techniques is typically 5 to 10 feet.Large diameter (mammoth) sand compaction piling has been used on major overwater developmentsoverseas; particularly to stabilize very soft clays found in north- and south-east Asia. A significant projectsuch as the <strong>Salton</strong> <strong>Sea</strong> Restoration could generate interest from international contractors, where thistechnology has a wide-ranging experience base. Overwater mammoth compaction piles are typically 4 to6 ½ feet in diameter. Two to four piles are driven simultaneously from a large barge.Evaluation of the need and cost-effectiveness of these ground improvement techniques should beundertaken during the revision or development of alternative restoration schemes.6.4 POST-CONSTRUCTION SETTLEMENTS<strong>In</strong>-<strong>Sea</strong> embankments will need to be designed with some freeboard to prevent overtopping by wind- orseismically-driven waves (seiches). The design of in-<strong>Sea</strong> embankments will also need to recognize thepotential for long-term settlement of the embankment due to consolidation of the underlying silts andclays. Excess pore pressures will be generated in these soils when the load of the embankment fills isplaced. Surface settlements will occur as these pore pressures dissipate and the soils consolidate. <strong>In</strong> theclayier materials, this dissipation may take years, and the post-construction settlements may be severalfeet in magnitude. The designs could accommodate these post-construction settlements by initiallyoverbuilding the embankment such that the freeboard is maintained when the consolidation settlementsare complete, or by periodically raising the embankment as the settlements occur.<strong>Preliminary</strong> analyses were performed to evaluate the potential magnitude of consolidation settlements.The results of these analyses are presented in Table 10. These preliminary analyses only considered theprimary consolidation settlements from the seafloor and soft lacustrine deposits. It is anticipated that mostof the consolidation settlements will occur in these deposits due to the large increase in effective stress(relative to existing overburden pressures) and their high compressibilities. These analyses indicate that 4to 6 feet of settlement could occur for an embankment crest at elevation -225 feet MSL, where the softmaterials were deep along the mid-<strong>Sea</strong> alignment (the stratigraphy at CPTs 3 and 29 were used for theanalyses). Four to five feet of settlement are estimated for an embankment crest at elevation -240 feetMSL. These magnitudes would occur beneath the crest of the embankment, less settlement would occurbeneath the slopes of the embankment. It is estimated that the average settlement across the bottom of anembankment (with side slopes at 6:1 and a crest width of 30 feet) would be about 60 to 65 percent of themagnitude at the crest cited above. This value could be used to estimate embankment quantities.As discussed in Section 5.1.3, the rate of consolidation settlements is estimated using an estimated c V ,which typically exhibits large variabilities in laboratory testing. Large earthwork projects oftenincorporate test fills to better estimate settlement magnitudes and rates. Therefore, parametric analysesW:\27663042\00005-c-r.doc\1-Mar-04\SDG 6-3
SECTIONSIX<strong>Preliminary</strong> Embankment Design Considerationswere performed to evaluate probable settlement rates. Since the rate becomes asymptotic with time, it isstandard practice to evaluate the time for 90% of the consolidation to be complete. <strong>In</strong> addition to c V , theother variable is the drainage path for the expelled pore water to travel. The drainage path is equal to onehalfthe deposit’s thickness if the deposit has double drainage (i.e. it is overlain and underlain by quicklydrained deposits), or equal to the deposit thickness if there is only one-way drainage. <strong>In</strong> the middle of the<strong>Sea</strong>, the alluvial layers did not appear to be continuous and the layers may only have one-way drainage.The results of the parametric analyses for the settlement rates is shown in Table 11. These analysesindicate settlement would be complete within a couple of years for the thinner deposits, but may continuefor up to 30 years for the thickest deposits.6.5 IN-SEA BORROW SOURCESOne objective of the preliminary geotechnical investigation was to evaluate the potential for borrowingmaterials from within the <strong>Sea</strong> to construct embankments. These materials could be economically dredgedand transported using marine dredging methods. The dredging equipment could be either with clamshelldredges with the materials transported by dump barges, or by a cutter suction dredge with the materialstransported as hydraulic slurry to the embankment. The performance of dredged fills during and afterconstruction relates directly to the nature of the borrow materials. The amount and rate of settlement ofthe embankment fill under its own weight, its ability to support structural loads, and appropriatetechniques for soil improvement are primarily controlled by the nature of the borrow materials. Ofparticular interest are gradation, the amount of fines (silts and clays), and the plasticity of the materials.Dredged fills consisting of material with high clay and silt content are characterized by high watercontent, low density, high compressibility, and low strength. Trafficability of the embankment surfacewill be very poor for these materials. As the soils consolidate with time and excess water drains off,settlement of the embankment surface will occur. Settlement may be several feet in magnitude and couldoccur over a period of several years. Because of these unsatisfactory initial conditions, artificialimprovement of most fine-grained dredged fill soils is required either during or after placement tomitigate and/or accelerate settlements.On the other hand, dredge fills consisting of granular (sandy) materials settle quickly, but are expected tobe characterized by low relative density and high liquefaction potential. Overall, the embankmentconstruction would best be facilitated by using materials that are relatively free of silt and clay andcomposed predominantly of clean sand or gravel (less than 15 percent fines). Some form of groundimprovement may still be required to address the liquefaction issue, but there should be early access forconstruction activity and reduced post-construction settlement problems associated with sand fills.The majority of the materials encountered in the preliminary geotechnical investigation consisted of finegrainedsoils (silts and clays). The structure of the soft fine-grained soils would probably be completelydisintegrated during a dredging operation such that it would become a slurry with minimal strength. Thestructure of the stiff fine-grained soils may be somewhat preserved during the dredging operations suchthat “clay balls” would remain within the fill with the stiffer consistency. However, it is anticipated thatthe matrix of the dredged fills would be materials of very low strength.W:\27663042\00005-c-r.doc\1-Mar-04\SDG 6-4
SECTIONSIX<strong>Preliminary</strong> Embankment Design ConsiderationsSandy alluvial deposits were encountered near the seafloor in some of the explorations near the existingshoreline (see logs of Borings 7, 11 and CPTs 9, 10, 12, 23, 25). Five to ten feet of fine-grained seaflooror lacustrine deposits typically overly the sand. It would appear that the most promising areas for a sandborrow source would be along the west side of the <strong>Sea</strong>, or near the mouth of Salt Creek along the eastside. It is suspected that the steeper bathymetry in these areas is indicative of a predominately sandymaterial near the surface. Particle size analyses on samples obtained from the sand layers encounteredindicate they are fine sands with less than 20 percent silts and clays, but may be interbedded withmaterials with higher fines content. Ideally, it would be desirable to use coarser-grained sands and gravelsthan those encountered in this investigation that would drain and gain strength quicker when hydraulicallyplaced. A compilation of the particle size analyses on the alluvial sands are presented in Figure 24.The alluvial sand layer encountered in Boring 7 was about 20 feet thick. This layer would need to extendover about 1,000 acres (or about 1½ square miles) to provide the borrow for the 32 million cubic yards ofmaterial that was estimated for a hydraulically placed earthen barrier.W:\27663042\00005-c-r.doc\1-Mar-04\SDG 6-5
SECTIONSEVENFurther StudiesSECTION 7FURTHER STUDIESThis investigation has been preliminary in nature and additional studies will need to be performed as therestoration concepts are further developed. This section provides a discussion of studies that havecurrently been identified that should be performed as the development of the preferred restorationalternative proceeds.7.1 REVISED AND ALTERNATIVE RESTORATION CONCEPTSThe current conceptual alternatives for a mid-<strong>Sea</strong> dam or barrier were developed without knowledge ofspecific subbottom conditions at the proposed mid-<strong>Sea</strong> location. It had been somewhat arbitrarilyassumed that 25 feet of soft/weak soils would need to be removed to prepare a foundation forembankments at the mid-<strong>Sea</strong> location, and that flat embankment side slopes would be required for seismicstability. The data obtained from the preliminary geotechnical investigation now provides specificinformation on the depth and consistency/strength of the foundation materials. These data should beutilized to revise the existing concepts with specific depth of removals and embankment slope inclinationsrequired for stability. Additionally, techniques such as minimal removal of weak materials with in-situground improvement to strengthen the foundation soils should be evaluated.The subbottom conditions as currently characterized by the preliminary geotechnical investigation alsowarrant evaluation of alternative concepts for the mid-<strong>Sea</strong> dam or barrier. Earthen dam or barrier conceptswere previously considered the most economical. However, given the subbottom conditions, as they arecurrently characterized, structural barriers, such as precast concrete caissons or steel sheetpile structuresthat minimize the foundation footprint, may be more economical. It is recommended that a workshop ofengineering experts, similar to what was used to develop the current dam and barrier concepts, beconvened to brainstorm additional alternatives that recognize the subbottom conditions that have beencharacterized from the preliminary geotechnical investigation.7.2 FAULT LOCATIONSThe San Andreas Fault is mapped 1.8 miles east of the east end of the mid-<strong>Sea</strong> location. This fault isprojected to enter the <strong>Sea</strong> just east of Bombay Beach. The Imperial and Brawley faults are mapped at thesouthern end of the <strong>Sea</strong>. The locations of these onshore faults could all be projected into the <strong>Sea</strong>.Historical seismicity data also implies that faults do underlie the <strong>Sea</strong>, although their surface projection isunknown. These data do not preclude the possibility that an active fault could cross proposedembankment locations. This potential fault rupture hazard should be further evaluated to assess thepossible presence and activity of the faults.The in-<strong>Sea</strong> locations of the restoration alternatives are ideally suited to investigation of the potential faultrupture hazard using marine geophysical methods. Using subbottom-profiling techniques, the continuityof subbottom sediment layers can be investigated. If disruptions in the layers are identified, samples of thesubbottom sediments can be obtained and age-dated to determine the recency of the disruptions. If activefault strands are identified, the restoration alternatives should avoid these locations, or if they cannot, thendesigns should be developed that would mitigate the consequences of fault displacements.W:\27663042\00005-c-r.doc\1-Mar-04\SDG 7-1
SECTIONSEVENFurther Studies7.3 ADDITIONAL GEOTECHNICAL INVESTIGATIONSAs the restoration concepts are further developed, additional geotechnical explorations will be warranted.It should be recognized that the explorations completed for the preliminary geotechnical investigation aremiles apart. Variations in subbottom conditions could occur between the existing exploration locations.As specific locations are identified for the restoration alternatives, the subbottom conditions will need tobe further characterized in those areas. The subsurface conditions encountered in these investigationscould significantly influence the type of the restoration alternative and its location.Detailed subsurface characterization will be needed to interpret and quantify the geological variability thatexists in the <strong>Salton</strong> <strong>Sea</strong>. Specifically, it will be necessary to interpret the location of potential fault traces andsplays and further characterize the thickness of soft subbottom sediments. Therefore, the next phase of in-<strong>Sea</strong>geotechnical exploration should comprise geophysical surveys as discussed in Section 7.2. The geophysicalsurveys also provide cost-effective spatial interpretations between boring or CPT locations.Additional marine-based explorations should follow the geophysical surveys using a jackup barge as adrilling platform. The jackup barge successfully provided a stable platform such that minimal time waslost during the preliminary investigation due to rough <strong>Sea</strong> conditions. This preliminary geotechnicalinvestigation also used drilled and sampled borings combined with CPTs. This has provided an excellentcombination of material characterization of the boring samples with the nearly continuous lithologyobtained from the CPTs. <strong>In</strong> addition, consideration should be given to in-situ testing of strengths andcompressibilities, such as vane shear testing and pressuremeter testing.A substantial amount of embankment fill may need to be borrowed from upland areas. A reconnaissancelevel study should be undertaken to identify potential borrow areas in the vicinity of the <strong>Sea</strong>. The needwill be to identify potential sources of sandy material. It is anticipated that sufficient quantities ofgranular materials could be identified in areas near the base of the surrounding mountains. Subsurfaceexplorations should then be performed in the areas identified to confirm the quality of the potentialborrow materials.A large quantity of rock and riprap would also be required to construct and armor in-<strong>Sea</strong> embankmentsthat may be part of the preferred restoration alternative. Potential sources of this rock should also beidentified as part of the reconnaissance level study, followed by explorations to confirm the quality of therock. The nearby Eagle Mountain and Mesquite mines have large quantities of rock that are in wastestockpiles and may be suitable for use as rock embankments or riprap. The quality of that rock for theseuses should also be evaluated.7.4 DYNAMIC RESPONSE OF EMBANKMENTSThe side slope inclinations of the embankments for the conceptual mid-<strong>Sea</strong> dam and barriers were basedprimarily on the judgment of the engineers that had developed the concepts. However, the proposedembankments are probably in an area with the highest potential seismicity in California. Furthermore,very few large earthen structures have been designed in the area. It is recommended that the conceptualdesigns of embankments that are developed for the restoration alternatives be validated by performingpreliminary dynamic response analyses of the proposed embankment configurations.The preliminary dynamic response analyses could be performed by evaluating the potential groundshaking at the site and selecting representative acceleration time histories of equivalent earthquakes. Afinite difference program could then be used to model the response of a proposed embankment. MaterialW:\27663042\00005-c-r.doc\1-Mar-04\SDG 7-2
SECTIONSEVENFurther Studiesparameters from similar embankment materials could be used in the preliminary analyses. These analyseswould then validate the appropriateness of a conceptual design, given the seismic exposure at the <strong>Sea</strong>.W:\27663042\00005-c-r.doc\1-Mar-04\SDG 7-3
SECTIONEIGHTUncertainties and LimitationsSECTION 8UNCERTAINTIES AND LIMITATIONSOnly a very small portion of the pertinent subbottom conditions has been explored. It should berecognized that the explorations are miles apart and variations in subbottom conditions could occurbetween the explorations. The preliminary engineering characterization of the subbottom sediments couldchange based on the results of additional explorations and testing.The <strong>Salton</strong> <strong>Sea</strong> is in one of the most seismic areas of California. It is anticipated that a major earthquakewill occur on the San Andreas Fault, and other nearby faults, during the lifetime of the project. Therefore,the potential seismic hazards that could impact the project will need to be further evaluated.<strong>Geotechnical</strong> engineering and the geologic sciences are characterized by uncertainty. Professionaljudgments presented here are based partly on our understanding of the proposed project, and partly on ourgeneral experience. Our engineering work and judgments rendered meet current professional standards;we do not guarantee the performance of the project in any respect.W:\27663042\00005-c-r.doc\1-Mar-04\SDG 8-1
SECTIONNINEReferencesSECTION 9REFERENCESAgnew, D. C. and Wyatt, F.C., 2003, “Long-Base Laser Strainmeters: A Review”, Scripps <strong>In</strong>stitute ofOceanography Technical Report, 53 p.Agraian Research, 2003. Characterization of Shallow Sub-surface Sediments of the <strong>Salton</strong> <strong>Sea</strong>, submittedto <strong>Salton</strong> <strong>Sea</strong> Science Office, dated November 4, 2003.Biehler, S., 1964. Geophysical framework of northern end of Gulf of California structural province, invan Andel, T.H., and Shor, G.G., Jr., eds., Marine geology of the Gulf of California: AmericanAssociation of Petroleum Geologists memoir 3, p.126-143.Biehler, S., 1971. Gravity Studies in the Imperial Valley, in Cooperative Geological-Geophysical<strong>In</strong>vestigations of Geothermal Resources in the Imperial Valley area of California, University ofCalifornia, Riverside, California, pp. 29-41.Cook, C.B., D.W. Huston, G.T. Orlob, I.P. King, and S.G. Schladow, 1998. <strong>Salton</strong> <strong>Sea</strong> Project Phase IIFinal Report: Data Collection and Analysis for Calibration and Verification of a Three-Dimensional Hydrodynamic Model, (Report 98-2) prepared for <strong>Salton</strong> <strong>Sea</strong> Authority andCalifornia Department of Water Resources. Department of Civil and Environmental Engineering,University of California. Davis, CA.Crowell, J.C., 1981. Juncture of San Andreas transform system and Gulf of California rift, Oceanol, Acta3, Proc.26 th <strong>In</strong>ternational Geological Congress, Geology of Continental Margins, pp. 137-141.Crowell, J.C. and A.G. Sylvester, eds., 1979. Tectonics of the Juncture Between The San Andreas FaultSystem and the <strong>Salton</strong> Trough, Southeastern California, Dept. of Geological Sciences.,University of California Santa Barbara, 193 pp.Damiata, B.N., S.K., Park, T.C. Lee, 1986. Geophysical Overview: Imperial Valley, Southern California,in Geology of the Imperial Valley, California: South Coast Geological Society Guidebook p. 116-133.Diblee, T.W. Jr., 1954. Geology of the Imperial Valley Region, California, California Division of Minesand Geology Bulletin 170, Chap. II Part 2:21-28.Eberly, L.D., and Stanley, T.B., Jr., 1978. Cenozoic stratigraphy and geologic history of southwesternArizona: Geologic Society of AmericaBulletin, V.89, no. 6, p. 921-940.Elders, W.A., Rex, R.W., Meidev, T., Robinson, P.T., and Biehler, S., 1972. Crustal spreading insouthern California: Science, v. 178, pp. 15-24.Fuis, G.S., Mooney, W.D. Healy, J.H., McMechan, G.A., and Lutter, W.J., 1981. Seismic refractionstudies of the Imperial Valley region, California-profile models, a traveltime contour map, and agravity model, U.S. Geological Survey Open-File Report 81-270, 73p.W:\27663042\00005-c-r.doc\1-Mar-04\SDG 9-1
SECTIONNINEReferencesGilmore, T.D., 1986, “Historic vertical displacements in the <strong>Salton</strong> Trough and adjacent parts ofsoutheastern California”, U.S. Geological Survey, Open-File Report 86-380, 40 p.Grunsky, O.E., 1907, “The Lower Colorado River and the <strong>Salton</strong> Basin”, Paper No. 1051, Transactions ofthe American Society of Civil EngineersIdriss, I.M., 1990. Response of Soft Soil Sites during Earthquakes, Proceedings, H. Bolton Seed MemorialSymposium, Volume 2, BiTech Publishers Ltd. pp. 273-289.Jenkins, O.P., 1965. Santa Ana Sheet of the Geologic Map of California, Division of Mines and Geology,Scale 1:250,000.Jennings, C.W., 1967. <strong>Salton</strong> <strong>Sea</strong> Sheet of the Geologic Map of California, Division of Mines andGeology, Scale 1:250,000.Jennings, C.W., 1994. Fault Activity Map of California and Adjacent Areas – With locations and ages ofRecent Vocanic Eruptions, California Division of Mines and Geology, Geologic Data Map No. 6scale 1:750,000.Johnson, C.E. et al., 1982. The Imperial Valley, California, earthquake of October 15, 1979, U.S.Geological Survey Professional Paper 1254, 451 pp.Kulkarni, R.B., K. Sadigh, and I.M. Idriss, 1979. Probabilistic Evaluation of Seismic Exposure,Proceedings, Second U.S. National Conference on Earthquake Engineering, Stanford, California.pp. 90-98.Lambe, T. William, and Robert V. Whitman, 1969. Soil Mechanics, John Wiley & Sons.Lawrence Livermore National Laboratory, 1987. Shallow Drilling in the <strong>Salton</strong> <strong>Sea</strong> Region, the ThermalAnomaly, a paper prepared by R.L. Newmark, P.W. Kasameyer, and L.W. Yonker, datedSeptember, 1987.LFR Levine-Fricke, 1999. Environmental Reconnaissance of the <strong>Salton</strong> <strong>Sea</strong>:Sediment Contaminants,Riverside and Imperial Counties, California, prepared for Tom Kirk, Executive Director, <strong>Salton</strong><strong>Sea</strong> Authority, dated July 2, 1999.Morton, P.K., 1977, Geology and Mineral Resources of Imperial County, County Report 7, CaliforniaDivision of Mines and GeologyNorris, R.M., and others, 1979, “Geomorphology of the <strong>Salton</strong> Basin, California: Selected Observations”,in Geological Excursions in the Southern California Area, fieldtrip guidebook, published by SanDiego State University, Department of Geological Sciences for the Geological Society ofAmerica Annual Meeting, November 1979. pages 19-46Remeika, P. and L. Lindsay, 1992. Geology of Anza-Borrego: Edge of Creation, Sunbelt Publications,202 pp.W:\27663042\00005-c-r.doc\1-Mar-04\SDG 9-2
SECTIONNINEReferencesRoberston, P.K., 1990. Soil Classification using the Cone Penetration Test, Canadian <strong>Geotechnical</strong>Journal, Vol. 27, pp. 151-158.Seed, R.B., Cetin, K.O., Moss, R.E.S., et al, 2001. Recent Advances in Soil Liquefaction Engineering andSeismic Site Response Evaluation, in Proceedings Fourth <strong>In</strong>ternational Conference on RecentAdvances in <strong>Geotechnical</strong> Earthquake Engineering and Soil Dynamics in Honor of ProfessorW.D. Liam Finn, San Diego, California.Sharp, R.V., 1972. Tectonic Setting of the <strong>Salton</strong> Trough in the Borrego Mountain Earthquake of April 9,1968, U.S. Geological Survey Professional Paper, 787, 3-15.Somerville, P.G., N.F. Smith, R.W. Graves, and N.A. Abrahamson, 1997. Modification ofEmpiricalStrong Ground Motion Attenuation Relations to <strong>In</strong>clude the Amplitude and DurationEffects of Rupture Directivity, Seismological Research Letters, Volume 68, No. 1,January/February 1997. pp. 199-222.Tarbet, L.A., 1951. Imperial Valley, Califonria, [section 13] of Possible future petroleum provinces ofNorth America: American Association of Petroleum Geologists Bulletin, V.35, no. 2, p. 260-263.Tetra Tech, <strong>In</strong>c., 2000. Draft, <strong>Salton</strong> <strong>Sea</strong> Restoration Project, Environmental ImpactStatement/Environmental Impact Report, prepared by Tetra Tech, <strong>In</strong>c., for <strong>Salton</strong> <strong>Sea</strong> Authorityand U.S. Department of <strong>In</strong>terior, Bureau of Reclamation, dated January 2000.USBR, 1974. Federal/State Feasibility Report, <strong>Salton</strong> <strong>Sea</strong>, California, prepared by United StatesDepartment of the <strong>In</strong>terior and the Resources Agency of California, dated April, 1974, Volume 1,Appendix C-Geology.USBR, 1998. <strong>Salton</strong> <strong>Sea</strong> Alternative, Final Preappraisal Report, prepared by United States Departmentof the <strong>In</strong>terior and the Bureau of Reclamation , Lower Colorado Region, dated November 12,1998.USBR, 2003a. <strong>Salton</strong> <strong>Sea</strong> Workshop Assigned Action Item – Appraisal Grade Cost Estimates for <strong>Salton</strong><strong>Sea</strong> Mid-<strong>Sea</strong> Impervious Dam And Impervious Dike, Memorandum prepared by Leo Handfelt(URS), Michael Clinton (Consultant to SSA) and Jack Delp (Reclamation Consultant), datedJanuary 22, 2003.USBR, 2003b. <strong>Salton</strong> <strong>Sea</strong> Barrier Design Workshop – La Quinta, California, Memorandum prepared byLeo Handfelt (URS), William Brownlie (Tetra Tech), and Jack Delp (Reclamation Consultant),dated July 23, 2003.U.S. Geological Survey, 1908, Reconnaissance Map of the <strong>Salton</strong> Sink, California, scale 1:500,000Youd, T. Leslie, and Michael J. Bennett, 1983. Liquefaction Sites, Imperial Valley, California, in Journalof <strong>Geotechnical</strong> Engineering, Volume 109, Number 3, pp. 440-457, dated March 1983.W:\27663042\00005-c-r.doc\1-Mar-04\SDG 9-3
TablesW:\27663042\00005-c-r.doc\1-Mar-04\SDG
TablesTable 1Summary of <strong>In</strong>-<strong>Sea</strong> Explorations<strong>Salton</strong> <strong>Sea</strong> Restoration ProjectExplorationDesignationExplorationType aActual Location bLatitudeLongitudeCompletedExplorationDepth(feet)<strong>Sea</strong>floorElevation(feet, MSL)Bottom ofExploration(feet, MSL)1 CPT 33.35427 -115.77464 42 -257 -2992 Boring 33.35660 -115.77946 149 -258 -4073 CPT 33.33546 -115.80324 59 -269 -3284 Boring 33.30765 -115.79666 52 -268 -3205 Boring 33.31832 -115.82606 51 -268 -3196 Boring 33.33248 -115.85323 52 -269 -3217 Boring 33.30029 -115.85326 50 -259 -3098 CPT 33.30031 -115.85282 48 -259 -3079 CPT 33.28325 -115.88024 60 -237 -29710 CPT 33.16777 -115.79941 32 -238 -27011 Boring 33.17413 -115.79263 31 -243 -27412 CPT 33.18340 -115.78114 33 -253 -28613 CPT 33.18436 -115.63680 37 -239 -27614 Boring 33.20150 -115.66085 52 -250 -30215 CPT 33.22700 -115.69578 50 -268 -31816 CPT 33.30907 -115.62650 46 -233 -27917 Boring 33.30338 -115.64420 30 -244 -27418 CPT 33.29858 -115.65949 43 -253 -29619 Boring 33.40553 -115.91742 52 -275 -32720 Boring 33.49624 -116.02119 32 -254 -28621 CPT 33.34330 -115.92782 37 -260 -29722 CPT 33.40681 -115.83706 50 -263 -31323 CPT 33.42945 -116.03335 44 -251 -29524 Boring 33.42849 -116.01081 Eliminated due to weather delays25 CPT 33.44577 -115.86259 41 -249 -29026 Boring 33.33562 -115.79995 52 -267 -31927 CPT 33.34678 -115.78703 67 -266 -33228 CPT 33.32996 -115.81600 60 -269 -32929 CPT 33.30987 -115.83988 46 -267 -312Notes:a. CPT denotes Cone Penetration Test.b. The latitudes and longitudes are NAD 83.W:\27663042\00005-c-r.doc\1-Mar-04\SDG T-1
TablesTable 2Summary of Laboratory Tests Performed<strong>Salton</strong> <strong>Sea</strong> Restoration ProjectTest TypeMoisture Content(ASTM D2216)Total and Dry Densities(ASTM D2937)Atterberg Limits(ASTM D-4318)Particle Size Analyses(ASTM D-422)Percent Passing #200Sieve (ASTM D-1140)Specific Gravity Tests(ASTM D-854)Pinhole DispersionAnalyses (ASTM D-4647)Unconsolidated UndrainedCompression (ASTM D-2850)Consolidated UndrainedTriaxial Compression(ASTM D-4767)Consolidation(ASTM D-2435)PurposeNumber of Tests AssignedTotal Program Mid-<strong>Sea</strong> a North Area b South Area cMaterial Properties` 155 109 17 29Material Properties 89 63 11 15Material Properties 41 30 3 8Material Properties 39 25 3 8Material Properties 21 13 1 7Material Properties 7 4 0 3Material Properties 7 4 0 3Strength(Undrained)33 21 5 7Strength (Drained) 6 6 0 0Compressibility 15 11 2 2Notes:a. Mid-<strong>Sea</strong> data from Borings 2, 4, 5, 6, 7, and 26.b. North Area data from Borings 19 and 20.c. South Area data from Borings 11, 14, and 17.W:\27663042\00005-c-r.doc\1-Mar-04\SDG T-2
TablesTable 3Summary of Material Properties<strong>Salton</strong> <strong>Sea</strong> Restoration ProjectTest TypeUnified SoilClassification aNo. ofTests<strong>Sea</strong> Floor Deposit Soft Lacustrine Deposit Alluvial Deposits Stiff Lacustrine DepositsHigh Low Avg. MedianNo. ofTestsHigh Low Avg. Median34 91%CH / 9% SM 31 87% CH / 3% ML/ 10% CL 27No. ofTestsHigh Low Avg. Median52% SM / 15% ML / 7% CL / 7%SP-SM / 15% CH / 4%SCNo. ofTests64High Low Avg. Median72% CH / 14% CL / 9% SM /3% ML / 2% CL-MLWater Content(%)34 98 22 63 66 31 65 30 43 41 26 41 15 25 24 64 52 19 32 32Total UnitWeight (pcf)28 127 93 102 99 21 120 97 110 113 11 128 115 123 124 29 128 102 119 121Dry UnitWeight (pcf)28 102 47 64 52 21 91 61 79 80 11 106 85 98 100 29 105 71 90 91Liquid Limit(%)11 85 60 77 79 11 89 32 66 71 1 97 97 97 97 18 79 21 55 63Plasticity <strong>In</strong>dex(%)11 54 40 48 52 11 58 12 40 46 1 65 65 65 65 18 54 4 34 40Liquidity <strong>In</strong>dex 11 1.59 0.20 0.81 0.72 11 1.63 0.12 0.63 0.35 1 -0.12 -0.12 -0.12 -0.12 18 1.50 0.09 0.39 0.22Plastic Limit(%)8 33 20 30 31 11 32 16 26 28 1 32 32 32 32 18 26 15 21 23Sand b (%) 21 86 1 41 36 4 7 1 4 4 12 91 6 59 61 14 88 0 24 9Fines c (%) 11 100 14 64 78 4 99 93 96 97 23 97 9 43 34 22 100 12 73 88SpecificGravity3 2.76 2.68 2.72 2.72 1 2.77 2.77 2.77 2.77 1 2.72 2.72 2.72 2.72 3 2.77 2.73 2.76 2.77Notes:a. Percentages denote that of samples tested.b. Averages and medians may be biased as coarser samples were selected for particle size analyses.c. Percent finer than the No. 200 seive.d. na denotes test data not available for that stratumW:\27663042\00005-c-r.doc\1-Mar-04\SDG T-3
TablesTable 4Summary of Unconsolidated Undrained Triaxial Test Data<strong>Salton</strong> <strong>Sea</strong> Restoration ProjectExplorationNumberSampleNumberSampleDepth(ft)Unified SoilClassificationStrataWaterContent(%)LiquidLimit(%)Plasticity<strong>In</strong>dex(%)DryDensity(pcf)TriaxialConfiningPressures(psf)Peak DeviatorStressat Failure(psf)AxialStrainat Failure(%)UndrainedShearStrength,Cu(psf)B-4 2 4.2 CH <strong>Sea</strong>floor Deposit 78 74 41 53 500 250 13.0 125B-4 5 21.5 CH <strong>Sea</strong>floor Deposit 28 ― ― 96 1,000 1,600 16.0 800B-5 1 2.6 CH <strong>Sea</strong>floor Deposit 79 85 54 54 500 350 10.0 175B-6 1 2.8 CH <strong>Sea</strong>floor Deposit 72 ― ― 55 500 400 10.0 200B-17 1 1.5 CH <strong>Sea</strong>floor Deposit 98 72 44 47 500 150 10.0 75B-19 2 5.8 CH <strong>Sea</strong>floor Deposit 66 82 52 60 500 300 13.0 150B-2 2 4.5 CHB-5 5 21.6 CHB-6 3 12.2 CHB-14 2 5.7 CLB-20 2 5.5 CHSoft LacustrineDepositSoft LacustrineDeposit<strong>Sea</strong>floor Deposit /Soft LacustrineDepositSoft LacustrineDepositSoft LacustrineDeposit34 70 42 88 500 2,200 7.1 1,10040 ― ― 80 1,000 1,100 10.6 55031 ― ― 91 750 700 17.7 35039 ― ― 83 500 400 24.0 20037 70 44 84 500 2,100 22.5 1,050W:\27663042\00005-c-r.doc\1-Mar-04\SDG T-4
TablesTable 4 (continued)Summary of Unconsolidated Undrained Triaxial Test Data<strong>Salton</strong> <strong>Sea</strong> Restoration ProjectExplorationNumberSampleNumberSampleDepth(ft)Unified SoilClassificationStrataWaterContent(%)LiquidLimit(%)Plasticity<strong>In</strong>dex(%)DryDensity(pcf)TriaxialConfiningPressures(psf)PeakDeviatorStressat Failure(psf)AxialStrainatFailure(%)UndrainedShearStrength,Cu(psf)B-2 4 14.8 CHB-2 7 28.7 CHB-4 11 51.5 CHB-5 10 46.0 CHB-6 10 46.0 CHB-11 7 25.8 CHB-14 4 16.6 CHB-17 3 10.0 CHB-17 5 20.0 CHB-17 7 29.9 CHB-19 8 36.2 CHUpper Stiff LacustrineDepositUpper Stiff LacustrineDepositUpper Stiff LacustrineDepositUpper Stiff LacustrineDepositUpper Stiff LacustrineDepositUpper Stiff LacustrineDepositUpper Stiff LacustrineDepositUpper Stiff LacustrineDepositUpper Stiff LacustrineDepositUpper Stiff LacustrineDepositUpper Stiff LacustrineDeposit29 ― ― 95 750 4,700 10.5 2,35029 ― ― 98 1,300 2,000 13.8 1,00052 79 54 71 2,500 900 16.3 45040 ― ― 84 4,500 380 21.0 19026 ― ― 98 2,000 3,400 15.5 1,70050 ― ― 72 1,200 1,400 8.0 70035 ― ― 83 750 600 15.1 30035 66 40 87 500 2,100 10.5 1,05032 62 38 89 1,000 3,300 7.8 1,65029 75 51 96 1,500 5,100 3.9 2,55038 ― ― 85 1,500 1,800 20.0 900W:\27663042\00005-c-r.doc\1-Mar-04\SDG T-5
Table 4 (continued)Summary of Unconsolidated Undrained Triaxial Test Data<strong>Salton</strong> <strong>Sea</strong> Restoration ProjectTablesExplorationNumberSampleNumberSampleDepth(ft)Unified SoilClassificationB-19 10 45.8 CHB-20 5 21.0 CHB-26 11 50.8 CHB-2 14 68.8 SMB-2 18 88.5 CHB-2 24 118.7 CHB-2 26 128.7 CLB-2 29 148.7 CHB-7 4 15.0 SCB-7 6 25.6 SMB-7 7 30.2 CHStrataUpper StiffLacustrine DepositUpper StiffLacustrine DepositUpper StiffLacustrine DepositLower StiffLacustrine DepositLower StiffLacustrine DepositLower StiffLacustrine DepositLower StiffLacustrine DepositLower StiffLacustrine DepositUpper AlluvialDepositUpper AlluvialDepositUpper AlluvialDepositWaterContent(%)LiquidLimit(%)Plasticity<strong>In</strong>dex(%)DryDensity(pcf)TriaxialConfiningPressures(psf)PeakDeviatorStressatFailure(psf)AxialStrainatFailure(%)UndrainedShearStrength, Cu(psf)43 ― ― 78 2,000 1,400 18.0 70034 ― ― 88 1,000 1,200 21.0 60035 ― ― 85 2,500 3,400 10.0 1,70028 ― ― 95 3,000 4,200 9.6 2,10031 63 40 92 4,000 3,800 9.0 1,90032 66 41 91 5,500 8,600 4.9 4,30026 44 23 98 6,000 7,700 7.7 3,85031 62 39 92 7,000 7,900 7.8 3,95024 ― ― 102 750 1,800 19.5 90023 ― ― 104 1,500 10,300 6.8 5,15024 ― ― 100 2,000 3,900 17.5 1,950W:\27663042\00005-c-r.doc\1-Mar-04\SDG T-6
TablesTable 5Summary of Consolidated Undrained Triaxial Test Data<strong>Salton</strong> <strong>Sea</strong> Restoration ProjectExplorationNumberSampleNumberSampleDepth(ft)Unified SoilClassificationStrataAverageWaterContent a(%)LiquidLimit(%)Plasticity<strong>In</strong>dex(%)AverageDryDensity b(pcf)EffectiveCohesion c(psf)EffectiveFrictionAngle c(degrees)B-4 4 16 CH <strong>Sea</strong>floor Deposit 58 76 43 62 0 32B-5 3 11 CL/CH <strong>Sea</strong>floor Deposit 78 ― ― 55 120 24B-6 2 7 CH <strong>Sea</strong>floor Deposit 66 83 53 59 100 28B-26 2, 3 5, 10 CH <strong>Sea</strong>floor Deposit 67 83 53 61 0 30B-4 8 36 CHB-5 4 16 CHB-6 4 16 CHNotes:a. Water Content prior to consolidation.b. Dry Density prior to consolidation.c. See Figures C-160 through C-124 for Mohr-Coulomb Envelopesd. See Table C-3 for additional details on ICU tests.Soft LacustrineDepositSoft LacustrineDepositSoft LacustrineDeposit51 78 46 66 2200 2338 ― ― 82 200 2647 89 58 106 0 30W:\27663042\00005-c-r.doc\1-Mar-04\SDG T-7
TablesTable 6Summary of Consolidation Test Data<strong>Salton</strong> <strong>Sea</strong> Restoration ProjectExplorationNumberSampleNumberSampleDepth(ft)Unified SoilClassificationStrataWaterContent(%)LiquidLimit(%)Plasticity<strong>In</strong>dex(%)Liquidity<strong>In</strong>dex<strong>In</strong>itialDryDensity(pcf)<strong>In</strong>itialVoidRatioExistingOverburdenPressure(psf)ApparentPreconsolidationPressure(psf)OCR Cc Cr CR RRCv(ft 2 /yr)RemarksB-4 3 12.0 CH <strong>Sea</strong>floor Deposit 81.9 84 53 0.37 53 2.24 396 900 2.3 0.568 0.057 0.175 0.020 40B-5 2 7.0 CH <strong>Sea</strong>floor Deposit 58.3 ― ― ― 64 1.98 252 620 2.5 0.792 0.079 0.266 0.024 8B-5 3 10.0 CH <strong>Sea</strong>floor Deposit 56.0 79 53 0.57 61 1.79 377 450 1.2 0.762 0.076 0.273 0.017 33B-17 2 5.0 ML <strong>Sea</strong>floor Deposit 51.3 ― ― ― 74 1.36 240 550 2.3 0.229 0.023 0.097 0.014 16B-19 1 2.0 ML <strong>Sea</strong>floor Deposit 83.4 ― ― ― 52 2.30 74 350 4.7 1.096 0.110 0.332 0.023 10B-26 1 2.0 ML <strong>Sea</strong>floor Deposit 78.2 ― ― ― 56 2.15 67 575 8.6 0.864 0.086 0.274 0.007 24B-4 9 41.0 CHSoft LacustrineDeposit60.9 ― ― ― 64 1.68 1461 1700 1.2 0.611 0.061 0.228 0.018 14B-7 2 6.0 CL/CHSoft LacustrineDeposit33.6 71 47 0.20 89 0.94 304 1300 4.3 0.142 0.014 0.073 0.012 21B-14 2 6.0 MLSoft LacustrineDeposit29.6 32 12 1.56 90 1.05 251 1300 5.2 0.097 0.010 0.048 0.003 135B-19 5 20.0 CHSoft LacustrineDeposit52.6 ― ― ― 87 0.97 848 850 1.0 0.186 0.019 0.094 0.008 39B-26 4 15.0 ML/CLSoft LacustrineDeposit20.9 32 16 1.63 94 1.15 607 580 1.0 0.247 0.025 0.115 0.017 9B-7 4 15.0 SMUpper AlluvialDeposit24.1 97 65 -0.12 92 0.87 779 1000 1.3 0.140 0.014 0.075 0.014 6B-2 5 19.0 CHUpper StiffLacutrine Deposit32.5 65 42 0.23 91 0.79 1076 1200 1.1 0.111 0.011 0.062 na 14Sample swelled upon saturationprior to consolidation test.B-5 10 45.5 CHUpper StiffLacustrine Deposit36.7 ― ― ― 75 1.29 2154 1000 0.5 0.259 0.026 0.113 0.018 18B-6 6 26.0 SMSoft LacustrineDeposit / UpperStiff LacustrineDeposit25.1 ― ― ― 99 0.59 1119 2000 1.8 0.130 0.001 0.008 0.001 189W:\27663042\00005-c-r.doc\1-Mar-04\SDG T-8
TablesTable 7Recent Large Earthquakes in the <strong>Salton</strong> Trough<strong>Salton</strong> <strong>Sea</strong> Restoration ProjectFault Year of Earthquake MagnitudeImperial FaultCerro PrietoSan Jacinto Zone(Elmore Ranch/Supersition Hills)1979 6.51940 7.01966 6.31940 6.01934 7.11915 7.11987 6.2/6.6(Borrego Mountain) 1968 6.7(Arroyo Salada) 1954 6.5(Lower Borrego Valley) 1942 6.6W:\27663042\00005-c-r.doc\1-Mar-04\SDG T-9
TablesTable 8<strong>Preliminary</strong> Characterization of Material Properties<strong>Salton</strong> <strong>Sea</strong> Restoration ProjectParameter Symbol Units <strong>Sea</strong>floor DepositSoft LacustrineDepositAlluvial DepositStiff LacustrineDepositTotal Unit Weight γ t pcf 100 110 125 120Water Content w % 62 44 26 32Undrained Shear Strength Cu psf NA NA 2700 1900Undrained Shear Strength Ratio Cu/σ'vo psf 0.35 0.35 NA NAEffective Cohesion c' psf 0 0 0 NAEffective <strong>In</strong>ternal Friction Angle (Peak) φ' degrees 27 25 30 NAEffective <strong>In</strong>ternal Friction Angle (Ultimate b ) φ' degrees 25 23 NA NACompression <strong>In</strong>dex Cc NA 0.65 0.35 0.10 0.14Recompression <strong>In</strong>dex Cr NA 0.10 0.05 0.02 0.02<strong>In</strong>itial Void Ratio eo NA 1.90 1.30 0.90 0.95Overconsolidation Ratio OCR NA 1.5 1.0 NA NACoefficient of Consolidation (Lab) Cv ft 2 /year 15 20 NA NANotes:a. NA denotes insufficient information or parameter not applicable to strata.b. Ultimate condition is defined as the point where continuous shear deformation continues with no further changes in volume.W:\27663042\00005-c-r.doc\1-Mar-04\SDG T-10
TablesTable 9Results of <strong>Preliminary</strong> Embankment Stability Analyses<strong>Salton</strong> <strong>Sea</strong> Restoration ProjectAnalyticalCase aEmbankment Crest b(feet MSL)Embankment Slope c(H:V)AssumedFoundationOverexcavation d(feet)Assumed Cu/σ'vof Foundation Soils eCalculated StaticFactor of Safety f1 -225 2.5:1 0 0.3 0.72 -225 2.5:1 0 0.4 0.93 -225 2.5:1 10 0.3 0.84 -225 2.5:1 10 0.4 1.05 -225 2.5:1 25 0.3 1.16 -225 2.5:1 25 0.4 1.37 -225 2.5:1 35 0.3 1.38 -225 2.5:1 35 0.4 1.59 -225 6:1 0 0.3 1.310 -225 6:1 0 0.4 1.711 -225 6:1 10 0.3 1.412 -225 6:1 10 0.4 1.813 -225 6:1 25 0.3 1.614 -225 6:1 25 0.4 2.015 -225 10:1 0 0.3 1.816 -225 10:1 0 0.4 2.417 -225 10:1 10 0.3 1.918 -225 10:1 10 0.4 2.419 -225 10:1 25 0.3 2.120 -225 10:1 25 0.4 2.621 -240 2.5:1 0 0.3 0.822 -240 2.5:1 0 0.4 1.023 -240 2.5:1 10 0.3 1.024 -240 2.5:1 10 0.4 1.225 -240 2.5:1 25 0.3 1.4W:\27663042\00005-c-r.doc\1-Mar-04\SDG T-11
TablesTable 9 (continued)Results of <strong>Preliminary</strong> Embankment Stability Analyses<strong>Salton</strong> <strong>Sea</strong> Restoration ProjectAnalyticalCase aEmbankment Crest b(feet MSL)Embankment Slope c(H:V)Assumed FoundationOverexcavation d(feet)Assumed Cu/σ'vof Foundation Soils eCalculated StaticFactor of Safety f26 -240 2.5:1 25 0.4 1.627 -240 6:1 0 0.3 1.328 -240 6:1 0 0.4 1.729 -240 6:1 10 0.3 1.530 -240 6:1 10 0.4 1.931 -240 6:1 25 0.3 1.832 -240 6:1 25 0.4 2.233 -240 10:1 0 0.3 1.934 -240 10:1 0 0.4 2.435 -240 10:1 10 0.3 2.036 -240 10:1 10 0.4 2.537 -240 10:1 25 0.3 2.338 -240 10:1 25 0.4 2.8Notes:a. Graphical outputs of stability analyses are included in Appendix D.b. Embankment crest of -225 or -240 feet MSL assumed for <strong>Sea</strong> levels of -230 or -245 feet MSL, respectively.c. Embankment modeled as a dam with 30 foot crest, seafloor at -270 feet MSL, and built with materials with a total unit weight of 120 pcf anda friction angle of 30 degrees (stronger materials would be required for the 2.5:1 slopes, otherwise the embankment would fail).d. Assumed to be backfilled with granular material with total unit weight of 120 pcf and friction angle of 30 degrees.e. Cu/σ'v represents ratio of undrained shear strength to effective overburden pressure, assumed to be same value whether foundation soilswere seafloor deposits or soft lacustrine deposits..f. Standard of practice is to have a minimum static factor of safety of 1.5.W:\27663042\00005-c-r.doc\1-Mar-04\SDG T-12
TablesTable 10Results of Prelimary Embankment Settlement Analyses<strong>Salton</strong> <strong>Sea</strong> Restoration ProjectAnalyticalCaseExplorationEmbankmentCrest a(feet MSL)DepositDepositThickness b(feet)ConsolidationSettlement c(feet)Total ConsolidationSettlement d(feet)Average ConsolidationSettlement e(feet)1 CPT 3 -2252 CPT 29 -2253 CPT 3 -2404 CPT 29 -240<strong>Sea</strong>floor Desposit 16 3.6Soft Lacustrine Deposit 26 2.2<strong>Sea</strong>floor Desposit 13 3.2Soft Lacustrine Deposit 10 1.1<strong>Sea</strong>floor Desposit 16 2.9Soft Lacustrine Deposit 26 1.6<strong>Sea</strong>floor Desposit 13 2.8Soft Lacustrine Deposit 10 0.95.8 3.74.3 2.84.5 2.93.7 2.3Notes:a. Embankment crest of -225 or -240 feet MSL assumed for <strong>Sea</strong> levels of -230 or -245 feet MSL, respectively.b. As encountered in the exploration, assumes no overexcavation of soft materials.c. Calculated at the centerline of the embankment, for a seafloor at -270 feet MSL, embankment materials with a total unit weight of 120 pcf, and a CR=0.22 and OCR=1.5 for the seafloordesposits and CR=0.15 and OCR=1.0 for the soft lacustrine deposits.d. Does not include post-construction settlements of embankment, alluvial materials or stiff lacustrine deposits.e. Average settlement across bottom of embankment with 30-foot crest and 6:1 side slopes.W:\27663042\00005-c-r.doc\1-Mar-04\SDG T-13
TablesTable 11Results of <strong>Preliminary</strong> Settlement Rate Analyses<strong>Salton</strong> <strong>Sea</strong> Restoration ProjectDrainage Path a(feet)Coefficient of Consolidation b(ft 2 /yr)Time to 90% Consolidation(years)51020304010 0.520 0.240 0.110 2.020 1.040 0.510 7.920 3.940 2.010 17.720 8.940 4.410 31.520 15.840 7.9Notes:a. Drainage path is one-half the deposit thickness for double drainage and equal to the deposit thickness for single drainage.b. <strong>Preliminary</strong> characterization recommends Cv of 20 ft 2 /yr with a range ot 10 to 40 ft 2 /yr.W:\27663042\00005-c-r.doc\1-Mar-04\SDG T-14
FiguresW:\27663042\00005-c-r.doc\1-Mar-04\SDG
Drilling barge jacked up out of the water<strong>In</strong> <strong>Sea</strong> drilling activities on Boring 2PHOTOGRAPHS OF FIELD OPERATIONSALTON SEA RESTORATION PROJECTCHECKED BY: AJG DATE: 01-30-04PM: LDH PROJ. NO.: 27663042.00005FIG. NO.3<strong>Salton</strong><strong>Sea</strong> fig3,4,5
Standard penetration samplePunch Core samplePHOTOGRAPHS OF SAMPLESSALTON SEA RESTORATION PROJECTCHECKED BY: AJG DATE: 01-30-04PM: LDH PROJ. NO.: 27663042.00005FIG. NO.4<strong>Salton</strong><strong>Sea</strong> fig3,4,5
20-Ton capacity conePerforming Cone Penetration TestPHOTOGRAPHS OF CPT OPERATIONSALTON SEA RESTORATION PROJECTCHECKED BY: AJG DATE: 01-30-04PM: LDH PROJ. NO.: 27663042.00005FIG. NO.5<strong>Salton</strong><strong>Sea</strong> fig3,4,5
00 10 20 30 40 50 60102030405060708090100110120130140150Project Name: Restoration ProjectLocation: <strong>Salton</strong> <strong>Sea</strong>Project Number: 27663042Water Content vs. Depth(Boring 2)Figure No.16Atterberg_Limits_4
00 10 20 30 40 50 60 70 80 90510152025303540455055Boring 2 Boring 4 Boring 5 Boring 6 Boring 7 Boring 26Project Name: Restoration ProjectLocation: <strong>Salton</strong> <strong>Sea</strong>Project Number: 27663042Water Content vs. Depth(Borings 2,4,5,6,7,and 26)Figure No.17Atterberg_Limits_4
00 10 20 30 40 50 60 70 80 90 100510152025303540455055Boring 11 Boring 14 Boring 17Project Name: Restoration ProjectLocation: <strong>Salton</strong> <strong>Sea</strong>Project Number: 27663042Water Content vs. Depth(Borings 11,14,and 17)Figure No.18Atterberg_Limits_4
Water Content (percent dry weight)10 15 20 25 30 35 40 45 50 55 60 65 70 75 80051015Depth Below <strong>Sea</strong> Floor (feet)2025303540455055Boring 19 Boring 20Project Name: Restoration ProjectLocation: <strong>Salton</strong> <strong>Sea</strong>Project Number: 27663042Water Content vs. Depth(Borings 19 and 20)Figure No.19Atterberg_Limits_4
8070CH or OH60U-line50Plasticity <strong>In</strong>dex (%)40CLMH or CHA-line302010CL-MLML orOL00 10 20 30 40 50 60 70 80 90 100Liquid Limit (%)Project Name: Restoration ProjectLocation: <strong>Salton</strong> <strong>Sea</strong>Project Number: 27663042ATTERBERG LIMITTEST RESULTSFigure No.20Atterberg_Limits_4
0Torvane Shear Strength (psf)0 2,000 4,000 6,000 8,000 10,000 12,000 14,000 16,000 18,000 20,000 22,000 24,000510Boring 2Boring 4Boring 5Boring 6Boring 715Boring 14Depth below <strong>Sea</strong>floor (feet)202530Boring 17Boring 19Boring 20Boring 2635404550Project Name: Restoration ProjectLocation: <strong>Salton</strong> <strong>Sea</strong>Project Number: 27663042Torvane Data_psfTorvane Shear Strength vs. DepthFigure No.21
C u (psf)0 500 1,000 1,500 2,000 2,500 3,00001,0002,000<strong>Sea</strong>floor DepositSoft Lacustrine Deposit<strong>Sea</strong>floor DepositSoft Lacustrine DepositC u /σ v ' = 0.3C u /σ v ' = 0.4Published correlation for PI = 49 (<strong>Sea</strong>floor Deposit)Published correlation for PI = 39 (Soft Lacustrine Deposit)Notes:1. Solid symbols indicate ICU results, open symbols indicate UU results.2. Published correlation with PI is: C u /σ v ' = 0.11+0.0037*PIσv' or σ' con (psf)3,0004,0005,0006,000Project Name: Restoration ProjectLocation: <strong>Salton</strong> <strong>Sea</strong>Project Number: 27663042Undrained Shear Strength(from UU and CU Tests)vs. Effective StressFigure No.22j:/27663042/Stability/Undrained Shear Strength, Peak Deviation Stress
UNIFIED SOIL CLASSIFICATIONGRAVELCOARSE FINE COARSE MEDIUMFINEU. S. STANDARD SIEVE SIZES3" 2" 1" 3/4" 3/8" 4 10 20 40 60 100 200SILT AHYDR100908070PERCENT PASSING BY WEIGHT605040302010100 50 20 105 GRAIN SIZE IN 2 MILLIMETERS 10.5 0.20.10.0500.00.010.02 0.005Exploration Sample No. Depth (ft) SYMBOL Wn (%) Description and ClassificationB-7 3 10.5 • 15.2 Reddish Brown Silty SAND (SM)B-7 5 20.3 22.3 Reddish Brown Silty SAND (SM)B-7 6 25.6 25.6 Gray Poorly Graded SAND with Silt (SP-SM)B-11 4 9.3 • 23.3 Olive Brown Silty SAND (SM)B-11 5 14 19.4 Olive Brown Poorly Graded SAND with Silt (SP-SM)PROJECT NAME: <strong>Salton</strong> <strong>Sea</strong> RestorationPROJECT NUMBER: 27663042.00003PARTICLE SIZES OF IN-SEA GRANULAR MATERIALSFigureHydraulic Fill Borrow
APPENDIXA<strong>In</strong>-<strong>Sea</strong> BoringsW:\27663042\00005-c-r.doc\1-Mar-04\SDG
APPENDIXA<strong>In</strong>-<strong>Sea</strong> BoringsEleven borings (2, 4 through 7, 11, 14, 17, 19, 20 and 26) were drilled and sampled between September23 and October 20, 2003. The borings were numbered to be consecutive with the CPTs that were alsoperformed for the preliminary geotechnical investigation. The borings were drilled offshore by GreggDrilling of Signal Hill, California using a Mobile <strong>Sea</strong> 80-14 drill rig mounted on a jack-up spud barge. Aphotograph of the barge jacked out of the water is shown in Figure 3.The drilling was performed utilizing a rotary wash method of drilling with a 3.25-inch- diameter triconedrill bit and N-size drill rod. The approximate locations of the in-<strong>Sea</strong> borings are shown in Figure 2. A 4-inch diameter conductor casing was installed between the deck of the barge and the seafloor and the drillstring was advanced through the inside of the casing. Typically, the borings were advanced by circulating<strong>Sea</strong> water through the drill string, which in turn flushed the cuttings to the surface through the annularspace inside the conductor casing and into a settling basin. After the cuttings were removed from thesettling basin, the fluid was recirculated back through the drill string. At depth in Boring 2, a bentonitebased drill mud was mixed and added to the drilling fluid to stabilize the boring. The borings wereadvanced to elevations of between –274 and –407 feet MSL (30 to 149 feet below the seafloor). Aphotograph of the drilling operation is shown in Figure 3.All of the borings were drilled under the direction of a certified engineering geologist. Samples of thesubsurface materials encountered in the borings were collected at approximately 5 to 10-foot intervals forfurther classification and laboratory testing. The samples were obtained by pushing a thin-walled (Shelby)tube sampler (in accordance with ASTM D-1587) or a split spoon SPT sampler (in accordance withASTM D-1586). The lower portions of Boring 2 were also cored using a punch core 134-mm (5.28-inch)coring system. Photographs of the samplers used are shown in Figure 4.Shelby tube samples were obtained using a 3-inch diameter by 30-inch long stainless steel tube attachedto the end of the drill string. The tube was advanced hydraulically a distance of 24 to 30-inches bylowering the drive head and attached drill string the specified distance. At the completion of the push, thesampler was rotated two complete revolutions to shear the retained soil horizontally at the base. Afterremoval from the boring, the recovery of the sample was measured and calculated. The visible ends of theShelby tube were trimmed, and if fine grained, a Torvane TM test was conducted in the bottom end. Aftercleaning the inside of the sample tube above the recovered soil, each end was filled with moltenmicrocrystalline wax, covered with tight-fitting end caps, and secured with tape to insure an airtight seal.The sample was then placed and stored in an upright position and protected from the elements until itstransportation to the geotechnical laboratory for further classification and testing.Standard Penetration Tests (SPT) were obtained by driving a 2-inch diameter split spoon sampler into thesoil at the bottom of the borehole using a 140-pound hammer falling 30-inches. The number of blowsrequired to drive the sampler was recorded for a total of 18-inches of penetration. The first 6-inchincrement of penetration is considered to be a "seating interval" in disturbed soils or slough at the base ofthe borehole, and the corresponding blow count is not taken into consideration. The total number of blowsfor the last 12-inches of penetration, as indicated on the boring logs, was used to describe the relativedensity and consistency of the soil samples. Material from the inside of the sampler was classified inaccordance with the United Soil Classification System and placed in plastic baggies to retain moisturecontent. The sample was stored and protected from the elements until its transportation to thegeotechnical laboratory for further classification and testing.W:\27663042\00005-c-r.doc\1-Mar-04\SDG A-1
APPENDIXA<strong>In</strong>-<strong>Sea</strong> BoringsPortions of Boring 2 (below 50-feet) were cored using a punch core 134-mm (5.28-inch-diameter) coringsystem. The punch core system consists of an inner core barrel that is placed inside the drill string andextends out in front of the bit. As the boring is advanced, the core is retained in the inner 5-foot long corebarrel. At the completion of a 5-foot run, the entire core barrel is recovered on a wireline. The core isextruded from the core barrel at the surface using a hydraulic jacking system, logged and classified. Coresamples were placed into a plastic sleeve, sealed, and stored until transported to the geotechnicallaboratory for further classification and testing.The soils encountered in the borings were visually classified and logged in the field. A key to the boringlogs is presented in Figure A-1. Logs of the borings are presented in Figures A-2 through A-12.W:\27663042\00005-c-r.doc\1-Mar-04\SDG A-2
Project: <strong>Salton</strong> <strong>Sea</strong> RestorationProject Location:Project Number:<strong>Salton</strong> <strong>Sea</strong>, California27663042.00002Key to Log of ExplorationSheet 1 of 1Elevation,feetDepth,feetTypeSAMPLESNumberBlows perfootGraphic LogMATERIAL DESCRIPTIONWaterContent, %Dry Density, pctREMARKS ANDOTHER TESTS1 2 3 4 5 6 7 8 9 10COLUMN DESCRIPTIONS1 Elevation: Elevation in feet referenced to mean sea level(MSL) or site datum.2 Depth: Depth in feet below the ground surface.3 Sample Type: Type of soil sample collected at depth intervalshown; sampler symbols are explained below4 Sample Number: Sample identification number.Unnumbered sample indicates no sample recovery.5 Sampling Resistance: Number of blows required to advancedriven sampler 12 inches beyond first 6-inch interval, ordistance noted, using a 140-lb hammer with a 30-inch drop.6 Graphic Log: Graphic depiction of subsurface materialencountered; typical symbols are explained below.7Material Description: Description of material encountered;may include relative density/consistency, moisture, color(Munsell classification), particle size; tecture, weathering,and strength of formation material (USCS classification inparentheses).TYPICAL MATERIAL GRAPHIC SYMBOLS8910Water Content: Water content of soil sample measured inlaboratory, expressed as percentage of dry weight ofDry Unit Weight: Dry density of soil sample measured inlaboratory, in pounds per cubic foot.Remarks and Other Tests: Comments and observationsregarding drilling or sampling made by driller or fieldpersonnel. Other field and laboratory test results, using thefollowing abbreviations:LL(63): Liquid Limit (test result in percent)PI(28): Plasticity <strong>In</strong>dex (test result in percent)WA(91): Wash Analysis (percent passing #200 sieve)SA(94): Sieve Analysis (percent passing #200 sieve)UU(1000): Unconsolidated Undrained Strength Test (shearstrength in psf)SG(2.77): Specific Gravity (test result)CON: Consolidation TestCORR: Corrosivity TestsICU: Isotropically Consolidated Undrained TriaxialCompression TestPIN: Pinhole Dispersion TestGRAVEL (GW)Well graded SAND (SW)Poorly graded SAND (SP)Silty SAND (SM)Clayey SAND (SC)Clayey SILT (ML)CLAY (CL)CLAY to SILT (CL/ML)SILT (ML) Fat clays (CH) SAND to CLAY (SC/CL)SAND to SILT (SM/ML)TYPICAL SAMPLER GRAPHIC SYMBOLSOTHER GRAPHIC SYMBOLSSack or BagsampleCore sampleShelby TubesamplerStandard Penetrationsampler (SPT)Modified CaliforniasamplerAcetate sleevesFirst water encountered at time of drilling andsampling (ATD)Water level measured at specified time aftercompletion of drilling and sampling<strong>In</strong>ferred or gradational contact between strataGENERAL NOTES1. Soil classifications are based on the Unified Soil Classification System. Descriptions andstratum lines are interpretive; actual lithologic changes may be gradual. Field descriptionsmay have been modified to reflect results of lab tests.2. Descriptions on these logs apply only at the specific boring locations and at the time theborings were advanced. They are not warranted to be representative of subsurface conditionsat other locations or times.Figure A-1
Project: <strong>Salton</strong> <strong>Sea</strong> RestorationProject Location:Project Number:<strong>Salton</strong> <strong>Sea</strong>, California27663042.00002Log of BoringSheet 1 of 52Date(s) 10/7/03DrilledDrilling Tricone bit with rotary drillingMethodDrill Rig Mobile <strong>Sea</strong> 80-14TypeElevation of <strong>Sea</strong>Surface-227' below sea levelBoreholeNativeBackfillLoggedByDrill BitSize/TypeDrillingContractorSamplingMethod(s)LocationA. Greene3.25"Gregg DrillingShelby/SPT/Continuous coreN33.35660/W115.77946CheckedByA. GreeneTotal Depthof Borehole 149.3' below mudlineApproximateSurface Elevation-258.2' below sea levelHammerData 140 lbs/30" dropElevation,feetDepth,feetTypeSAMPLESNumberBlows perfootGraphic LogMATERIAL DESCRIPTIONWaterContent, %Dry Density, pctREMARKS ANDOTHER TESTS-260-265052-12-20SEAFLOOR DEPOSITSSoft, moist, brown to dark brown (7.5 YR-4/2) and dark greenish gray(5 GY-4/1), silty CLAY with sand (CL)LACUSTRINE DEPOSITSMedium stiff to stiff, moist, brown to dark brown (7.5 YR-4/2) fat CLAY(CH)5048-5347388UU(1100),LL(70), PI(42),CORR102-31310 ...1" silty sand lense-10 34-270152-415 ...contains trace evaporite nodules29-1596UU(2350)-275202-520-20 3291SA(88), LL(65),PI(42), CON-280Very stiff, moist, brown to dark brown (7.5 YR-4/2), silty fat CLAY (CH)with irregular infilled fissures of greenish gray (5 GY-6/1), fine sandyCLAY (CL). Contains pale white evaporite nodules and very smallgastropod shells28LL(67), PI(45)252-62825-25-285302-7...28.25'-30' - becomes brown (7.5 YR-5/4), fine sandy CLAY toclayey fine SAND (SC/CL)30...return to brown (7.5 YR-5/4), silty CLAY (CL)29-3098UU(1000),WA(80),SG(2.77)-29025SA(94)352-852...33'-34', brown (7.5 YR-5/4), poorly graded fine to very fine sandlense...return to CLAY (CL)3526-35SA(59)Figure A-2
Project: <strong>Salton</strong> <strong>Sea</strong> RestorationProject Location:Project Number:<strong>Salton</strong> <strong>Sea</strong>, California27663042.00002Log of BoringSheet 2 of 52Date(s) 10/7/03DrilledDrilling Tricone bit with rotary drillingMethodDrill Rig Mobile <strong>Sea</strong> 80-14TypeElevation of <strong>Sea</strong>Surface-227' below sea levelBoreholeNativeBackfillLoggedByDrill BitSize/TypeDrillingContractorSamplingMethod(s)LocationA. Greene3.25"Gregg DrillingShelby/SPT/Continuous coreN33.35660/W115.77946CheckedByA. GreeneTotal Depthof Borehole 149.3' below mudlineApproximateSurface Elevation-258.2' below sea levelHammerData 140 lbs/30" dropElevation,feetDepth,feetTypeSAMPLESNumberBlows perfootGraphic LogMATERIAL DESCRIPTIONWaterContent, %Dry Density, pctREMARKS ANDOTHER TESTS-295402-9ALLUVIAL DEPOSITSVery40dense, moist, yellowish brown (10 YR-5/4), silty fine SAND (SM)26-4096-30024SA(34)2-10634545-45-3052-1134LACUSTRINE DEPOSITSDense to hard, moist to wet, yellowish brown (10 YR-5/4) to brown(7.5 YR-5/4), fine sandy SILT to fat CLAY (SM/CH) - interbedded...48'-48.5'. silty sand lense26WA(91)5050...increasing sand becomes silty fine SAND (SM)-50-31023WA(49)552-1255-55-315602-136024-60-320Hard, moist, dark grayish brown (19 YR-4/2), fat CLAY (CH)2829...return to thinly interbedded silty fine SAND and fine sandy SILT(SM/ML) with localized lenses of fat CLAY (CH)6565-65-3252-142896UU(2100),SA(40)7070-70Figure A-2
Project: <strong>Salton</strong> <strong>Sea</strong> RestorationProject Location:Project Number:<strong>Salton</strong> <strong>Sea</strong>, California27663042.00002Log of BoringSheet 3 of 52Date(s) 10/7/03DrilledDrilling Tricone bit with rotary drillingMethodDrill Rig Mobile <strong>Sea</strong> 80-14TypeElevation of <strong>Sea</strong>Surface-227' below sea levelBoreholeNativeBackfillLoggedByDrill BitSize/TypeDrillingContractorSamplingMethod(s)LocationA. Greene3.25"Gregg DrillingShelby/SPT/Continuous coreN33.35660/W115.77946CheckedByA. GreeneTotal Depthof Borehole 149.3' below mudlineApproximateSurface Elevation-258.2' below sea levelHammerData 140 lbs/30" dropElevation,feetDepth,feetTypeSAMPLESNumberBlows perfootGraphic LogMATERIAL DESCRIPTIONWaterContent, %Dry Density, pctREMARKS ANDOTHER TESTS-3302-15Hard, moist, dark grayish brown (10 YR-4/2), lean to fat CLAY(CL/CH)243332LL(26), PI(8)75Hard to dense, moist, dark gray (10 YR-4/1), silty fine SAND gradingdownwards75to fat CLAY with trace sand (CH)-75-33527SA(97)2-16368080-80-340852-17Hard, moist, dark gray (10 YR-4/1), fat CLAY with thin interbeds oflean 85 clay with trace fine sand (CH/CL)-thinly laminated37-85-345...localized soft sediment deformation2-183192UU(1900),LL(63), PI(40)9090-90-35036SA(100)...93.25'-93.75' - fine sandy clay lense (CL)-355952-1995...95.5'-96' - fine sandy clay lense (CL)-952-203588LL(47), PI(28)100100-100-360351052-21105-105Figure A-2
Project: <strong>Salton</strong> <strong>Sea</strong> RestorationProject Location:Project Number:<strong>Salton</strong> <strong>Sea</strong>, California27663042.00002Log of BoringSheet 4 of 52Date(s) 10/7/03DrilledDrilling Tricone bit with rotary drillingMethodDrill Rig Mobile <strong>Sea</strong> 80-14TypeElevation of <strong>Sea</strong>Surface-227' below sea levelBoreholeNativeBackfillLoggedByDrill BitSize/TypeDrillingContractorSamplingMethod(s)LocationA. Greene3.25"Gregg DrillingShelby/SPT/Continuous coreN33.35660/W115.77946CheckedByA. GreeneTotal Depthof Borehole 149.3' below mudlineApproximateSurface Elevation-258.2' below sea levelHammerData 140 lbs/30" dropElevation,feetDepth,feetTypeSAMPLESNumberBlows perfootGraphic LogMATERIAL DESCRIPTIONWaterContent, %Dry Density, pctREMARKS ANDOTHER TESTS-365...becomes very dark gray (10 YR-3/1)362-228110110-110-370...thinly laminated, color variation from dark gray to dark brown (10YR-4/1 through 4/3)321152-23115...8mm offset on lamination across 0.6' zone-115-3751202-2412032-12091UU(4300),SA(100),LL(66), PI(41)-38033...fine sandy CLAY lense (CH)1252-25125...increasing lean CLAY (CL)-125-3852-262698UU(3850),LL(44), PI(23)130130-130-390135135-135-395Hard, moist, dark brown, dark brownish gray, dark gray (10 YR-4/1,4/2, 4/3, and 3/1, 3/2, 3/3), laminated fat CLAY (CH)2-27140140-140Figure A-2
Project: <strong>Salton</strong> <strong>Sea</strong> RestorationProject Location:Project Number:<strong>Salton</strong> <strong>Sea</strong>, California27663042.00002Log of BoringSheet 5 of 52Date(s) 10/7/03DrilledDrilling Tricone bit with rotary drillingMethodDrill Rig Mobile <strong>Sea</strong> 80-14TypeElevation of <strong>Sea</strong>Surface-227' below sea levelBoreholeNativeBackfillLoggedByDrill BitSize/TypeDrillingContractorSamplingMethod(s)LocationA. Greene3.25"Gregg DrillingShelby/SPT/Continuous coreN33.35660/W115.77946CheckedByA. GreeneTotal Depthof Borehole 149.3' below mudlineApproximateSurface Elevation-258.2' below sea levelHammerData 140 lbs/30" dropElevation,feetDepth,feetTypeSAMPLESNumberBlows perfootGraphic LogMATERIAL DESCRIPTIONWaterContent, %Dry Density, pctREMARKS ANDOTHER TESTS-400281452-28145-145-4052-2931 92 UU(3950),SA(100)LL(62), PI(39)-410150150Bottom of boring at 149.3 feet below mudline(180.5 feet below sea surface)-150155155-155Figure A-2
Project: <strong>Salton</strong> <strong>Sea</strong> RestorationProject Location:Project Number:<strong>Salton</strong> <strong>Sea</strong>, California27663042.00002Log of BoringSheet 1 of 24Date(s) 9/23/03DrilledDrilling Tricone bit with rotary drillingMethodDrill Rig Mobile <strong>Sea</strong> 80-14TypeElevation of <strong>Sea</strong>Surface-227' below sea levelBoreholeNativeBackfillLoggedByDrill BitSize/TypeDrillingContractorSamplingMethod(s)LocationA. Greene3.25"Gregg DrillingShelby/SPTN33.30765/W115.79666CheckedByA. GreeneTotal Depthof Borehole 52' below mudlineApproximateSurface Elevation-268' below sea levelHammerData 140 lbs/30" dropElevation,feetDepth,feetTypeSAMPLESNumberBlows perfootGraphic LogMATERIAL DESCRIPTIONWaterContent, %Dry Density, pctREMARKS ANDOTHER TESTS-27004-10SEA FLOOR DEPOSITSVery soft, wet, dark gray SILT with fine sand (ML) to silty fine SAND(SM)0No recovery withfirst Shelby push(soft sediment)4-222SA(16)55...decrease in sand, becomes very soft to soft, silty CLAY (CH)-578WA(99), UU(150)LL(74), PI(41)-275-280104-310-107382515368LL(84), PI(53),CON-285154-415-15 57605857626263CORR,LL(76), PI(43)ICU, SG(2.76)ICUICU-290204-520...increasing sand contentLACUSTRINE DEPOSITSLoose to medium dense, moist, light brown, clayey fine SAND toCLAY (SC/CH)-202896WA(62),UU(800),PINVery soft to soft, wet, light brown, fat CLAY (CH)254-6225-2557LL(79), PI(50)-295...gray, clayey SAND lense (SC)...becomes brownish gray304-7030...contains thin interbeds of clayey fine sand (1-2" thick)-3035-30035...becomes gray35-35Figure A-3
Project: <strong>Salton</strong> <strong>Sea</strong> RestorationProject Location:Project Number:<strong>Salton</strong> <strong>Sea</strong>, California27663042.00002Log of BoringSheet 2 of 24Date(s) 9/23/03DrilledDrilling Tricone bit with rotary drillingMethodDrill Rig Mobile <strong>Sea</strong> 80-14TypeElevation of <strong>Sea</strong>Surface-227' below sea levelBoreholeNativeBackfillLoggedByDrill BitSize/TypeDrillingContractorSamplingMethod(s)LocationA. Greene3.25"Gregg DrillingShelby/SPTN33.30765/W115.79666CheckedByA. GreeneTotal Depthof Borehole 52' below mudlineApproximateSurface Elevation-268' below sea levelHammerData 140 lbs/30" dropElevation,feetDepth,feetTypeSAMPLESNumberBlows perfootGraphic LogMATERIAL DESCRIPTIONWaterContent, %Dry Density, pctREMARKS ANDOTHER TESTS-3054-848545248666667LL(78), PI(46)ICUICUICU4040-40-3104-96164CON-315454-102045Stiff to very stiff, moist, brownish gray, fat CLAY wilth little fine sand(CH)-4542...becomes grayish brown with shell fragments5050-50-3204-11Bottom of boring at 52 feet below mudline(93.5' below sea surface)5271UU(450)LL(79), PI(54)5555-55Figure A-3
Project: <strong>Salton</strong> <strong>Sea</strong> RestorationProject Location:Project Number:<strong>Salton</strong> <strong>Sea</strong>, California27663042.00002Log of BoringSheet 1 of 25Date(s) 9/29/03DrilledDrilling Tricone bit with rotary drillingMethodDrill Rig Mobile <strong>Sea</strong> 80-14TypeElevation of <strong>Sea</strong>Surface-227' below sea levelBoreholeNativeBackfillLoggedByDrill BitSize/TypeDrillingContractorSamplingMethod(s)LocationA. Greene3.25"Gregg DrillingShelby/SPTN33.31832/W115.82606CheckedByA. GreeneTotal Depthof Borehole 51.25' below mudlineApproximateSurface Elevation-268' below sea levelHammerData 140 lbs/30" dropElevation,feetDepth,feetTypeSAMPLESNumberBlows perfootGraphic LogMATERIAL DESCRIPTIONWaterContent, %Dry Density, pctREMARKS ANDOTHER TESTS-27005-10SEA FLOOR DEPOSITSVery soft, wet, brownish gray, clayey SILT to SILT with trace sand(ML/MH)...increasing clay, becomes silty CLAY (CL/CH)07954LL(85), PI(54)SA(97), UU(200),PIN55-5-2755-25864CON, CORR-280105-310-105684767461535656LL(79), PI(53),CON, ICUICUICU-285155-4LACUSTRINE DEPOSITSSoft to medium stiff, moist, light brown, silty fat CLAY (CH)15-15 3532354680898474LL(78), PI(49),ICUICUICU20Medium stiff to stiff, moist, light brown, sandy CLAY (CL)20-20-2905-5...decrease in sand, becomes fat CLAY (CH)4080UU(550)-295255-61725ALLUVIAL DEPOSITSMedium dense, moist, greenish gray, poorly graded SAND to fineSAND with trace clay (SP) to clayey fine SAND (SC)-2545-300305-7030...becomes interbedded sandy CLAY (CL)LACUSTRINE DEPOSITSVery soft, moist, light brown, fat CLAY (CH)-3041SA(61)35Medium 35 dense to very stiff, wet, brownish gray, clayey fine SAND to-35Figure A-4
Project: <strong>Salton</strong> <strong>Sea</strong> RestorationProject Location:Project Number:<strong>Salton</strong> <strong>Sea</strong>, California27663042.00002Log of BoringSheet 2 of 25Date(s) 9/29/03DrilledDrilling Tricone bit with rotary drillingMethodDrill Rig Mobile <strong>Sea</strong> 80-14TypeElevation of <strong>Sea</strong>Surface-227' below sea levelBoreholeNativeBackfillLoggedByDrill BitSize/TypeDrillingContractorSamplingMethod(s)LocationA. Greene3.25"Gregg DrillingShelby/SPTN33.31832/W115.82606CheckedByA. GreeneTotal Depthof Borehole 51.25' below mudlineApproximateSurface Elevation-268' below sea levelHammerData 140 lbs/30" dropElevation,feetDepth,feetTypeSAMPLESNumberBlows perfootGraphic LogMATERIAL DESCRIPTIONWaterContent, %Dry Density, pctREMARKS ANDOTHER TESTSfine sandy CLAY (SC/CL)-3055-822102SA(57)...increasing clay405-9040Soft, wet, grayish brown, fine sandy CLAY (CL)-4045LL(35), PI(20)-310...decrease in sand, becomes silty CLAY (CL/CH)-315455-1045-4540418472UU(200),CON505-1116ALLUVIAL DEPOSITSMedium50dense, moist, grayish brown, silty fine SAND (SM)-5022WA(25)-320Bottom of boring at 51.25' below mudline(92.25' below sea surface)5555-55Figure A-4
Project: <strong>Salton</strong> <strong>Sea</strong> RestorationProject Location:Project Number:<strong>Salton</strong> <strong>Sea</strong>, California27663042.00002Log of BoringSheet 1 of 26Date(s) 9/30/03DrilledDrilling Tricone bit with rotary drillingMethodDrill Rig Mobile <strong>Sea</strong> 80-14TypeElevation of <strong>Sea</strong>Surface-227' below sea levelBoreholeNativeBackfillLoggedByDrill BitSize/TypeDrillingContractorSamplingMethod(s)LocationA. Greene3.25"Gregg DrillingShelby/SPTN33.33248/W115.85323CheckedByA. GreeneTotal Depthof Borehole 51.75' below mudlineApproximateSurface Elevation-269' below sea levelHammerData 140 lbs/30" dropElevation,feetDepth,feetTypeSAMPLESNumberBlows perfootGraphic LogMATERIAL DESCRIPTIONWaterContent, %Dry Density, pctREMARKS ANDOTHER TESTS-27006-10SEA FLOOR DEPOSITSVery soft, wet, gray, clayey SILT with trace sand (ML/MH)0...decrease in sand, becomes fat CLAY (CH)7256UU(200), PIN-27556-25-565746857555766CORRLL(60), PI(40),ICULL(83), PI(53)ICUICU-280106-310-10LACUSTRINE DEPOSITSSoft, wet, light brown, fat CLAY with trace sand (CH)3191UU(350)-285156-415-15...gray, cemented (carbonate), fine sand lense49LL(89), PI(58)SA(99), SG(2.77)-290206-50/18"20Very soft, moist to wet, light brown, fat CLAY and interbedded gray,fine sandy CLAY (CH/CL)-2041-295256-625Hard to very stiff, moist, light brown, fat CLAY (CH) with interbeddedgrayish brown to light brown, clayey SAND lense (SC)-252599SA(12), CON-300306-73430...31,25'-31.75', gray, clayey SAND lense (SC)-30363535-35Figure A-5
Project: <strong>Salton</strong> <strong>Sea</strong> RestorationProject Location:Project Number:<strong>Salton</strong> <strong>Sea</strong>, California27663042.00002Log of BoringSheet 2 of 26Date(s) 9/30/03DrilledDrilling Tricone bit with rotary drillingMethodDrill Rig Mobile <strong>Sea</strong> 80-14TypeElevation of <strong>Sea</strong>Surface-227' below sea levelBoreholeNativeBackfillLoggedByDrill BitSize/TypeDrillingContractorSamplingMethod(s)LocationA. Greene3.25"Gregg DrillingShelby/SPTN33.33248/W115.85323CheckedByA. GreeneTotal Depthof Borehole 51.75' below mudlineApproximateSurface Elevation-269' below sea levelHammerData 140 lbs/30" dropElevation,feetDepth,feetTypeSAMPLESNumberBlows perfootGraphic LogMATERIAL DESCRIPTIONWaterContent, %Dry Density, pctREMARKS ANDOTHER TESTS-3056-8...36'-37.5', grayish brown, silty fine SAND (SM)26101WA(66)22105WA(18)-310406-91240...40.25'-40.75', grayish brown, silty fine SAND (SM)-4028WA(37)...becomes light brown, fat CLAY (CH)-315456-1045-452698SA(75),UU(1700)-320506-1150/5"ALLUVIAL DEPOSITSVery dense, wet, medium brown, poorly graded fine SAND to silty fineSAND 50 (SP/SM)-5024WA(32)Bottom of boring at 51.75 feet below mudline(93.5 feet below sea surface)5555-55Figure A-5
Project: <strong>Salton</strong> <strong>Sea</strong> RestorationProject Location:Project Number:<strong>Salton</strong> <strong>Sea</strong>, California27663042.00002Log of BoringSheet 1 of 27Date(s) 9/23/03DrilledDrilling Tricone bit with rotary drillingMethodDrill Rig Mobile <strong>Sea</strong> 80-14TypeElevation of <strong>Sea</strong>Surface-227' below sea levelBoreholeNativeBackfillLoggedByDrill BitSize/TypeDrillingContractorSamplingMethod(s)LocationA. Greene3.25"Gregg DrillingShelby/SPTN33.30029 W115.85326CheckedByA. GreeneTotal Depthof Borehole 50' below mudlineApproximateSurface Elevation-259' below sea levelHammerData 140 lbs/30" dropElevation,feetDepth,feetTypeSAMPLESNumberBlows perfootGraphic LogMATERIAL DESCRIPTIONWaterContent, %Dry Density, pctREMARKS ANDOTHER TESTS-26007-10SEA FLOOR DEPOSITSVery loose, wet, brownish gray to light brown, silty fine SAND (SM)0 25102SA(14)-26557-2LACUSTRINE DEPOSITSVery soft, wet, light brown, lean to fat CLAY with trace fine sand5(CL/CH)-53489LL(71), PI(47),CON, PIN107-3ALLUVIAL DEPOSITSLoose,10wet, light brown, silty fine SAND (SM)15-10106SA(20), CORR-270...locally interbedded thin clayey SAND to fat CLAY lenses (SC-CH)-275157-415-15243110292LL(97), PI(65)WA(27), UU(900)SG(2.72), CON207-5...becomes medium dense2022-20104SA(18)-280...increasing SAND (SP-SM)257-62523-25104UU(5150)SA(9)-285-290307-730...increasing fines-3024100UU(1950)SA(62)LACUSTRINE DEPOSITSVery stiff, moist, light brown to light grayish brown, fat CLAY (CH),trace fine sand and lenses of clayey silt357-8 213524-35LL(53), PI(33)Figure A-6
Project: <strong>Salton</strong> <strong>Sea</strong> RestorationProject Location:Project Number:<strong>Salton</strong> <strong>Sea</strong>, California27663042.00002Log of BoringSheet 2 of 27Date(s) 9/23/03DrilledDrilling Tricone bit with rotary drillingMethodDrill Rig Mobile <strong>Sea</strong> 80-14TypeElevation of <strong>Sea</strong>Surface-227' below sea levelBoreholeNativeBackfillLoggedByDrill BitSize/TypeDrillingContractorSamplingMethod(s)LocationA. Greene3.25"Gregg DrillingShelby/SPTN33.30029 W115.85326CheckedByA. GreeneTotal Depthof Borehole 50' below mudlineApproximateSurface Elevation-259' below sea levelHammerData 140 lbs/30" dropElevation,feetDepth,feetTypeSAMPLESNumberBlows perfootGraphic LogMATERIAL DESCRIPTIONWaterContent, %Dry Density, pctREMARKS ANDOTHER TESTS-295-300407-92740-4025-305457-1045-4525101 SA(97), LL(66),PI(45)ALLUVIAL DEPOSITSVery dense, wet, light brown, fine SAND with trace silt (SM) containsinterbedded SILT lenses (ML)507-11835022-50WA(62)-310Bottom of boring at 50 feet below mudline(82 feet below sea surface)5555-55Figure A-6
Project: <strong>Salton</strong> <strong>Sea</strong> RestorationProject Location:Project Number:<strong>Salton</strong> <strong>Sea</strong>, California27663042.00002Log of BoringSheet 1 of 111Date(s) 10/14/03DrilledDrilling Tricone bit with rotary drillingMethodDrill Rig Mobile <strong>Sea</strong> 80-14TypeElevation of <strong>Sea</strong>Surface-227' below sea levelBoreholeNativeBackfillLoggedByDrill BitSize/TypeDrillingContractorSamplingMethod(s)LocationA. Greene3.25"Gregg DrillingShelby/SPTN33.17413 W115.79263CheckedByA. GreeneTotal Depthof Borehole 31' below mudlineApproximateSurface Elevation-243' below sea levelHammerData 140 lbs/30" dropElevation,feetDepth,feetTypeSAMPLESNumberBlows perfootGraphic LogMATERIAL DESCRIPTIONWaterContent, %Dry Density, pctREMARKS ANDOTHER TESTS-2450511-111-20SEA FLOOR DEPOSITSVery loose, wet, dark gray (5 Y-4/1), silty SAND with abundant shellfragments (SM)LACUSTRINE DEPOSITSLoose, wet, brown (10 YR-5/3), silty fine to very fine SAND (SM)decrease in shell fragments5...decrease in fines0-52797SA(32), SG(2.68)-25011-3ALLUVIAL DEPOSITSMedium dense, wet, grayish brown (25 Y-5/2), poorly graded fineSAND (SP) and interbedded silty fine SAND (SM)21WA(14)1011-427...becomes brown (10 YR-5/3)10...return to poorly graded fine sand-1023SA(45)-2551511-5661519-15SA(10)-260-2652011-637LACUSTRINE 20DEPOSITSHard, moist, brown (10 YR-5/4) to yellowish brown (10 YR-6/4), leanCLAY (CL) to fine sandy SILT (ML)...increasing fines-20 3319WA(91)LL(21), PI(4)2511-7Hard, moist, brown (10 YR-5/3), fat CLAY with trace fine sand (CH)25-255072UU(700), PIN-270...becomes gray (5 Y-5/1), lean clay3011-8ALLUVIAL30DEPOSITSMedium dense, wet, brown (10 YR-5/3), silty fine SAND (SM)-3024101WA(38)-275Bottom of boring at 31 feet below mudline(47 feet below sea surface)3535-35Figure A-7
Project: <strong>Salton</strong> <strong>Sea</strong> RestorationProject Location:Project Number:<strong>Salton</strong> <strong>Sea</strong>, California27663042.00002Log of BoringSheet 1 of 214Date(s) 10/10/03DrilledDrilling Tricone bit with rotary drillingMethodDrill Rig Mobile <strong>Sea</strong> 80-14TypeElevation of <strong>Sea</strong>Surface-227' below sea levelBoreholeNativeBackfillLoggedByDrill BitSize/TypeDrillingContractorSamplingMethod(s)LocationA. Greene3.25"Gregg DrillingShelby/SPTN33.20150/W115.66085CheckedByA. GreeneTotal Depthof Borehole 51.5' below mudlineApproximateSurface Elevation-250' below sea levelHammerData 140 lbs/30" dropElevation,feetDepth,feetTypeSAMPLESNumberBlows perfootGraphic LogMATERIAL DESCRIPTIONWaterContent, %Dry Density, pctREMARKS ANDOTHER TESTS-250014-10LACUSTRINE DEPOSITSVery soft to wet, brown to dark brown (7.5 YR-4/2) to 10 YR-4/3), leanSILT with trace fine sand (ML) to lean CLAY (CL)03373SA(93)-255514-25-539308390LL(32), PI(12)UU(200), CON,PIN-2601014-3ALLUVIAL DEPOSITSSoft10to loose, wet, brown to dark brown (7.5 YR-4/4), silty very fineSAND (SM) to SILT with fine sand (ML)-102895SA(54)-265-270152014-414-51615LACUSTRINE DEPOSITSSoft to medium stiff, wet, brown (7.5 YR-4/2), lean CLAY with tracesand (CL)...decrease in sand, becomes interbedded lean clay with thin layers offine sandy silt to silty fine sand20...20.5'-21', silty fine sand lense (SM)-1535-20 3584LL(36), PI(19)UU(300),SG(2.73)WA(95)ALLUVIAL DEPOSITSMedium dense, wet, brown (7.5 YR-4/2), silty fine to very fine SAND(SM) with interbedded layers of SILT with fine sand (ML)-2752514-625-2514-6a1422WA(30)-2803014-71330-30 28SA(54)-2853514-81435-35 26WA(54)Figure A-8
Project: <strong>Salton</strong> <strong>Sea</strong> RestorationProject Location:Project Number:<strong>Salton</strong> <strong>Sea</strong>, California27663042.00002Log of BoringSheet 2 of 214Date(s) 10/10/03DrilledDrilling Tricone bit with rotary drillingMethodDrill Rig Mobile <strong>Sea</strong> 80-14TypeElevation of <strong>Sea</strong>Surface-227' below sea levelBoreholeNativeBackfillLoggedByDrill BitSize/TypeDrillingContractorSamplingMethod(s)LocationA. Greene3.25"Gregg DrillingShelby/SPTN33.20150/W115.66085CheckedByA. GreeneTotal Depthof Borehole 51.5' below mudlineApproximateSurface Elevation-250' below sea levelHammerData 140 lbs/30" dropElevation,feetDepth,feetTypeSAMPLESNumberBlows perfootGraphic LogMATERIAL DESCRIPTIONWaterContent, %Dry Density, pctREMARKS ANDOTHER TESTS-290 4014-940-40 27WA(29)-2954514-10LACUSTRINE DEPOSITSVery45stiff, moist, brown (7.5 YR-4/2), fat CLAY (CH)-45 41LL(65), PI(42)-3005014-11Medium dense, moist, brown (7.5-4/2), silty fine SAND (SM)50-5026 97SA(41)Bottom of boring at 51.5 feet below mudline(75 feet below sea surface)-3055555-55Figure A-8
Project: <strong>Salton</strong> <strong>Sea</strong> RestorationProject Location:Project Number:<strong>Salton</strong> <strong>Sea</strong>, California27663042.00002Log of BoringSheet 1 of 117Date(s) 10/2/03DrilledDrilling Tricone bit with rotary drillingMethodDrill Rig Mobile <strong>Sea</strong> 80-14TypeElevation of <strong>Sea</strong>Surface-227' below sea levelBoreholeNativeBackfillLoggedByDrill BitSize/TypeDrillingContractorSamplingMethod(s)LocationA. Greene3.25"Gregg DrillingShelby/SPTN33.30338 W115.64420CheckedByA. GreeneTotal Depthof Borehole 30.5' below mudlineApproximateSurface Elevation-244' below sea levelHammerData 140 lbs/30" dropElevation,feetDepth,feetTypeSAMPLESNumberBlows perfootGraphic LogMATERIAL DESCRIPTIONWaterContent, %Dry Density, pctREMARKS ANDOTHER TESTS-245017-10SEA FLOOR DEPOSITSVery soft, wet, gray, lean SILT to fat CLAY with fine sand (ML/CH)09847LL(72), PI(44)UU(100)17-2-25055LACUSTRINE DEPOSITSSoft to medium stiff, moist, light brown, fat CLAY (CH)-533458978LL(71), PI(47)CON, PIN17-3...becomes stiff-2551010-103587UU(1050)LL(66), PI(40)17-410331515-15-2602017-52032-2089LL(62), PI(38)SA(99), SG(2.77)-26517-614302525-25-2703017-73029-3096UU(2550)LL(75), PI(51)-275Bottom of boring at 30.5 feet below mudline(47.5 feet below sea surface)Figure A-9
Project: <strong>Salton</strong> <strong>Sea</strong> RestorationProject Location:Project Number:<strong>Salton</strong> <strong>Sea</strong>, California27663042.00002Log of BoringSheet 1 of 219Date(s) 10/16/03DrilledDrilling Tricone bit with rotary drillingMethodDrill Rig Mobile <strong>Sea</strong> 80-14TypeElevation of <strong>Sea</strong>Surface-227' below sea levelBoreholeNativeBackfillLoggedByDrill BitSize/TypeDrillingContractorSamplingMethod(s)LocationA. Greene3.25"Gregg DrillingShelby/SPTN33.40553 W115.91742CheckedByA. GreeneTotal Depthof Borehole 51.5' below mudlineApproximateSurface Elevation-275' below sea levelHammerData 140 lbs/30" dropElevation,feetDepth,feetTypeSAMPLESNumberBlows perfootGraphic LogMATERIAL DESCRIPTIONWaterContent, %Dry Density, pctREMARKS ANDOTHER TESTS-270019-10SEA FLOOR DEPOSITSVery soft, moist to wet, dark blue gray (5 B-4/1), lean SILT with tracesand (ML) - contains localized gypsum nodules along sea floor08352CON-275519-25...becomes dark greenish gray (5 GY-4/1), silty CLAY to clayey SILT(ML/CL)-56660UU(150),LL(82), PI(52)1019-3LACUSTRINE DEPOSITSVery10soft to loose, moist, dark grayish brown (2.5 YR-4/2), fat CLAY toclayey fine SAND (CH/SC)-103785SA(97)-280Very soft, moist, greenish gray (5 GY-6/1 - 5GY-5/1), fat CLAY (CH)1519-415-15 54LL(50), PI(25)-285-2902019-520...becomes mottled dark grayish brown (10 YR-4/2) to dark greenishgray (5 GY-4/1)-2033872519-62ALLUVIAL DEPOSITSMedium25dense, wet, dark grayish brown (10 YR-4/2), silty fine SANDto fine SAND (SM)-25-295LACUSTRINE DEPOSITSMedium stiff, moist, dark greenish gray (5 GY-4/1), fat CLAY with finesand (CH)3019-7030-3036WA(94)-300...becomes brown (7.5 YR-5/4)3535-35Figure A-10
Project: <strong>Salton</strong> <strong>Sea</strong> RestorationProject Location:Project Number:<strong>Salton</strong> <strong>Sea</strong>, California27663042.00002Log of BoringSheet 2 of 219Date(s) 10/16/03DrilledDrilling Tricone bit with rotary drillingMethodDrill Rig Mobile <strong>Sea</strong> 80-14TypeElevation of <strong>Sea</strong>Surface-227' below sea levelBoreholeNativeBackfillLoggedByDrill BitSize/TypeDrillingContractorSamplingMethod(s)LocationA. Greene3.25"Gregg DrillingShelby/SPTN33.40553 W115.91742CheckedByA. GreeneTotal Depthof Borehole 51.5' below mudlineApproximateSurface Elevation-275' below sea levelHammerData 140 lbs/30" dropElevation,feetDepth,feetTypeSAMPLESNumberBlows perfootGraphic LogMATERIAL DESCRIPTIONWaterContent, %Dry Density, pctREMARKS ANDOTHER TESTS-30519-83885UU(900)4019-940-4040-3104519-102045 ...becomes mottled grayish brown (10 YR-5/2) to brown (7.5 YR-5/4)-454378UU(700)-3155019-1150-503783-320Bottom of boring at 51.5 feet below mudline(99.75' below sea surface)Figure A-10
Project: <strong>Salton</strong> <strong>Sea</strong> RestorationProject Location:Project Number:<strong>Salton</strong> <strong>Sea</strong>, California27663042.00002Log of BoringSheet 1 of 120Date(s) 10/17/03DrilledDrilling Tricone bit with rotary drillingMethodDrill Rig Mobile <strong>Sea</strong> 80-14TypeElevation of <strong>Sea</strong>Surface-227' below sea levelBoreholeNativeBackfillLoggedByDrill BitSize/TypeDrillingContractorSamplingMethod(s)LocationA. Greene3.25"Gregg DrillingShelby/SPTN33.49624 W116.02119CheckedByA. GreeneTotal Depthof Borehole 32' below mudlineApproximateSurface Elevation-254' below sea levelHammerData 140 lbs/30" dropElevation,feetDepth,feetTypeSAMPLESNumberBlows perfootGraphic LogMATERIAL DESCRIPTIONWaterContent, %Dry Density, pctREMARKS ANDOTHER TESTS-255020-10SEA FLOOR DEPOSITSVery soft, moist to wet, gray (5 Y-5/1), lean to fat CLAY with sand(CL/CH)05868-260520-2LACUSTRINE DEPOSITS5Stiff, moist, brown (10 YR-5/3), fat CLAY (CH)-53785LL(70), PI(44)SA(97),UU(1050)-2651020-344ALLUVIAL DEPOSITSDense,10wet, olive gray (5 Y-4/2), silty fine SAND (SM)-1016-2701520-412LACUSTRINE DEPOSITSStiff, moist, brown (10 YR-5/3), fat CLAY (CH) - contains smallbrachiopod 15 shells-1536-2752020-5...increase in sand20-203488UU(600)-2802520-632ALLUVIAL DEPOSITSDense, moist, olive gray (5 Y-4/2), fine to very fine SAND with silt tosilty 25 fine SAND (SM)-2527...decrease in fines-2853020-730...becomes poorly graded fine to very fine SAND (SP)-302798SA(34)Bottom of boring at 32 feet below mudline (59 feet below sea surface)3535-35Figure A-11
Project: <strong>Salton</strong> <strong>Sea</strong> RestorationProject Location:Project Number:<strong>Salton</strong> <strong>Sea</strong>, California27663042.00002Log of BoringSheet 1 of 226Date(s) 10/20/03DrilledDrilling Tricone bit with rotary drillingMethodDrill Rig Mobile <strong>Sea</strong> 80-14TypeElevation of <strong>Sea</strong>Surface-227' below sea levelBoreholeNativeBackfillLoggedByDrill BitSize/TypeDrillingContractorSamplingMethod(s)LocationA. Greene3.25"Gregg DrillingShelby/SPTN33.33562/W115.79995CheckedByA. GreeneTotal Depthof Borehole 51.75' below mudlineApproximateSurface Elevation-267' below sea levelHammerData 140 lbs/30" dropElevation,feetDepth,feetTypeSAMPLESNumberBlows perfootGraphic LogMATERIAL DESCRIPTIONWaterContent, %Dry Density, pctREMARKS ANDOTHER TESTS-280026-10SEA FLOOR DEPOSITSVery soft, wet, very dark gray (5 Y-3/1), SILT with fine sand (ML)strong organic odorVery soft, moist, gray (5 Y-6/1), lean SILT (ML) to fat CLAY (CH)07954CON526-25-5737556LL(83), PI(53)SA(99), ICU-2851026-310...becomes dark gray (10 YR-4/1)-1066586165ICUICU-2901526-415LACUSTRINE DEPOSITSVery soft to stiff, moist to wet, brown to dark brown (10 YR-4/3), leanCLAY (CL)-154280LL(32), PI(16),CON-2952026-50Very soft, moist, brown to dark brown (10 YR-4/2), fat CLAY (CH)20-2040-3002526-625-256561LL(80), PI(50)-3053026-7030-3049-3103526-835 ...becomes dark greenish gray (5 GY-4/1)-35Figure A-12
Project: <strong>Salton</strong> <strong>Sea</strong> RestorationProject Location:Project Number:<strong>Salton</strong> <strong>Sea</strong>, California27663042.00002Log of BoringSheet 2 of 226Date(s) 10/20/03DrilledDrilling Tricone bit with rotary drillingMethodDrill Rig Mobile <strong>Sea</strong> 80-14TypeElevation of <strong>Sea</strong>Surface-227' below sea levelBoreholeNativeBackfillLoggedByDrill BitSize/TypeDrillingContractorSamplingMethod(s)LocationA. Greene3.25"Gregg DrillingShelby/SPTN33.33562/W115.79995CheckedByA. GreeneTotal Depthof Borehole 51.75' below mudlineApproximateSurface Elevation-267' below sea levelHammerData 140 lbs/30" dropElevation,feetDepth,feetTypeSAMPLESNumberBlows perfootGraphic LogMATERIAL DESCRIPTIONWaterContent, %Dry Density, pctREMARKS ANDOTHER TESTS-3154026-9ALLUVIAL DEPOSITSLoose40to medium dense, moist, grayish brown (10 YR-5/2),interbedded clayey fine SAND to fat CLAY (SC/CH)-40SA(95)-3204526-1010LACUSTRINE DEPOSITSStiff,45moist, grayish brown (10 YR-5/2), fat CLAY (CH)-4535-325Stiff to medium dense, moist, gray (5 Y-6/1), fine sandy CLAY to fatCLAY (CL/CH)5026-1150-5035 85WA(97),UU(1750)-330Bottom of boring at 51.75 feet below mudline(102 feet below sea surface)5555-55Figure A-12
APPENDIXB<strong>In</strong>-<strong>Sea</strong> Cone Penetration TestingW:\27663042\00005-c-r.doc\1-Mar-04\SDG
APPENDIXB<strong>In</strong>-<strong>Sea</strong> Cone Penetration TestingGregg <strong>In</strong>-Situ of Signal Hill, California conducted Cone Penetration Tests (CPT) soundings with porepressure measurements. Figure 2 shows the approximate locations of the CPTs. The CPTs were advancedto depths ranging from about 30 to 65 feet below the existing mudline. Table 1 summarizes their locationsand sounding depths.The soundings were conducted using a 20-ton capacity cone with a tip area of 15 cm 2 and a friction sleevearea of 225 cm 2 . The cone is designed with an equal end area friction sleeve and a tip end area ratio of0.85. The cone takes measurements of cone bearing, sleeve friction, and dynamic pore water pressure at2.5-cm intervals during penetration to provide a nearly continuous geologic log. The CPT soundings areperformed in accordance with ASTM standards (D 5778-95). The CPT used the tophead of the drill rig toprovide thrust. When required, flush-joint support casing was set into the mud line to increase the stabilityof the rods and to avoid buckling of the rods. A photograph of the cone is shown in Figure 5.Measurements of resistance encountered during sounding evaluate the variation of material types,engineering properties, and liquefaction potential of soils. Soil behavior type (SBT) and stratigraphicinterpretation is based on relationships between cone bearing, sleeve friction, and pore water pressure.The friction ratio is a calculated parameter (defined by as sleeve friction divided by cone bearing) and isused to infer soil behavior type. This appendix provides the results of the CPT soundings graphically andin tabular form, along with stratigraphic and parameter interpretations processed by Gregg <strong>In</strong>-Situ. Twosets of plots are provided. The first set is a plot of tip resistance (q t ), sleeve friction (F s ), recorded dynamicpore pressure (referred to as u 2 or U d and shown as U on the plots) friction ratio (R f ) and interpreted soilbehavior type (SBT). The second set is a plot of q t , normalized tip resistance (Q t ), normalized frictionratio (RF, shown as R f on the plot), interpreted normalized Standard Penetration Blow Count (SPT N 160 )and normalized Soil Behavior Type (SBT n ). A graphical comparison of CPTs performed adjacent toborings is presented in Figures 14 and 15.W:\27663042\00005-c-r.doc\1-Mar-04\SDG B-1
Depth (ft)0-10-20-30-40-50-60qt (tsf)0 360fs (tsf)0.0 5.5U (psi)0 250Rf (%)0 10SBT0 12
Depth (ft)0-10-20-30-40-50-60qt (tsf)0 360Qt (tsf)0 100Rf (%)0 10SPT N1(60)0 100SBTn0 12
Depth (ft)0-10-20-30-40-50-60qt (tsf)0 360fs (tsf)0.0 5.5U (psi)0 250Rf (%)0 10SBT0 12
Depth (ft)0-10-20-30-40-50-60qt (tsf)0 360Qt (tsf)0 100Rf (%)0 10SPT N1(60)0 100SBTn0 12
Depth (ft)0-10-20-30-40-50-60qt (tsf)0 360fs (tsf)0.0 5.5U (psi)0 250Rf (%)0 10SBT0 12
Depth (ft)0-10-20-30-40-50-60qt (tsf)0 360Qt (tsf)0 100Rf (%)0 10SPT N1(60)0 100SBTn0 12
Depth (ft)0-10-20-30-40-50-60qt (tsf)0 360fs (tsf)0.0 5.5U (psi)0 250Rf (%)0 10SBT0 12
Depth (ft)0-10-20-30-40-50-60qt (tsf)0 360Qt (tsf)0 100Rf (%)0 10SPT N1(60)0 100SBTn0 12
Depth (ft)0-10-20-30-40-50-60qt (tsf)0 360fs (tsf)0.0 5.5U (psi)0 250Rf (%)0 10SBT0 12
Depth (ft)0-10-20-30-40-50-60qt (tsf)0 360Qt (tsf)0 100Rf (%)0 10SPT N1(60)0 100SBTn0 12
Depth (ft)0-10-20-30-40-50-60qt (tsf)0 360fs (tsf)0.0 5.5U (psi)0 250Rf (%)0 10SBT0 12
Depth (ft)0-10-20-30-40-50-60qt (tsf)0 360Qt (tsf)0 100Rf (%)0 10SPT N1(60)0 100SBTn0 12
Depth (ft)0-10-20-30-40-50-60qt (tsf)0 360fs (tsf)0.0 5.5U (psi)0 250Rf (%)0 10SBT0 12
Depth (ft)0-10-20-30-40-50-60qt (tsf)0 360Qt (tsf)0 100Rf (%)0 10SPT N1(60)0 100SBTn0 12
Depth (ft)0-10-20-30-40-50-60qt (tsf)0 360fs (tsf)0.0 5.5U (psi)0 250Rf (%)0 10SBT0 12
Depth (ft)0-10-20-30-40-50-60qt (tsf)0 360Qt (tsf)0 100Rf (%)0 10SPT N1(60)0 100SBTn0 12
Depth (ft)0-10-20-30-40-50-60qt (tsf)0 360fs (tsf)0.0 5.5U (psi)0 250Rf (%)0 10SBT0 12
Depth (ft)0-10-20-30-40-50-60qt (tsf)0 360Qt (tsf)0 100Rf (%)0 10SPT N1(60)0 100SBTn0 12
Depth (ft)0-10-20-30-40-50-60qt (tsf)0 360fs (tsf)0.0 5.5U (psi)0 250Rf (%)0 10SBT0 12
Depth (ft)0-10-20-30-40-50-60qt (tsf)0 360Qt (tsf)0 100Rf (%)0 10SPT N1(60)0 100SBTn0 12
Depth (ft)0-10-20-30-40-50-60qt (tsf)0 360fs (tsf)0.0 5.5U (psi)0 250Rf (%)0 10SBT0 12
Depth (ft)0-10-20-30-40-50-60qt (tsf)0 360Qt (tsf)0 100Rf (%)0 10SPT N1(60)0 100SBTn0 12
Depth (ft)0-10-20-30-40-50-60qt (tsf)0 360fs (tsf)0.0 5.5U (psi)0 250Rf (%)0 10SBT0 12
Depth (ft)0-10-20-30-40-50-60qt (tsf)0 360fs (tsf)0.0 5.5U (psi)0 250Rf (%)0 10SBT0 12
Depth (ft)0-10-20-30-40-50-60qt (tsf)0 360fs (tsf)0.0 5.5U (psi)0 250Rf (%)0 10SBT0 12
Depth (ft)0-10-20-30-40-50-60qt (tsf)0 360Qt (tsf)0 100Rf (%)0 10SPT N1(60)0 100SBTn0 12
Depth (ft)0-10-20-30-40-50-60qt (tsf)0 360fs (tsf)0.0 5.5U (psi)0 250Rf (%)0 10SBT0 12
Depth (ft)0-10-20-30-40-50-60qt (tsf)0 360Qt (tsf)0 100Rf (%)0 10SPT N1(60)0 100SBTn0 12
Depth (ft)0-10-20-30-40-50-60qt (tsf)0 360fs (tsf)0.0 5.5U (psi)0 250Rf (%)0 10SBT0 12
Depth (ft)0-10-20-30-40-50-60qt (tsf)0 360Qt (tsf)0 100Rf (%)0 10SPT N1(60)0 100SBTn0 12
Depth (ft)0-10-20-30-40-50-60qt (tsf)0 360fs (tsf)0.0 5.5U (psi)0 250Rf (%)0 10SBT0 12
Depth (ft)0-10-20-30-40-50-60qt (tsf)0 360Qt (tsf)0 100Rf (%)0 10SPT N1(60)0 100SBTn0 12
Depth (ft)0-10-20-30-40-50-60qt (tsf)0 360fs (tsf)0.0 5.5U (psi)0 250Rf (%)0 10SBT0 12
Depth (ft)0-10-20-30-40-50-60qt (tsf)0 360Qt (tsf)0 100Rf (%)0 10SPT N1(60)0 100SBTn0 12
APPENDIXCLaboratory TestingW:\27663042\00005-c-r.doc\1-Mar-04\SDG
APPENDIXCLaboratory TestingSamples obtained from the borings were transported to a URS geotechnical laboratory for furtherexamination and testing. The primary purposes of the laboratory testing were to evaluate physical andengineering characteristics, reconcile field descriptions with more accurate laboratory assessments, andconfirm CPT soil behavior correlations. Photographs of samples obtained from the various strataidentified in the investigation are presented in Figures C-1 through C-6.The laboratory tests were performed on representative soil samples in general accordance with testmethods of the American Society for Testing and Materials (ASTM) and included the following:• Water content and dry density (ASTM D2216); the test results are presented on the boring logs at thecorresponding sample depth and summarized in Figures 16 through 19, following the report text.Water content data is also plotted versus depth for each boring and presented on Figures C-7 throughC-17.• Particle size distribution (ASTM D422); the test results are plotted as gradation curves on FiguresC-18 through C-56 and the percentage of fines passing a Standard No. 200 sieve (denoted by SA orWA) are presented on the boring logs at the corresponding sample depth.• Atterberg Limits (ASTM D4318-95a); the test results are presented on the boring logs. A PlasticityChart is present as Figure 20, following the report text. The limits are also shown in Figures C-7through C-17.• A suite of tests were performed to evaluate the corrosivity of the soils. The results of these tests arepresented in Table C-1.• Pinhole Dispersion Analyses (ASTM D-4647); the test results are summarized in Table C-2.• Specific Gravity Tests (ASTM D-854); the test results are summarized in Table 3.• One-dimensional consolidation tests (ASTM D2435-96); the test results are presented on FiguresC-57 through C-72.• Unconsolidated Undrained Compression (ASTM D-2850); the test results are presented on the boringlogs at the corresponding sample depth and as plots of peak deviator stress versus axial strain aspresented on Figures C-73 through C-105. Plots of undrained shear strength versus effective stress arepresented as Figure 22, following the report text.• Consolidated Undrained Triaxial Compression (ASTM D-4767)); the test results are presented onFigures C-106 through C-126 as: a) plots of Mohr Circles at Peak Deviator Stress, b) plots of p’–q,and c) plots of Deviator Stress, Changes in Pore Pressure and Obliquity versus Axial Stress. Sketchesof the failure of the tested specimens are presented in Figures C-127 through C-133. A summary ofdata obtained from the ICU tests are presented in Table C-3. The pore pressures during the tests weremeasured at the bottom of the specimen.W:\27663042\00005-c-r.doc\1-Mar-04\SDG C-1
APPENDIXCLaboratory TestingTable C-1Summary of Corrosivity Test Data<strong>Salton</strong> <strong>Sea</strong> Restoration ProjectBoring 2 4 5 6 7Sample No. 2 4 2 2 3Depth (feet) 6.5 16.0 7.0 6.3 10.0Resistivity:unitsas-received ohm-cm 130 41 30 43 109saturated ohm-cm 100 35 30 43 105pH 8.3 7.7 7.7 8.0 7.6Electrical Conductivity mS/cm 8.30 24.00 23.30 24.20 4.60Chemical Analyses:Cations:calcium Ca 2+ mg/kg 3,327 1,751 2,926 1,972 1,299magnesium Mg 2+ mg/kg 180 199 540 243 182sodium Na 1+ mg/kg 7,286 28,233 39,702 28,541 4,212Anions:carbonate CO3 2- mg/kg ND ND 12 ND NDbicarbonate HCO3 1- mg/kg 195 488 143 427 116chloride Cl 1- mg/kg 7,198 39,438 48,990 36,429 5,163sulfate SO4 2- mg/kg 13,999 10,151 25,582 15,621 5,545Notes:a. Electrical conductivity in millisiemens/cm and chemical analysis were made on 1:5 soil-to-water extract.b. mg/kg = milligrams per kilogram (parts per million) of dry soil.c. ND = not detected.W:\27663042\00005-c-r.doc\1-Mar-04\SDG C-2
APPENDIXCLaboratory TestingTable C-2Summary of Pinhole Dispersion Test Data<strong>Salton</strong> <strong>Sea</strong> Restoration ProjectBoring Sample No. Depth Soil USCS Dispersion Dispersion(feet) Deposits Classification a Characteristic aB4 5 21.2 Soft Lacustrine Deposit SC/CH ND3 Moderate to SlightB5 1 1.5 <strong>Sea</strong>floor Deposit ML/MH ND3 Moderate to SlightB6 1 2.5 <strong>Sea</strong>floor Deposit ML/MH ND4 Moderate to SlightB7 2 4.2 Soft Lacustrine Deposit CL/CH ND3 Moderate to SlightB11 7 25.4 Soft Lacustrine Deposit CH ND2 NondispersiveB14 2 6.3 Soft Lacustrine Deposit ML/CL ND3 Moderate to SlightB17 2 5.5 <strong>Sea</strong>floor Deposit ML/CH ND4 Moderate to SlightNotes:a. Evaluated by criteria for Method A,ASTM D4647.W:\27663042\00005-c-r.doc\1-Mar-04\SDG C-3
APPENDIXCLaboratory TestingTable C-3Summary of Consolidated Undrained Triaxial Test Data<strong>Salton</strong> <strong>Sea</strong> Restoration ProjectExplorationNumberWater Content (%) Total Density (pcf) At End of Consolidation StrainAt Peak Deviator StressTriaxialSampleRateSampleUnified SoilConfiningDepthStrataAfterAfterAxial Volumetric B during AxialNumber ClassificationPressure<strong>In</strong>itially Consolidatioidation(%) (%) (%) (%/hr) (%)<strong>In</strong>itially Consol-Strain Strain Factor b(σ'1 + σ'3)/2 (σ'1- σ'3)/2 A(ft)Shear Strain(psf)(psf) (psf) Factor c4a 15.5 CH 60 57 100 103 860 1.8 7.1 98.0 0.3 4.1 731 385 0.673B-4 4b 16.0 CH <strong>Sea</strong>floor Deposit58 41 98 113 2,220 6.6 24.1 100.0 0.3 8.6 1,462 842 0.9494c 16.5 CH 57 32 99 121 4,490 9.7 31.1 100.0 0.3 8.9 3,009 1,598 0.9648a 35.3 CH 54 48 101 106 1,680 4.5 12.2 98.0 0.5 5.2 1,270 679 0.805B-4 8b 35.8 CH Soft Lacustrine Deposit 52 41 100 110 4,940 3.8 18.4 100.0 0.5 8.2 3,310 1,352 1.1038c 36.4 CH 48 46 99 98 9,850 11.8 13.5 100.0 0.3 8.7 12,537 1,651 -0.3143a 10.5 CH 84 67 98 101 530 4.5 12.2 100.0 0.3 4.9 474 287 0.602B-53b 11.0 CH <strong>Sea</strong>floor Deposit76 60 99 104 1,380 6.6 13.4 90.0 0.3 5.3 1,226 549 0.6433c 11.5 CH 74 52 98 107 3,010 8.9 20.4 96.1 0.3 2.2 2,576 1,021 0.7124a 15.0 CH 32 28 117 124 710 2.6 8.0 96.0 0.3 17.3 902 570 0.328B-54b d 15.9 CH Soft Lacustrine Deposit 35 38 113 118 2,250 1.8 2.5 96.0 0.3 17.9 4,362 2,461 0.0704c 16.4 CH 46 39 108 115 4,460 4.2 10.3 96.0 0.2 9.7 3,388 1,674 0.8212a 6.5 CH 74 57 96 103 850 3.7 16.3 100.0 0.3 7.8 758 326 0.640B-6 2b 7.1 CH <strong>Sea</strong>floor Deposit68 48 95 110 1,510 7.8 23.6 96.0 0.3 9.1 916 513 1.0662c 7.6 CH 57 42 103 113 3,020 7.0 17.7 95.0 0.3 11.1 2,012 1,120 0.9394a 16.0 CH 47 NA 105 NA 1,180 2.8 6.3 98.0 0.6 11.1 1,086 611 0.577B-6 4b 16.5 CH Soft Lacustrine Deposit 47 NA 106 NA 2,940 4.8 10.2 98.0 0.6 11.1 2,047 1,313 0.8394c 17.0 CH 47 NA 106 NA 5,880 8.9 16.0 94.1 0.6 11.0 3,064 1,495 1.4402a 5.3 CH 86 74 99 100 560 4.0 8.3 96.1 0.2 3.2 460 230 0.721B-263b 10.0 CH <strong>Sea</strong>floor Deposit66 48 101 109 1,470 6.7 17.8 94.5 0.2 10.2 888 499 1.0823c 10.6 CH 58 41 103 112 2,940 6.6 19.0 96.3 0.3 6.7 1,824 945 1.089Notes:a. Expressed as a percentage of dry weight.b. B Factor is the ratio of the change in pore pressure to the change in isotropic stress (∆u/∆σ).c. A Factor is the ratio of the change in pore pressure to the change in major principal stress (∆u/∆σ 1 ).d. The upper part of specimen from B-5-4b included a clayey sand and was not considered in the strength envelope.e. σ'1 and σ'3 denote major and minor principal stressess, respectively.W:\27663042\00005-c-r.doc\1-Mar-04\SDG C-4
SAMPLE PHOTOGRAPHSSEAFLOOR DEPOSITSSALTON SEA RESTORATION PROJECTCHECKED BY: AJG DATE: 01-30-03 FIG. NO.PM: LDH PROJ. NO.: 27663042.00005 C-1sample pics figs
SAMPLE PHOTOGRAPHSSOFT LACUSTRINE DEPOSITSSALTON SEA RESTORATION PROJECTSAMPLE PHOTOGRAPHSSOFT LACUSTRINE DEPOSITSSALTON SEA RESTORATION PROJECTCHECKED BY: AJG DATE: 01-30-03CHECKED BY: AJG DATE: 01-30-03 FIG. FIG. NO. NO.PM: LDH PROJ. PM: NO.: LDH PROJ. 27663042.00005 C-2NO.: 27663042.00005 C-2sample pics figs
SAMPLE PHOTOGRAPHSUPPER ALLUVIAL DEPOSITSSALTON SEA RESTORATION PROJECTCHECKED BY: AJG DATE: 01-30-03 FIG. NO.PM: LDH PROJ. NO.: 27663042.00005 C-3sample pics figs
SAMPLE PHOTOGRAPHSUPPER STIFF LACUSTRINE DEPOSITSSALTON SEA RESTORATION PROJECTSAMPLE PHOTOGRAPHSUPPER STIFF LACUSTRINE DEPOSITSSALTON SEA RESTORATION PROJECTCHECKED BY:CHECKEDAJG DATE:BY: AJG01-30-03DATE: 01-30-03 FIG. FIG. NO. NO.PM: LDH PROJ. PM: LDH NO.: PROJ. 27663042.00005 C-4NO.: 27663042.00005 C-4sample pics figs
SAMPLE PHOTOGRAPHSLOWER ALLUVIAL DEPOSITSSALTON SEA RESTORATION PROJECTSAMPLE PHOTOGRAPHSLOWER ALLUVIAL DEPOSITSSALTON SEA RESTORATION PROJECTCHECKED BY: AJG DATE: 01-30-03CHECKED BY: AJG DATE: 01-30-03 FIG. NO.FIG. NO.PM: LDH PROJ. PM: LDH NO.: PROJ. 27663042.00005 C-5NO.: 27663042.00005 C-5sample pics figs
SAMPLE PHOTOGRAPHSLOWER STIFF LACUSTRINE DEPOSITSSALTON SEA RESTORATION PROJECTSAMPLE PHOTOGRAPHSLOWER STIFF LACUSTRINE DEPOSITSSALTON SEA RESTORATION PROJECTCHECKED BY: AJG DATE: 01-30-03CHECKED BY: AJG DATE: 01-30-03 FIG. FIG. NO. NO.PM: LDH PROJ. PM: LDH NO.: PROJ. 27663042.00005 C-6NO.: 27663042.00005 C-6sample pics figs
01020Water Content (percent of dry weight)0 5 10 15 20 25 30 35 40 45 50 55 60 65 70 75 80 85<strong>Sea</strong>floor DepositSoft Lacustrine DepositStiff Lacustrine Deposit3040Alluvial Deposit50Stiff Lacustrine DepositDepth Below <strong>Sea</strong> Floor (feet)60708090100.110120130140150Legend160PlasticLimitNaturalWaterContentLiquidLimitProject Name: Restoration ProjectLocation: <strong>Salton</strong> <strong>Sea</strong>Project Number: 27663042Water Content and Plasticity <strong>In</strong>dicesvs. Depth(Boring 2)Figure No.C-7Atterberg_Limits_4
00 5 10 15 20 25 30 35 40 45 50 55 60 65 70 75 80 85<strong>Sea</strong>floor DepositWater Content (percent of dry weight)51015Depth Below <strong>Sea</strong> Floor (feet)20253035Soft Lacustrine Deposit4045Stiff Lacustrine Deposit50Legend55PlasticLimitNaturalWaterContentLiquidLimitProject Name: Restoration ProjectLocation: <strong>Salton</strong> <strong>Sea</strong>Project Number: 27663042Water Content and Plasticity <strong>In</strong>dicesvs. Depth(Boring 4)Figure No.C-8Atterberg_Limits_4
00 5 10 15 20 25 30 35 40 45 50 55 60 65 70 75 80 85<strong>Sea</strong>floor DepositWater Content (percent of dry weight)51015Soft Lacustrine Deposit20Depth Below <strong>Sea</strong> Floor (feet)253035Alluvial DepositStiff Lacustrine Deposit404550Alluvial DepositLegend55PlasticLimitNaturalWaterContentLiquidLimitProject Name: Restoration ProjectLocation: <strong>Salton</strong> <strong>Sea</strong>Project Number: 27663042Water Content and Plasticity <strong>In</strong>dicesvs. Depth(Boring 5)Figure No.C-9Atterberg_Limits_4
00 5 10 15 20 25 30 35 40 45 50 55 60 65 70 75 80 85<strong>Sea</strong>floor DepositWater Content (percent of dry weight)510Soft Lacustrine Deposit15Depth Below <strong>Sea</strong> Floor (feet)20253035Stiff Lacustrine Deposit404550Alluvial DepositLegend55PlasticLimitNaturalWaterContentLiquidLimitProject Name: Restoration ProjectLocation: <strong>Salton</strong> <strong>Sea</strong>Project Number: 27663042Water Content and Plasticity <strong>In</strong>dicesvs. Depth(Boring 6)Figure No.C-10Atterberg_Limits_4
00 5 10 15 20 25 30 35 40 45 50 55 60 65 70 75 80 85<strong>Sea</strong>floor DepositWater Content (percent of dry weight)5Soft Lacustrine Deposit10Alluvial Deposit15Depth Below <strong>Sea</strong> Floor (feet)20253035Stiff Lacustrine Deposit4045Alluvial Deposit50Legend55PlasticLimitNaturalWaterContentLiquidLimitProject Name: Restoration ProjectLocation: <strong>Salton</strong> <strong>Sea</strong>Project Number: 27663042Water Content and Plasticity <strong>In</strong>dicesvs. Depth(Boring 7)Figure No.C-11Atterberg_Limits_4
0Water Content (percent of dry weight)0 5 10 15 20 25 30 35 40 45 50 55 60 65 70 75 80 85<strong>Sea</strong>floor Deposit5Soft Lacustrine Deposit1015Depth Below <strong>Sea</strong> Floor (feet)20253035Stiff Lacustrine DepositAlluvial Deposit404550Legend55PlasticLimitNaturalWaterContentLiquidLimitProject Name: Restoration ProjectLocation: <strong>Salton</strong> <strong>Sea</strong>Project Number: 27663042Water Content and Plasticity <strong>In</strong>dicesvs. Depth(Boring 11)Figure No.C-12Atterberg_Limits_4
0Water Content (percent of dry weight)0 5 10 15 20 25 30 35 40 45 50 55 60 65 70 75 80 85<strong>Sea</strong>floor Deposit510Soft Lacustrine Deposit15Alluvial DepositDepth Below <strong>Sea</strong> Floor (feet)20253035Stiff Lacustrine Deposit4045Alluvial Deposit50Legend55PlasticLimitNaturalWaterContentLiquidLimitProject Name: Restoration ProjectLocation: <strong>Salton</strong> <strong>Sea</strong>Project Number: 27663042Water Content and Plasticity <strong>In</strong>dicesvs. Depth(Boring 14)Figure No.C-13Atterberg_Limits_4
Water Content (percent of dry weight)0 5 10 15 20 25 30 35 40 45 50 55 60 65 70 75 80 850<strong>Sea</strong>floor Deposit5Soft Lacustrine Deposit10Stiff Lacustrine Deposit1520Depth Below <strong>Sea</strong> Floor (feet)253035404550Legend55PlasticLimitNaturalWaterContentLiquidLimitProject Name: Restoration ProjectLocation: <strong>Salton</strong> <strong>Sea</strong>Project Number: 27663042Water Content and Plasticity <strong>In</strong>dicesvs. Depth(Boring 17)Figure No.C-14Atterberg_Limits_4
0Water Content (percent of dry weight)0 5 10 15 20 25 30 35 40 45 50 55 60 65 70 75 80 85<strong>Sea</strong>floor Deposit510Soft Lacustrine Deposit15Depth Below <strong>Sea</strong> Floor (feet)20253035Alluvial DepositStiff Lacustrine Deposit404550Legend55PlasticLimitNaturalWaterContentLiquidLimitProject Name: Restoration ProjectLocation: <strong>Salton</strong> <strong>Sea</strong>Project Number: 27663042Water Content and Plasticity <strong>In</strong>dicesvs. Depth(Boring 19)Figure No.C-15Atterberg_Limits_4
0Water Content (percent of dry weight)0 5 10 15 20 25 30 35 40 45 50 55 60 65 70 75 80 85<strong>Sea</strong>floor Deposit5Soft Lacustrine Deposit10Alluvial Deposit15Stiff Lacustrine DepositDepth Below <strong>Sea</strong> Floor (feet)20253035Alluvial Deposit404550Legend55PlasticLimitNaturalWaterContentLiquidLimitProject Name: Restoration ProjectLocation: <strong>Salton</strong> <strong>Sea</strong>Project Number: 27663042Water Content and Plasticity <strong>In</strong>dicesvs. Depth(Boring 20)Figure No.C-16Atterberg_Limits_4
0Water Content (percent of dry weight)0 5 10 15 20 25 30 35 40 45 50 55 60 65 70 75 80 85<strong>Sea</strong>floor Deposit51015Soft Lacustrine20Depth Below <strong>Sea</strong> Floor (feet)25303540Alluvial Deposit45Stiff Lacustrine Deposit50Legend55PlasticLimitNaturalWaterContentLiquidLimitProject Name: Restoration ProjectLocation: <strong>Salton</strong> <strong>Sea</strong>Project Number: 27663042Water Content and Plasticity <strong>In</strong>dicesvs. Depth(Boring 26)Figure No.C-17Atterberg_Limits_4
APPENDIXDStatic Slope Stability AnalysesW:\27663042\00005-c-r.doc\1-Mar-04\SDG
150100500-50-100-150-200-250-300-350-400-450-500-50 0 50 100 150 200 250 300 350 400 450 500 550 600 650 700 750 800150<strong>Salton</strong> <strong>Sea</strong>Project Number: 27663042Filename: <strong>Salton</strong> <strong>Sea</strong>_CuP_0.4_6.slzDate: December 10, 20031005001.70-50-100Embankment Fillγφtotal = 120 pcf= 30 degrees-15030’-20061-250-300<strong>Sea</strong>floor or Lacustrine Depositsγ total = 110 pcfCu/P = 0.4-350-400-450-500-50 0 50 100 150 200 250 300 350 400 450 500 550 600 650 700 750 800Horizontal Distance, ftElevation ft MSL
150100500-50-100-150-200-250-300-350-400-450-500-50 0 50 100 150 200 250 300 350 400 450 500 550 600 650 700 750 800150<strong>Salton</strong> <strong>Sea</strong>Project Number: 27663042Filename: <strong>Salton</strong> <strong>Sea</strong>_CuP_0.4_2.5.slzDate: January 15, 2004100500-50-100Embankment Fillγφtotal = 120 pcf= 30 degrees-1500.8830’-2002.5 1-250-300<strong>Sea</strong>floor or Lacustrine Depositsγ total = 110 pcfCu/P = 0.4-350-400-450-500-50 0 50 100 150 200 250 300 350 400 450 500 550 600 650 700 750 800Horizontal Distance, ftElevation ft MSL
150100500-50-100-150-200-250-300-350-400-450-500-50 0 50 100 150 200 250 300 350 400 450 500 550 600 650 700 750 800150<strong>Salton</strong> <strong>Sea</strong>Project Number: 27663042Filename: <strong>Salton</strong> <strong>Sea</strong>_0.3_ex_10_2.5.slzDate: January 15, 2004100500-50-100Embankment Fillγφtotal = 120 pcf= 30 degrees30’0.78-150-2002.51-250-300<strong>Sea</strong>floor or Lacustrine Depositsγ total = 110 pcfCu/P = 0.3-350-400-450-500-50 0 50 100 150 200 250 300 350 400 450 500 550 600 650 700 750 800Horizontal Distance, ftElevation ft MSL
150100500-50-100-150-200-250-300-350-400-450-500-50 0 50 100 150 200 250 300 350 400 450 500 550 600 650 700 750 800150<strong>Salton</strong> <strong>Sea</strong>Project Number: 27663042Filename: <strong>Salton</strong> <strong>Sea</strong>_0.4_ex_10_2.5.slzDate: January 15, 2004100500-50-100Embankment Fillγφtotal = 120 pcf= 30 degrees30’0.95-150-2002.51-250-300<strong>Sea</strong>floor or Lacustrine Depositsγ total = 110 pcfCu/P = 0.4-350-400-450-500-50 0 50 100 150 200 250 300 350 400 450 500 550 600 650 700 750 800Horizontal Distance, ftElevation ft MSL
300-200 -150 -100 -50 0 50 100 150 200 250 300 350 400 450 500 550 600 650 700 750 800 850 900 950300250200150<strong>Salton</strong> <strong>Sea</strong>Project Number: 27663042Filename: <strong>Salton</strong> <strong>Sea</strong>_0.3_ex_25_2.5.slzDate: January 15, 2004250200150100100505000-50-50-100-150-200-250Embankment Fillγφtotal = 120 pcf= 30 degrees30’2.511.08-100-150-200-250-300-300-350-400-450<strong>Sea</strong>floor or Lacustrine Depositsγ total = 110 pcfCu/P = 0.3-350-400-450-500-500-200 -150 -100 -50 0 50 100 150 200 250 300 350 400 450 500 550 600 650 700 750 800 850 900 950Horizontal Distance, ftElevation ft MSL
300-200 -150 -100 -50 0 50 100 150 200 250 300 350 400 450 500 550 600 650 700 750 800 850 900 950300250200150<strong>Salton</strong> <strong>Sea</strong>Project Number: 27663042Filename: <strong>Salton</strong> <strong>Sea</strong>_0.4_ex_25_2.5.slzDate: January 15, 2004250200150100100505000-50-50-100-150-200-250Embankment Fillγφtotal = 120 pcf= 30 degrees30’2.511.29-100-150-200-250-300-300-350-400-450<strong>Sea</strong>floor or Lacustrine Depositsγ total = 110 pcfCu/P = 0.4-350-400-450-500-500-200 -150 -100 -50 0 50 100 150 200 250 300 350 400 450 500 550 600 650 700 750 800 850 900 950Horizontal Distance, ftElevation ft MSL
300-200 -150 -100 -50 0 50 100 150 200 250 300 350 400 450 500 550 600 650 700 750 800 850 900 950300250200150<strong>Salton</strong> <strong>Sea</strong>Project Number: 27663042Filename: <strong>Salton</strong> <strong>Sea</strong>_0.3_ex_35_2.5.slzDate: January 28, 2004250200150100100505000-50-50-100-150-200-250Embankment Fillγφtotal = 120 pcf= 30 degrees30’2.511.31-100-150-200-250-300-300-350-400-450<strong>Sea</strong>floor or Lacustrine Depositsγ total = 110 pcfCu/P = 0.3-350-400-450-500-500-200 -150 -100 -50 0 50 100 150 200 250 300 350 400 450 500 550 600 650 700 750 800 850 900 950Horizontal Distance, ftElevation ft MSL
300-200 -150 -100 -50 0 50 100 150 200 250 300 350 400 450 500 550 600 650 700 750 800 850 900 950300250200150<strong>Salton</strong> <strong>Sea</strong>Project Number: 27663042Filename: <strong>Salton</strong> <strong>Sea</strong>_0.4_ex_35_2.5.slzDate: January 28, 2004250200150100100505000-50-50-100-150-200-250Embankment Fillγφtotal = 120 pcf= 30 degrees30’2.511.47-100-150-200-250-300-300-350-400-450<strong>Sea</strong>floor or Lacustrine Depositsγ total = 110 pcfCu/P = 0.4-350-400-450-500-500-200 -150 -100 -50 0 50 100 150 200 250 300 350 400 450 500 550 600 650 700 750 800 850 900 950Horizontal Distance, ftElevation ft MSL
150100500-50-100-150-200-250-300-350-400-450-500-50 0 50 100 150 200 250 300 350 400 450 500 550 600 650 700 750 800150<strong>Salton</strong> <strong>Sea</strong>Project Number: 27663042Filename: <strong>Salton</strong> <strong>Sea</strong>_CuP_0.3_6.slzDate: December 10, 20031005001.32-50-100Embankment Fillγφtotal = 120 pcf= 30 degrees-15030’-20061-250-300<strong>Sea</strong>floor or Lacustrine Depositsγ total = 110 pcfCu/P = 0.3-350-400-450-500-50 0 50 100 150 200 250 300 350 400 450 500 550 600 650 700 750 800Horizontal Distance, ftElevation ft MSL
150100500-50-100-150-200-250-300-350-400-450-500-50 0 50 100 150 200 250 300 350 400 450 500 550 600 650 700 750 800150<strong>Salton</strong> <strong>Sea</strong>Project Number: 27663042Filename: <strong>Salton</strong> <strong>Sea</strong>_CuP_0.3_2.5.slzDate: January 15, 2004100500-50-100Embankment Fillγφtotal = 120 pcf= 30 degrees-1500.7230’-2002.5 1-250-300<strong>Sea</strong>floor or Lacustrine Depositsγ total = 110 pcfCu/P = 0.3-350-400-450-500-50 0 50 100 150 200 250 300 350 400 450 500 550 600 650 700 750 800Horizontal Distance, ftElevation ft MSL
150100500-50-100-150-200-250-300-350-400-450-500-50 0 50 100 150 200 250 300 350 400 450 500 550 600 650 700 750 800150<strong>Salton</strong> <strong>Sea</strong>Project Number: 27663042Filename: <strong>Salton</strong> <strong>Sea</strong>_0.3_ex_10_6.slzDate: December 15, 20031005001.42-50-100Embankment Fillγφtotal = 120 pcf= 30 degrees-15030’-20061-250-300<strong>Sea</strong>floor or Lacustrine Depositsγ total = 110 pcfCu/P = 0.3-350-400-450-500-50 0 50 100 150 200 250 300 350 400 450 500 550 600 650 700 750 800Horizontal Distance, ftElevation ft MSL
150100500-50-100-150-200-250-300-350-400-450-500-50 0 50 100 150 200 250 300 350 400 450 500 550 600 650 700 750 800150<strong>Salton</strong> <strong>Sea</strong>Project Number: 27663042Filename: <strong>Salton</strong> <strong>Sea</strong>_0.4_ex_10_6.slzDate: December 15, 20031005001.77-50-100Embankment Fillγφtotal = 120 pcf= 30 degrees-15030’-20061-250-300<strong>Sea</strong>floor or Lacustrine Depositsγ total = 110 pcfCu/P = 0.4-350-400-450-500-50 0 50 100 150 200 250 300 350 400 450 500 550 600 650 700 750 800Horizontal Distance, ftElevation ft MSL
300-200 -150 -100 -50 0 50 100 150 200 250 300 350 400 450 500 550 600 650 700 750 800 850 900 950300250200150<strong>Salton</strong> <strong>Sea</strong>Project Number: 27663042Filename: <strong>Salton</strong> <strong>Sea</strong>_0.3_ex_25_6.slzDate: December 15, 2003250200150100100505000-501.60-50-100-150-200-250Embankment Fillγφtotal = 120 pcf= 30 degrees30’6 1-100-150-200-250-300-300-350-400-450<strong>Sea</strong>floor or Lacustrine Depositsγ total = 110 pcfCu/P = 0.3-350-400-450-500-500-200 -150 -100 -50 0 50 100 150 200 250 300 350 400 450 500 550 600 650 700 750 800 850 900 950Horizontal Distance, ftElevation ft MSL
300-200 -150 -100 -50 0 50 100 150 200 250 300 350 400 450 500 550 600 650 700 750 800 850 900 950300250200150<strong>Salton</strong> <strong>Sea</strong>Project Number: 27663042Filename: <strong>Salton</strong> <strong>Sea</strong>_0.4_ex_25_6.slzDate: December 15, 2003250200150100100505000-501.95-50-100-150-200-250Embankment Fillγφtotal = 120 pcf= 30 degrees30’6 1-100-150-200-250-300-300-350-400-450<strong>Sea</strong>floor or Lacustrine Depositsγ total = 110 pcfCu/P = 0.4-350-400-450-500-500-200 -150 -100 -50 0 50 100 150 200 250 300 350 400 450 500 550 600 650 700 750 800 850 900 950Horizontal Distance, ftElevation ft MSL
5004003002001000-100-200-300-400-500(x 1000)0.0 0.1 0.2 0.3 0.4 0.5 0.6 0.7 0.8 0.9 1.0 1.1 1.2 1.3<strong>Salton</strong> <strong>Sea</strong>Project Number: 27663042Filename: <strong>Salton</strong> <strong>Sea</strong>_CuP_0.3.slzDate: December 10, 20031.81Embankment Fillγ total = 120 pcfφ = 30 degrees30’101<strong>Sea</strong>floor or Lacustrine Depositsγ total = 110 pcfCu/P = 0.30.0 0.1 0.2 0.3 0.4 0.5 0.6 0.7 0.8 0.9 1.0 1.1 1.2 1.3Horizontal Distance, ft (x 1000)5004003002001000-100-200-300-400-500Elevation ft MSL
5004003002001000-100-200-300-400-500(x 1000)0.0 0.1 0.2 0.3 0.4 0.5 0.6 0.7 0.8 0.9 1.0 1.1 1.2 1.3<strong>Salton</strong> <strong>Sea</strong>Project Number: 27663042Filename: <strong>Salton</strong> <strong>Sea</strong>_CuP_0.4.slzDate: December 10, 20032.35Embankment Fillγ total = 120 pcfφ = 30 degrees30’101<strong>Sea</strong>floor or Lacustrine Depositsγ total = 110 pcfCu/P = 0.40.0 0.1 0.2 0.3 0.4 0.5 0.6 0.7 0.8 0.9 1.0 1.1 1.2 1.3Horizontal Distance, ft (x 1000)5004003002001000-100-200-300-400-500Elevation ft MSL
5004003002001000-100-200-300-400-500(x 1000)0.0 0.1 0.2 0.3 0.4 0.5 0.6 0.7 0.8 0.9 1.0 1.1 1.2 1.3<strong>Salton</strong> <strong>Sea</strong>Project Number: 27663042Filename: <strong>Salton</strong> <strong>Sea</strong>_0.3_ex_10.slzDate: December 15, 20031.90Embankment Fillγ total = 120 pcfφ = 30 degrees30’101<strong>Sea</strong>floor or Lacustrine Depositsγ total = 110 pcfCu/P = 0.30.0 0.1 0.2 0.3 0.4 0.5 0.6 0.7 0.8 0.9 1.0 1.1 1.2 1.3Horizontal Distance, ft (x 1000)5004003002001000-100-200-300-400-500Elevation ft MSL
5004003002001000-100-200-300-400-500(x 1000)0.0 0.1 0.2 0.3 0.4 0.5 0.6 0.7 0.8 0.9 1.0 1.1 1.2 1.3<strong>Salton</strong> <strong>Sea</strong>Project Number: 27663042Filename: <strong>Salton</strong> <strong>Sea</strong>_0.4_ex_10.slzDate: December 15, 20032.44Embankment Fillγ total = 120 pcfφ = 30 degrees30’101<strong>Sea</strong>floor or Lacustrine Depositsγ total = 110 pcfCu/P = 0.40.0 0.1 0.2 0.3 0.4 0.5 0.6 0.7 0.8 0.9 1.0 1.1 1.2 1.3Horizontal Distance, ft (x 1000)5004003002001000-100-200-300-400-500Elevation ft MSL
5004003002001000-100-200-300-400-500(x 1000)-0.3 -0.2 -0.1 0.0 0.1 0.2 0.3 0.4 0.5 0.6 0.7 0.8 0.9 1.0 1.1 1.2 1.3 1.4 1.5 1.6<strong>Salton</strong> <strong>Sea</strong>Project Number: 27663042Filename: <strong>Salton</strong> <strong>Sea</strong>_0.3_ex_25.slzDate: December 15, 20032.07Embankment Fillγφtotal = 120 pcf= 30 degrees30’101<strong>Sea</strong>floor or Lacustrine Depositsγ total = 110 pcfCu/P = 0.3-0.3 -0.2 -0.1 0.0 0.1 0.2 0.3 0.4 0.5 0.6 0.7 0.8 0.9 1.0 1.1 1.2 1.3 1.4 1.5 1.6Horizontal Distance, ft (x 1000)5004003002001000-100-200-300-400-500Elevation ft MSL
5004003002001000-100-200-300-400-500(x 1000)-0.3 -0.2 -0.1 0.0 0.1 0.2 0.3 0.4 0.5 0.6 0.7 0.8 0.9 1.0 1.1 1.2 1.3 1.4 1.5 1.6<strong>Salton</strong> <strong>Sea</strong>Project Number: 27663042Filename: <strong>Salton</strong> <strong>Sea</strong>_0.4_ex_25.slzDate: December 15, 20032.61Embankment Fillγφtotal = 120 pcf= 30 degrees30’101<strong>Sea</strong>floor or Lacustrine Depositsγ total = 110 pcfCu/P = 0.4-0.3 -0.2 -0.1 0.0 0.1 0.2 0.3 0.4 0.5 0.6 0.7 0.8 0.9 1.0 1.1 1.2 1.3 1.4 1.5 1.6Horizontal Distance, ft (x 1000)5004003002001000-100-200-300-400-500Elevation ft MSL
150100500-50-100-150-200-250-300-350-400-450-500-50 0 50 100 150 200 250 300 350 400 450 500 550 600 650 700 750 800150<strong>Salton</strong> <strong>Sea</strong>Project Number: 27663042Filename: <strong>Salton</strong> <strong>Sea</strong>_CuP_0.3_2.5.slzDate: January 15, 2004100500-50-100Embankment Fillγφtotal = 120 pcf= 30 degrees-15030’0.782.5 1-200-250-300<strong>Sea</strong>floor or Lacustrine Depositsγ total = 110 pcfCu/P = 0.3-350-400-450-500-50 0 50 100 150 200 250 300 350 400 450 500 550 600 650 700 750 800Horizontal Distance, ftElevation ft MSL
150100500-50-100-150-200-250-300-350-400-450-500-50 0 50 100 150 200 250 300 350 400 450 500 550 600 650 700 750 800150<strong>Salton</strong> <strong>Sea</strong>Project Number: 27663042Filename: <strong>Salton</strong> <strong>Sea</strong>_CuP_0.4_2.5.slzDate: January 15, 2004100500-50-100Embankment Fillγφtotal = 120 pcf= 30 degrees-15030’0.952.5 1-200-250-300<strong>Sea</strong>floor or Lacustrine Depositsγ total = 110 pcfCu/P = 0.4-350-400-450-500-50 0 50 100 150 200 250 300 350 400 450 500 550 600 650 700 750 800Horizontal Distance, ftElevation ft MSL
150100500-50-100-150-200-250-300-350-400-450-500-50 0 50 100 150 200 250 300 350 400 450 500 550 600 650 700 750 800150<strong>Salton</strong> <strong>Sea</strong>Project Number: 27663042Filename: <strong>Salton</strong> <strong>Sea</strong>_0.3_ex_10_2.5.slzDate: January 15, 2004100500-50-100Embankment Fillγφtotal = 120 pcf= 30 degrees-1501.01-20030’2.51-250-300<strong>Sea</strong>floor or Lacustrine Depositsγ total = 110 pcfCu/P = 0.3-350-400-450-500-50 0 50 100 150 200 250 300 350 400 450 500 550 600 650 700 750 800Horizontal Distance, ftElevation ft MSL
150100500-50-100-150-200-250-300-350-400-450-500-50 0 50 100 150 200 250 300 350 400 450 500 550 600 650 700 750 800150<strong>Salton</strong> <strong>Sea</strong>Project Number: 27663042Filename: <strong>Salton</strong> <strong>Sea</strong>_0.4_ex_10_2.5.slzDate: January 15, 2004100500-50-100Embankment Fillγφtotal = 120 pcf= 30 degrees-15030’1.19-2002.51-250-300<strong>Sea</strong>floor or Lacustrine Depositsγ total = 110 pcfCu/P = 0.4-350-400-450-500-50 0 50 100 150 200 250 300 350 400 450 500 550 600 650 700 750 800Horizontal Distance, ftElevation ft MSL
150100500-50-100-150-200-250-300-350-400-450-500-50 0 50 100 150 200 250 300 350 400 450 500 550 600 650 700 750 800150<strong>Salton</strong> <strong>Sea</strong>Project Number: 27663042Filename: <strong>Salton</strong> <strong>Sea</strong>_0.3_ex_25_2.5.slzDate: January 15, 2004100500-50-100Embankment Fillγφtotal = 120 pcf= 30 degrees1.41-15030’-2002.51-250-300<strong>Sea</strong>floor or Lacustrine Depositsγ total = 110 pcfCu/P = 0.3-350-400-450-500-50 0 50 100 150 200 250 300 350 400 450 500 550 600 650 700 750 800Horizontal Distance, ftElevation ft MSL
150100500-50-100-150-200-250-300-350-400-450-500-50 0 50 100 150 200 250 300 350 400 450 500 550 600 650 700 750 800150<strong>Salton</strong> <strong>Sea</strong>Project Number: 27663042Filename: <strong>Salton</strong> <strong>Sea</strong>_0.4_ex_25_2.5.slzDate: January 15, 2004100500-50-100Embankment Fillγφtotal = 120 pcf= 30 degrees30’1.63-150-2002.51-250-300<strong>Sea</strong>floor or Lacustrine Depositsγ total = 110 pcfCu/P = 0.4-350-400-450-500-50 0 50 100 150 200 250 300 350 400 450 500 550 600 650 700 750 800Horizontal Distance, ftElevation ft MSL
150100500-50-100-150-200-250-300-350-400-450-500-50 0 50 100 150 200 250 300 350 400 450 500 550 600 650 700 750 800150<strong>Salton</strong> <strong>Sea</strong>Project Number: 27663042Filename: <strong>Salton</strong> <strong>Sea</strong>_CuP_0.3_6.slzDate: January 15, 2004100500-50-100Embankment Fillγφtotal = 120 pcf= 30 degrees1.32-15030’-20061-250-300<strong>Sea</strong>floor or Lacustrine Depositsγ total = 110 pcfCu/P = 0.3-350-400-450-500-50 0 50 100 150 200 250 300 350 400 450 500 550 600 650 700 750 800Horizontal Distance, ftElevation ft MSL
150100500-50-100-150-200-250-300-350-400-450-500-50 0 50 100 150 200 250 300 350 400 450 500 550 600 650 700 750 800150<strong>Salton</strong> <strong>Sea</strong>Project Number: 27663042Filename: <strong>Salton</strong> <strong>Sea</strong>_CuP_0.4_6.slzDate: January 15, 2004100500-50-100Embankment Fillγφtotal = 120 pcf= 30 degrees1.68-15030’-20061-250-300<strong>Sea</strong>floor or Lacustrine Depositsγ total = 110 pcfCu/P = 0.4-350-400-450-500-50 0 50 100 150 200 250 300 350 400 450 500 550 600 650 700 750 800Horizontal Distance, ftElevation ft MSL
150100500-50-100-150-200-250-300-350-400-450-500-50 0 50 100 150 200 250 300 350 400 450 500 550 600 650 700 750 800150<strong>Salton</strong> <strong>Sea</strong>Project Number: 27663042Filename: <strong>Salton</strong> <strong>Sea</strong>_0.3_ex_10_6.slzDate: January 15, 2004100500-50-100Embankment Fillγφtotal = 120 pcf= 30 degrees1.51-15030’-20061-250-300<strong>Sea</strong>floor or Lacustrine Depositsγ total = 110 pcfCu/P = 0.3-350-400-450-500-50 0 50 100 150 200 250 300 350 400 450 500 550 600 650 700 750 800Horizontal Distance, ftElevation ft MSL
150100500-50-100-150-200-250-300-350-400-450-500-50 0 50 100 150 200 250 300 350 400 450 500 550 600 650 700 750 800150<strong>Salton</strong> <strong>Sea</strong>Project Number: 27663042Filename: <strong>Salton</strong> <strong>Sea</strong>_0.4_ex_10_6.slzDate: January 15, 2004100500-50Embankment Fillγφtotal = 120 pcf= 30 degrees1.87-100-15030’-20061-250-300<strong>Sea</strong>floor or Lacustrine Depositsγ total = 110 pcfCu/P = 0.4-350-400-450-500-50 0 50 100 150 200 250 300 350 400 450 500 550 600 650 700 750 800Horizontal Distance, ftElevation ft MSL
150100500-50-100-150-200-250-300-350-400-450-500-50 0 50 100 150 200 250 300 350 400 450 500 550 600 650 700 750 800150<strong>Salton</strong> <strong>Sea</strong>Project Number: 27663042Filename: <strong>Salton</strong> <strong>Sea</strong>_0.3_ex_25_6.slzDate: January 15, 2004100500-50-100Embankment Fillγφtotal = 120 pcf= 30 degrees1.81-15030’-20061-250-300<strong>Sea</strong>floor or Lacustrine Depositsγ total = 110 pcfCu/P = 0.3-350-400-450-500-50 0 50 100 150 200 250 300 350 400 450 500 550 600 650 700 750 800Horizontal Distance, ftElevation ft MSL
150100500-50-100-150-200-250-300-350-400-450-500-50 0 50 100 150 200 250 300 350 400 450 500 550 600 650 700 750 800150<strong>Salton</strong> <strong>Sea</strong>Project Number: 27663042Filename: <strong>Salton</strong> <strong>Sea</strong>_0.4_ex_25_6.slzDate: January 15, 2004100500-50Embankment Fillγφtotal = 120 pcf= 30 degrees2.17-100-15030’-20061-250-300<strong>Sea</strong>floor or Lacustrine Depositsγ total = 110 pcfCu/P = 0.4-350-400-450-500-50 0 50 100 150 200 250 300 350 400 450 500 550 600 650 700 750 800Horizontal Distance, ftElevation ft MSL
5004003002001000-100-200-300-400-500(x 1000)0.0 0.1 0.2 0.3 0.4 0.5 0.6 0.7 0.8 0.9 1.0 1.1 1.2 1.3<strong>Salton</strong> <strong>Sea</strong>Project Number: 27663042Filename: <strong>Salton</strong> <strong>Sea</strong>_CuP_0.3_10.slzDate: January 15, 20041.89Embankment Fillγ total = 120 pcfφ = 30 degrees30’10 1<strong>Sea</strong>floor or Lacustrine Depositsγ total = 110 pcfCu/P = 0.30.0 0.1 0.2 0.3 0.4 0.5 0.6 0.7 0.8 0.9 1.0 1.1 1.2 1.3Horizontal Distance, ft (x 1000)5004003002001000-100-200-300-400-500Elevation ft MSL
5004003002001000-100-200-300-400-500(x 1000)0.0 0.1 0.2 0.3 0.4 0.5 0.6 0.7 0.8 0.9 1.0 1.1 1.2 1.3<strong>Salton</strong> <strong>Sea</strong>Project Number: 27663042Filename: <strong>Salton</strong> <strong>Sea</strong>_CuP_0.4_10.slzDate: January 15, 20042.43Embankment Fillγ total = 120 pcfφ = 30 degrees30’10 1<strong>Sea</strong>floor or Lacustrine Depositsγ total = 110 pcfCu/P = 0.40.0 0.1 0.2 0.3 0.4 0.5 0.6 0.7 0.8 0.9 1.0 1.1 1.2 1.3Horizontal Distance, ft (x 1000)5004003002001000-100-200-300-400-500Elevation ft MSL
5004003002001000-100-200-300-400-500(x 1000)0.0 0.1 0.2 0.3 0.4 0.5 0.6 0.7 0.8 0.9 1.0 1.1 1.2 1.3<strong>Salton</strong> <strong>Sea</strong>Project Number: 27663042Filename: <strong>Salton</strong> <strong>Sea</strong>_0.3_ex_10_10.slzDate: January 15, 20041.99Embankment Fillγ total = 120 pcfφ = 30 degrees30’101<strong>Sea</strong>floor or Lacustrine Depositsγ total = 110 pcfCu/P = 0.30.0 0.1 0.2 0.3 0.4 0.5 0.6 0.7 0.8 0.9 1.0 1.1 1.2 1.3Horizontal Distance, ft (x 1000)5004003002001000-100-200-300-400-500Elevation ft MSL
5004003002001000-100-200-300-400-500(x 1000)0.0 0.1 0.2 0.3 0.4 0.5 0.6 0.7 0.8 0.9 1.0 1.1 1.2 1.3<strong>Salton</strong> <strong>Sea</strong>Project Number: 27663042Filename: <strong>Salton</strong> <strong>Sea</strong>_0.4_ex_10_10.slzDate: January 15, 20042.52Embankment Fillγ total = 120 pcfφ = 30 degrees30’101<strong>Sea</strong>floor or Lacustrine Depositsγ total = 110 pcfCu/P = 0.40.0 0.1 0.2 0.3 0.4 0.5 0.6 0.7 0.8 0.9 1.0 1.1 1.2 1.3Horizontal Distance, ft (x 1000)5004003002001000-100-200-300-400-500Elevation ft MSL
5004003002001000-100-200-300-400-500(x 1000)0.0 0.1 0.2 0.3 0.4 0.5 0.6 0.7 0.8 0.9 1.0 1.1 1.2 1.3<strong>Salton</strong> <strong>Sea</strong>Project Number: 27663042Filename: <strong>Salton</strong> <strong>Sea</strong>_0.3_ex_25_10.slzDate: January 15, 20042.27Embankment Fillγ total = 120 pcfφ = 30 degrees30’101<strong>Sea</strong>floor or Lacustrine Depositsγ total = 110 pcfCu/P = 0.30.0 0.1 0.2 0.3 0.4 0.5 0.6 0.7 0.8 0.9 1.0 1.1 1.2 1.3Horizontal Distance, ft (x 1000)5004003002001000-100-200-300-400-500Elevation ft MSL
5004003002001000-100-200-300-400-500(x 1000)0.0 0.1 0.2 0.3 0.4 0.5 0.6 0.7 0.8 0.9 1.0 1.1 1.2 1.3<strong>Salton</strong> <strong>Sea</strong>Project Number: 27663042Filename: <strong>Salton</strong> <strong>Sea</strong>_0.4_ex_25_10.slzDate: January 15, 20042.80Embankment Fillγ total = 120 pcfφ = 30 degrees30’101<strong>Sea</strong>floor or Lacustrine Depositsγ total = 110 pcfCu/P = 0.40.0 0.1 0.2 0.3 0.4 0.5 0.6 0.7 0.8 0.9 1.0 1.1 1.2 1.3Horizontal Distance, ft (x 1000)5004003002001000-100-200-300-400-500Elevation ft MSL