SIMATIC IT - Siemens
SIMATIC IT - Siemens
SIMATIC IT - Siemens
Create successful ePaper yourself
Turn your PDF publications into a flip-book with our unique Google optimized e-Paper software.
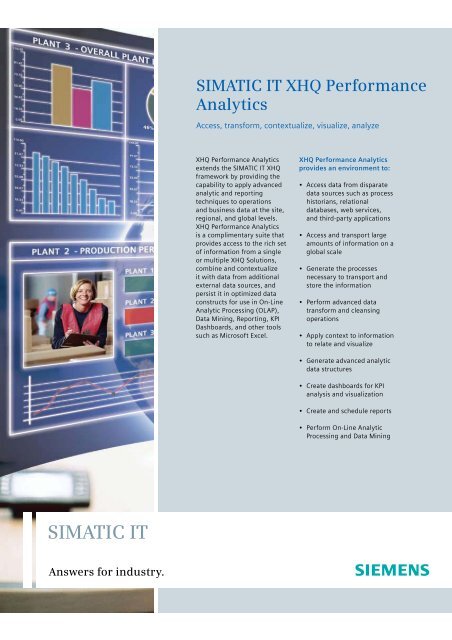
<strong>SIMATIC</strong> <strong>IT</strong> XHQ PerformanceAnalyticsAccess, transform, contextualize, visualize, analyzeXHQ Performance Analyticsextends the <strong>SIMATIC</strong> <strong>IT</strong> XHQframework by providing thecapability to apply advancedanalytic and reportingtechniques to operationsand business data at the site,regional, and global levels.XHQ Performance Analyticsis a complimentary suite thatprovides access to the rich setof information from a singleor multiple XHQ Solutions,combine and contextualizeit with data from additionalexternal data sources, andpersist it in optimized dataconstructs for use in On-LineAnalytic Processing (OLAP),Data Mining, Reporting, KPIDashboards, and other toolssuch as Microsoft Excel.XHQ Performance Analyticsprovides an environment to:data sources such as processhistorians, relationaldatabases, web services,and third-party applications amounts of information on aglobal scale necessary to transport andstore the information transform and cleansingoperations to relate and visualize data structures analysis and visualization Processing and Data Mining
Benefits Increased insight and responsivenessSingle source for manufacturingdecision makers, from the plant tothe corporate headquartersRecognize issues and opportunitiesfrom many angles, e.g., from theplant up or from the enterprise downDrive near real-time decision-makingthroughout the enterpriseCompile a breadth of informationthat not only provides thefoundation for decision-making,but also allows for the analysis andvisualization of the decision resultsContextual information and analyticsallow for problem discovery usingKPIs and analytics with the ability todrill down to details Greater efficiency Production data is aligned in thecontext of business and enterpriselevel data, which provides relationsto supply chain and productionevents. This allows for a robust setof KPIs which are used to optimizeperformance at all levels By comparing performanceinformation across production lines,sites, and regions, best practices canbe identified and propagated discovered and identified throughdata mining problems can be identified byaggregating and comparing dataacross many dimensions such astime periods, plant hierarchies,product hierarchies, equipmenthierarchies, processes, products,work orders, exceptions, and reasonsXHQ Performance Analytics Information Flow
XHQ’s Integrated ArchitectureAdvanced data integration, analytic,and reporting capabilitiesXHQ Performance Analytics (PA) offers theability to view information in new andenlightening ways. This is done byleveraging the rich set of informationavailable through the XHQ OperationsIntelligence platform, combining it withinformation from additional operationaland business systems, optimizing theinformation for use in reporting andanalysis, and finally presenting theinformation in reports, dashboards, andanalytics tools.The XHQ Advanced Integration Serverprovides the set of tools for efficiently andeffectively extracting and delivering avariety of data to the XHQ InformationManagement layer. The data can originatefrom an existing XHQ Solution, one or allof the XHQ Applications such asPerformance Management, or almost anythird party data source. The mechanismsinvolved are designed to support local,regional, and even global implementations.The extracted data is contextualized andstored in the XHQ PA InformationManagement layer. The information ispersisted in data stores that are highlyoptimized for performing analytical tasks.The structures of these data stores will bepre-configured when well known datasources, such as XHQ Applications, areavailable. When the structure of thesource in not well known, thePerformance Analytics Engineering Layercan be used to generate the analytic datastores and transport mechanisms. Thesecan be based on the content of one ormore XHQ Solutions or external datasources such as Oracle and SQL Server.Once the data is contextualized andoptimized, the information can be usedfor the calculation of complex andaggregated KPI’s, performing On-LineAnalytic Processing , or rendering highlyefficient reports and dashboards.Visualization can be accomplished usingthe XHQ Visual Composer, XHQ ClientComposer, or via PA Reporting. Other toolssuch as Microsoft Excel can also access theanalytic data structures.
Advanced Integration Server increase throughput and data cleansing procedures eliminate lost data XHQ Information Management Layer reporting and analytics can off-loadprocessing from the transactional datastore aggregated and contextualized Models for a rich set of precontextualizeddata analysis, which enables retrievalmechanisms to efficiently anddynamically generate result sets information efficientlyVisualization applications including the VisualComposer controls with other XHQ contentAnalytics structures derived from XHQ Model historical, and relational data patterns and relationships Engineering including dimensional schemas andOLAP cubes based on internal andexternal data sources Energy <strong>Siemens</strong> Sector, Industry, OilInc.and Gas DivisionThe 3333 <strong>Siemens</strong> Old Milton Centre Parkway60, MacPAherson RoadSingapore 348615DID +65 6490 6794FAX info.us@siemens.com+65 6490 6795oilgasconsulting.sg@siemens.comhttp://sg.siemens.com/cms/sg/oilgasconsulting


