Financial Health Ratings Are More Effective than Z ... - Rapid Ratings
Financial Health Ratings Are More Effective than Z ... - Rapid Ratings
Financial Health Ratings Are More Effective than Z ... - Rapid Ratings

Create successful ePaper yourself
Turn your PDF publications into a flip-book with our unique Google optimized e-Paper software.
<strong>Financial</strong> <strong>Health</strong> Rating (FHR) and Z‐Score Comparisons<br />
<strong>Financial</strong> <strong>Health</strong> <strong>Ratings</strong> <strong>Are</strong> <strong>More</strong> <strong>Effective</strong> <strong>than</strong> Z‐Scores in Predicting Default<br />
The Z‐score formula for predicting bankruptcy was developed in 1968 by Edward I. Altman, a financial<br />
economist and professor at the Leonard N. Stern School of Business at New York University. The Z‐Score<br />
was developed by utilizing a linear regression model in order to relate five financial statement ratios to<br />
whether or not a firm filed for bankruptcy protection within two years. Still in use today, it is considered<br />
one of the standard measures for detecting potential solvency problems in non‐financial public<br />
corporations.<br />
<strong>Rapid</strong> <strong>Ratings</strong> International has developed a unique proprietary process for rating the financial health of<br />
a company called the FHR (for <strong>Financial</strong> <strong>Health</strong> Rating). FHRs are early indicators of companies'<br />
improving and deteriorating financial positions and thus are ideally suited for use by risk managers who<br />
are monitoring exposures. FHRs are more accurate measurements of corporate financial health and<br />
future competitive sustainability <strong>than</strong> traditional tools, including market based tools, and therefore<br />
translate into more accurate estimations of default probabilities.<br />
Test Design: <strong>Rapid</strong> <strong>Ratings</strong> designed a test for the purpose of comparing the effectiveness of FHRs<br />
versus Z‐Scores for providing advance indications of default events. The testing universe included<br />
default events recorded since the end of 1998 through the end of 2008. For each company in the sample<br />
set, we produced a quarterly time series of Z‐Scores. This test identified 258 companies for which <strong>Rapid</strong><br />
<strong>Ratings</strong> could obtain all the necessary data to calculate a series of Z‐Scores for the test period. We<br />
compared the two measures, using >1.86 as an indication for default by the Z‐score, and less <strong>than</strong> 40 as<br />
an indication of default for the FHR. Details of this analysis can be found in the appendix.<br />
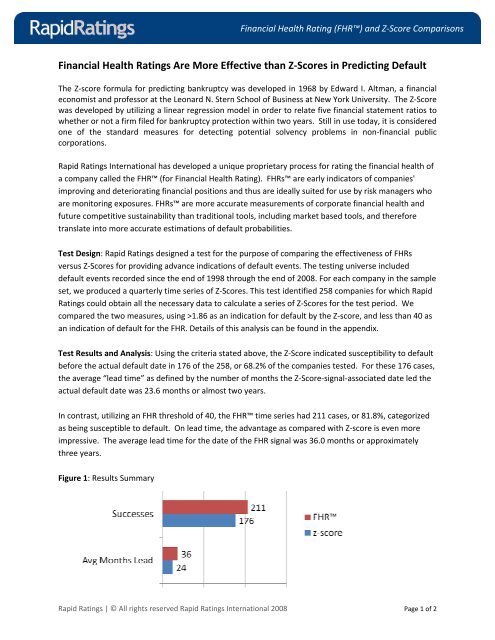
Test Results and Analysis: Using the criteria stated above, the Z‐Score indicated susceptibility to default<br />
before the actual default date in 176 of the 258, or 68.2% of the companies tested. For these 176 cases,<br />
the average “lead time” as defined by the number of months the Z‐Score‐signal‐associated date led the<br />
actual default date was 23.6 months or almost two years.<br />
In contrast, utilizing an FHR threshold of 40, the FHR time series had 211 cases, or 81.8%, categorized<br />
as being susceptible to default. On lead time, the advantage as compared with Z‐score is even more<br />
impressive. The average lead time for the date of the FHR signal was 36.0 months or approximately<br />
three years.<br />
Figure 1: Results Summary<br />
<strong>Rapid</strong> <strong>Ratings</strong> | © All rights reserved <strong>Rapid</strong> <strong>Ratings</strong> International 2008 Page 1 of 2
Model<br />
Feature<br />
<strong>Financial</strong> <strong>Health</strong> Rating (FHR) and Z‐Score Comparisons<br />
Conclusion: Although various versions of Z‐Score‐type models are still in use today, the effectiveness of<br />
each one is constrained by its inherent limitations. The FHR employs a vastly larger input data set for<br />
calibration, a more robust and pertinent dependent variable, and global industry‐specific models.<br />
<strong>More</strong>over, because FHRs offer significant differentiation between different levels of risk, they are<br />
superior metrics for managing, measuring, and budgeting for financial health risks beyond merely giving<br />
indications of susceptibility to bankruptcy. This is evidenced by the FHR system outperforming the<br />
Z‐Score in terms of accuracy by a identifying 20% more of the cases as well as providing warning signals<br />
about 50% earlier on the average. Both the accuracy and timing tests indicate that <strong>Rapid</strong> <strong>Ratings</strong><br />
provides a significant comparative advantage to lenders, investors and risk managers.<br />
Figure 1: Features Matrix<br />
Z‐Score Model <strong>Rapid</strong> <strong>Ratings</strong> International’s FHR Model<br />
Model type Multivariate discriminant analysis<br />
(linear regression model).<br />
Original model<br />
foundations<br />
Foundation model was based on 66<br />
companies in the US manufacturing<br />
sector, half of which had filed for<br />
bankruptcy. Small firms with assets of<br />
less <strong>than</strong> $1 million were eliminated.<br />
Model inputs 5 FINANCIAL RATIOS<br />
Altman started with 22 financial ratios<br />
but reduced the number to five which<br />
offered the best results:<br />
• Working Capital/Total Assets<br />
• Retained Earnings/ Total Assets<br />
• EBIT /Total Assets<br />
• Market Value of Equity/Total Liabilities<br />
• Sales/Total Assets<br />
Model Outputs Forecasts the relative likelihood of a company<br />
entering bankruptcy within a 2 year period.<br />
Differentiability Tests have shown significant differences between<br />
three groupings or clusters of Z‐Scores, but not a<br />
one‐to‐one relationship with bankruptcy between<br />
a Z‐Score of 2.0 and a Z‐Score of 2.2.<br />
Global<br />
benchmarking<br />
Multivariate Econometric Panel Data Model (non‐linear and adaptive<br />
modeling).<br />
Foundation model was based on 9 million observations drawn from over<br />
300,000 companies from more <strong>than</strong> 30 years from more <strong>than</strong> a dozen<br />
countries. The database contained a large number of small, medium and<br />
large scale companies. These companies were both listed and unlisted.<br />
62 FINANCIAL RATIOS<br />
OPERATING PERFORMANCE<br />
Cost Structure (e.g. COGS/tot. exp.; taxes/revenues)<br />
Profitability (e.g. NPAT/assets; EBIT/capital employed)<br />
Sales Efficiency (e.g. sales/inventories; sales/working capital)<br />
FINANCIAL POSITIONING<br />
Debt Service (e.g. EBIT/interest exp.; interest exp./total liabilities)<br />
Leverage (e.g. total liabilities/sales; total liabilities/total assets)<br />
Working capital efficiency (e.g. working cap./total revenue; term<br />
liabilities/cap. employed)<br />
Assesses the financial health of each company against a very rich global<br />
benchmarking system.<br />
Tests have reflected significant evidence of a one‐to‐one relationship<br />
between FHR level and subsequent incidence of default.<br />
Not employed. This is a fundamental feature of the <strong>Rapid</strong> <strong>Ratings</strong> system that<br />
ensures much more accurate financial performance measurement.<br />
Industry focus Not designed for individual industries Focus on 24 separate industries permits greater precision of risk<br />
measurement and significantly greater forecasting accuracy.<br />
<strong>Effective</strong>ness in<br />
providing early<br />
warning signals<br />
Tests by Eidleman demonstrate greater<br />
<strong>than</strong> 70% reliability in differentiating<br />
companies that go bankrupt within two<br />
years and those that do not.<br />
Test show that 80% of companies that suffer s default event within the<br />
next 12 – 24 months are in the <strong>Rapid</strong> <strong>Ratings</strong> Red Zone of susceptibility to<br />
default defined by an FHR of less <strong>than</strong> 40.<br />
<strong>Rapid</strong> <strong>Ratings</strong> | © All rights reserved <strong>Rapid</strong> <strong>Ratings</strong> International 2008 Page 2 of 2