The FHR™ Report - Rapid Ratings
The FHR™ Report - Rapid Ratings
The FHR™ Report - Rapid Ratings

Create successful ePaper yourself
Turn your PDF publications into a flip-book with our unique Google optimized e-Paper software.
<strong>Rapid</strong><strong>Ratings</strong><br />
Financial Health <strong>Ratings</strong><br />
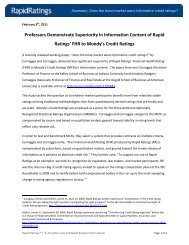
Research In Motion Ltd<br />
Financial health declining, but still very strong<br />
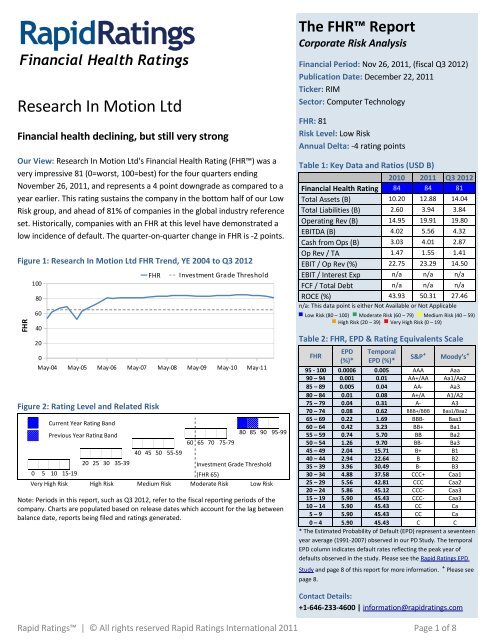
Our View: Research In Motion Ltd's Financial Health Rating (FHR) was a<br />
very impressive 81 (0=worst, 100=best) for the four quarters ending<br />
November 26, 2011, and represents a 4 point downgrade as compared to a<br />
year earlier. This rating sustains the company in the bottom half of our Low<br />
Risk group, and ahead of 81% of companies in the global industry reference<br />
set. Historically, companies with an FHR at this level have demonstrated a<br />
low incidence of default. <strong>The</strong> quarter-on-quarter change in FHR is -2 points.<br />
Figure 1: Research In Motion Ltd FHR Trend, YE 2004 to Q3 2012<br />
FHR<br />
100<br />
80<br />
60<br />
40<br />
20<br />
0<br />
May-04 May-05 May-06 May-07 May-08 May-09 May-10 May-11<br />
Figure 2: Rating Level and Related Risk<br />
Current Year Rating Band<br />
Previous Year Rating Band<br />
FHR<br />
40 45 50 55-59<br />
Investment Grade Threshold<br />
60 65 70 75-79<br />
80 85 90 95-99<br />
20 25 30 35-39 Investment Grade Threshold<br />
0 5 10 15-19 (FHR 65)<br />
Very High Risk High Risk Medium Risk Moderate Risk Low Risk<br />
Note: Periods in this report, such as Q3 2012, refer to the fiscal reporting periods of the<br />
company. Charts are populated based on release dates which account for the lag between<br />
balance date, reports being filed and ratings generated.<br />
<strong>The</strong> FHR <strong>Report</strong><br />
Corporate Risk Analysis<br />
Financial Period: Nov 26, 2011, (fiscal Q3 2012)<br />
Publication Date: December 22, 2011<br />
Ticker: RIM<br />
Sector: Computer Technology<br />
FHR: 81<br />
Risk Level: Low Risk<br />
Annual Delta: -4 rating points<br />
Table 1: Key Data and Ratios (USD B)<br />
2010 2011 Q3 2012<br />
Financial Health Rating 84 84 81<br />
Total Assets (B) 10.20 12.88 14.04<br />
Total Liabilities (B) 2.60 3.94 3.84<br />
Operating Rev (B) 14.95 19.91 19.80<br />
EBITDA (B) 4.02 5.56 4.32<br />
Cash from Ops (B) 3.03 4.01 2.87<br />
Op Rev / TA 1.47 1.55 1.41<br />
EBIT / Op Rev (%) 22.75 23.29 14.50<br />
EBIT / Interest Exp n/a n/a n/a<br />
FCF / Total Debt n/a n/a n/a<br />
ROCE (%) 43.93 50.31 27.46<br />
n/a: This data point is either Not Available or Not Applicable<br />
Low Risk (80 – 100) Moderate Risk (60 – 79) Medium Risk (40 – 59)<br />
High Risk (20 – 39) Very High Risk (0 – 19)<br />
Table 2: FHR, EPD & Rating Equivalents Scale<br />
FHR<br />
EPD<br />
(%)*<br />
Temporal<br />
EPD (%)*<br />
S&P⁺ Moody’s⁺<br />
95 - 100 0.0006 0.005 AAA Aaa<br />
90 – 94 0.001 0.01 AA+/AA Aa1/Aa2<br />
85 – 89 0.005 0.04 AA- Aa3<br />
80 – 84 0.01 0.08 A+/A A1/A2<br />
75 – 79 0.04 0.31 A- A3<br />
70 – 74 0.08 0.62 BBB+/BBB Baa1/Baa2<br />
65 – 69 0.22 1.69 BBB- Baa3<br />
60 – 64 0.42 3.23 BB+ Ba1<br />
55 – 59 0.74 5.70 BB Ba2<br />
50 – 54 1.26 9.70 BB- Ba3<br />
45 – 49 2.04 15.71 B+ B1<br />
40 – 44 2.94 22.64 B B2<br />
35 – 39 3.96 30.49 B- B3<br />
30 – 34 4.88 37.58 CCC+ Caa1<br />
25 – 29 5.56 42.81 CCC Caa2<br />
20 – 24 5.86 45.12 CCC- Caa3<br />
15 – 19 5.90 45.43 CCC- Caa3<br />
10 – 14 5.90 45.43 CC Ca<br />
5 – 9 5.90 45.43 CC Ca<br />
0 – 4 5.90 45.43 C C<br />
* <strong>The</strong> Estimated Probability of Default (EPD) represent a seventeen<br />
year average (1991-2007) observed in our PD Study. <strong>The</strong> temporal<br />
EPD column indicates default rates reflecting the peak year of<br />
defaults observed in the study. Please see the <strong>Rapid</strong> <strong>Ratings</strong> EPD<br />
Study and page 8 of this report for more information. ⁺ Please see<br />
<strong>Rapid</strong> <strong>Ratings</strong> | © All rights reserved <strong>Rapid</strong> <strong>Ratings</strong> International 2011 Page 1 of 8<br />
page 8.<br />
Contact Details:<br />
+1-646-233-4600 | information@rapidratings.com
Section 1: Executive Summary<br />
YOY credit quality has deteriorated: For the most recent<br />
period, the 12 months (rolling quarters) ended Nov 26,<br />
2011, Research In Motion Ltd has suffered a modest decline<br />
in financial health, as evidenced by a 4 point FHR decrease,<br />
largely reflecting deterioration in the company's<br />
performance in working capital efficiency, overall<br />
profitability, sales performance and cost structure. <strong>The</strong><br />
quarterly score change was a 2 point drop.<br />
However, still Low Risk: That said, the rating continues to<br />
depict a Low Risk credit profile as overall profitability and<br />
cost structure are at high levels relative to the global data<br />
set. <strong>The</strong>se areas represent key contributors to the overall<br />
strength of the company. Traditionally, the company has<br />
performed well in debt service management, overall<br />
profitability and cost structure.<br />
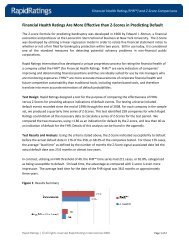
Figure 3: Non-linear Risk Scale<br />
Highest<br />
Default<br />
Risk<br />
Lowest<br />
0 10 20 30 40 50 60 70 80 90 100<br />
Financial Health Rating<br />
Figure 3 indicates observed default incidences across the<br />
complete spectrum of FHR levels.<br />
50% of defaults occurred with an FHR below 25, while 80% were<br />
below 40.<br />
FHR <strong>Report</strong><br />
Research In Motion Ltd, December 22, 2011<br />
Name: Research In Motion Ltd<br />
FHR: 81<br />
Risk Level: Low Risk<br />
Weaknesses: Research In Motion Ltd demonstrates<br />
weakness in leveraging and working capital efficiency<br />
relative to the global industry set, and has done so<br />
traditionally as well as currently.<br />
<strong>The</strong> cash flow story is good: Research In Motion Ltd was<br />
cash flow positive in the most recent period and levels were<br />
good. Cash flow coverage of capital expenditures was<br />
exceptionally strong, and free cash flow conversion levels of<br />
this magnitude often indicate a sound solvency profile.<br />
Significantly inconsistent history: From an historical<br />
perspective, Research In Motion Ltd has displayed a<br />
significantly inconsistent risk profile as the rating has moved<br />
within three different risk categories during the period (YE<br />
2004 - Q3 2012). Over that time the rating fluctuated from a<br />
high of 85 in FY 2011 to a low of 52 in FY 2005. YE 2005<br />
marked the inception of a sustained period of improvement<br />
lasting until 2011, as performance in overall profitability,<br />
sales performance and cost structure strengthened. During<br />
this period the rating rose from 52 to 84 as the company's<br />
risk profile strengthened, moving from the Medium Risk to<br />
the Low Risk Category. Research In Motion Ltd is currently<br />
an investment grade company.<br />
Exceptionally strong performance in generating returns:<br />
<strong>The</strong> Return on Capital Employed (ROCE) for the most recent<br />
period, which at 27.46% represents an exceptionally strong<br />
performance but is a dramatic decline as compared to the<br />
previous full year at 53.62%, is dramatically below the high<br />
point of 54.59% achieved in Q2 2011. <strong>The</strong> range over the<br />
past three years has been between 27.46% and 54.59%.<br />
<strong>The</strong> bottom line: Research In Motion Ltd is situated in our<br />
Low Risk group, displays strength in two of our six<br />
performance categories and demonstrates exceptionally<br />
strong performance in ROCE. This suggests that to those for<br />
whom Research In Motion Ltd represents an existing<br />
exposure, and/or for those considering Research In Motion<br />
Ltd as a new or increased exposure, such exposure<br />
represents a sound risk. However, the recent downgrade<br />
suggests increased analytical scrutiny would be appropriate.<br />
<strong>Rapid</strong> <strong>Ratings</strong> | © All rights reserved <strong>Rapid</strong> <strong>Ratings</strong> International 2011 Page 2 of 8
Section 2: DuPont Analysis<br />
Return on asset efficiency - an excellent performance<br />
Consistent with the <strong>Rapid</strong> <strong>Ratings</strong> methodological underpinning, focusing on efficiency across the analytics, we employ DuPont<br />
Analysis to distinguish between the company’s efficiency in generating profits, and in generating sales. This analysis generates<br />
ROCE - the return on capital employed - the primary Du Pont analysis result.¹<br />
In the four quarters ended November 26, 2011, Research In<br />
Motion Ltd had a ROCE of 27.46%, which is substantially<br />
above the generally accepted threshold range and indicates<br />
that the company is making efficient use of its assets. A top<br />
performing firm has a ROCE of at least 15 – 20%. General<br />
benchmark levels for profitability and activity are around<br />
10% and above 2.0, respectively (although these do vary,<br />
Section 3: FHR History and Performance Category Scores<br />
Table 3 presents the FHR and Performance Category Scores<br />
for Research In Motion Ltd. Each rating period is labeled<br />
with the financial period end of the most recent financial<br />
reports incorporated into that FHR, as well as the release<br />
date for the FHR. <strong>The</strong> lag between the two dates is primarily<br />
FHR <strong>Report</strong><br />
Research In Motion Ltd, December 22, 2011<br />
depending upon the industry). Research In Motion Ltd<br />
displays excellent performance levels in the profitability to<br />
sales ratio and very poor performance in activity. In the end,<br />
management succeeded in registering an excellent<br />
operational return on investment in total net assets during<br />
the period.<br />
due to the time required for the company to release its<br />
statements, and then for <strong>Rapid</strong> <strong>Ratings</strong> to incorporate the<br />
data and generate the FHR. For periods prior to the<br />
operation of <strong>Rapid</strong> <strong>Ratings</strong>, this lag is assumed to be 60 days<br />
for quarterly ratings and 90 days for YE ratings.<br />
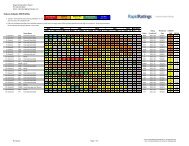
Table 3: Research In Motion Ltd's FHR Trend and Performance Category Scores, YE 2004 to Q3 2012<br />
Annual Quarterly<br />
YE<br />
2004<br />
YE<br />
2005<br />
YE<br />
2006<br />
YE<br />
2007<br />
YE<br />
2008<br />
YE<br />
2009<br />
YE<br />
2010<br />
Q3<br />
2011<br />
YE<br />
2011<br />
Q1<br />
2012<br />
Q2<br />
2012<br />
Q3<br />
2012<br />
Financial Period End 2/28 2/26 3/4 3/3 3/1 2/28 2/27 11/27 2/26 5/28 8/27 11/26<br />
Financial Health Rating 53 52 81 81 83 83 84 85 84 84 83 81<br />
Annual Delta -1 29 0 2 0 1 1 0 0 -2 -4<br />
Low Risk (80 – 100) Moderate Risk (60 – 79) Medium Risk (40 – 59) High Risk (20 – 39) Very High Risk (0 – 19)<br />
Performance Category Scores<br />
Sales Performance 23 23 37 44 53 59 59 62 61 61 58 58<br />
Overall Profitability 54 53 90 91 93 93 93 94 93 93 92 90<br />
Cost Structure 57 59 92 92 92 91 90 90 81 90 90 87<br />
Debt Service Management 86 86 n/a n/a n/a n/a n/a n/a 86 n/a n/a n/a<br />
Leveraging 20 20 20 20 20 20 20 20 20 20 20 20<br />
Working Capital Efficiency 28 28 23 23 23 24 26 33 31 27 28 28<br />
Note: n/a indicates that data and ratings for this period are not available. This is either due to critical errors in the financials for that period, or the company not reporting<br />
on a quarterly basis at that time.<br />
_____<br />
¹Formal economic value added analysis compares the DuPont results (ROCE) with the weighted average cost of capital (WACC) including both debt and equity. This<br />
analysis utilizes the weighted cost of borrowing (WCB) as it is readily calculated from corporate financials whereas WACC is not. <strong>The</strong>refore, as a benchmark, WCB imposes<br />
a minimum not a definitive standard.<br />
<strong>Rapid</strong> <strong>Ratings</strong> | © All rights reserved <strong>Rapid</strong> <strong>Ratings</strong> International 2011 Page 3 of 8
Section 4: <strong>The</strong> Deeper Dive: What We Like, What We Don't Like<br />
In this section, we take a closer look at Research In Motion Ltd, pinpointing current areas of notable strength and weakness in<br />
relation to past performance and in relation to other sector participants. <strong>The</strong> Sector Leaders and Sector Laggards indicate the<br />
performance of companies in the top and bottom tenth percentile of the sector for that performance measure.<br />
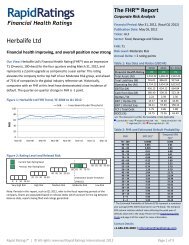
What We Like<br />
Overall Profitability (90): This score considers a wide variety of profitability measures, such as gross profitability, EBIT and<br />
others relative to revenues and several balance sheet items. Research In Motion Ltd outperformed 90% of its global reference<br />
set over the last 12 months ending November 26, 2011. This represents a modest decline from the prior year.<br />
Figure 4: Research In Motion Ltd's Overall Profitability Performance Score over time and Sector Measures for the Q3 2012<br />
period<br />
Performance Score<br />
100<br />
80<br />
60<br />
40<br />
20<br />
0<br />
May-04 May-05 May-06 May-07 May-08 May-09 May-10 May-11<br />
FHR <strong>Report</strong><br />
Research In Motion Ltd, December 22, 2011<br />
Cost Structure (87): <strong>The</strong> overall cost structure rating is based on a number of ratios incorporating variables such as cost of<br />
goods sold, staff costs, other operating expenditures, depreciation, interest expense, and corporate income tax relative to a<br />
base such as total revenue and total expenditures. Research In Motion Ltd's score, a modest decline from the prior year,<br />
depicts a very strong cost structure.<br />
Figure 5: Research In Motion Ltd's Cost Structure Performance Score over time and Sector Measures for the Q3 2012<br />
period<br />
Performance Score<br />
100<br />
80<br />
60<br />
40<br />
20<br />
0<br />
May-04 May-05 May-06 May-07 May-08 May-09 May-10 May-11<br />
<strong>Rapid</strong> <strong>Ratings</strong> | © All rights reserved <strong>Rapid</strong> <strong>Ratings</strong> International 2011 Page 4 of 8<br />
100<br />
80<br />
60<br />
40<br />
20<br />
0<br />
100<br />
80<br />
60<br />
40<br />
20<br />
0<br />
RIM Sector Average<br />
Sector Leaders Sector Laggards<br />
RIM Sector Average<br />
Sector Leaders Sector Laggards
What We Don't Like<br />
Leveraging (20): Substantially different from the traditional leverage view, the leverage rate utilizes a variety of measures to<br />
consider leverage largely from the perspective of balance sheet efficiency. Research In Motion Ltd's score, unchanged from<br />
the previous 12 months, depicts a company which performs better than only 20% of its global reference set.<br />
Figure 6: Research In Motion Ltd's Leveraging Performance Score over time and Sector Measures for the Q3 2012 period<br />
Performance Score<br />
100<br />
80<br />
60<br />
40<br />
20<br />
0<br />
May-04 May-05 May-06 May-07 May-08 May-09 May-10 May-11<br />
FHR <strong>Report</strong><br />
Research In Motion Ltd, December 22, 2011<br />
Working Capital Efficiency (28): This score measures management's success in working capital efficiency utilizing various<br />
measures of the current position in combination with other balance sheet and income statement elements. Moderately<br />
weaker than the prior year, the score indicates significant underperformance in this aspect of balance sheet management.<br />
Figure 7: Research In Motion Ltd's Working Capital Efficiency Performance Score over time and Sector Measures for the<br />
Q3 2012 period<br />
Performance Score<br />
100<br />
80<br />
60<br />
40<br />
20<br />
0<br />
May-04 May-05 May-06 May-07 May-08 May-09 May-10 May-11<br />
<strong>Rapid</strong> <strong>Ratings</strong> | © All rights reserved <strong>Rapid</strong> <strong>Ratings</strong> International 2011 Page 5 of 8<br />
100<br />
80<br />
60<br />
40<br />
20<br />
0<br />
100<br />
80<br />
60<br />
40<br />
20<br />
0<br />
RIM Sector Average<br />
Sector Leaders Sector Laggards<br />
RIM Sector Average<br />
Sector Leaders Sector Laggards
Section 5: Research In Motion Ltd Balance Sheet<br />
Table 4: Research In Motion Ltd balance sheet as of November 26, 2011<br />
FHR <strong>Report</strong><br />
Research In Motion Ltd, December 22, 2011<br />
(i(in USD B)<br />
Assets<br />
2004 2005 2006 2007 2008 2009 2010 2011 Q3 2012<br />
1. Bank, Cash Balances 1.16 0.61 0.46 0.68 1.18 0.84 1.55 1.79 1.12<br />
2. Accounts Receivable 0.10 0.21 0.32 0.57 1.17 2.11 2.59 3.96 3.93<br />
3. Total Inventories 0.04 0.09 0.13 0.26 0.40 0.68 0.62 0.62 0.87<br />
4. Prepayments – – – – – – – – –<br />
5. Other Current Assets 0.06 0.63 0.35 0.41 0.72 1.21 1.05 1.12 1.28<br />
6. Total Current Assets (1+2+3+4+5) 1.36 1.54 1.26 1.92 3.48 4.84 5.81 7.49 7.20<br />
7. Fixed Assets 0.15 0.21 0.33 0.49 0.71 1.33 1.96 2.50 2.73<br />
8. Financial Assets 0.34 0.75 0.61 0.43 0.74 0.72 0.96 0.58 0.20<br />
9. Intangible Assets 0.09 0.11 0.16 0.32 0.98 1.85 2.19 3.14 5.36<br />
10. Other Term Assets 0.00 0.00 -0.04 -0.07 -0.39 -0.65 -0.72 -0.84 -1.45<br />
11. Total Term Assets (7+8+9+10) 0.58 1.08 1.06 1.17 2.03 3.26 4.39 5.39 6.83<br />
12. Total Assets (6+11)<br />
Liabilities<br />
1.94 2.62 2.31 3.09 5.51 8.10 10.20 12.88 14.04<br />
13. Bank Overdraft 0.00 0.00 0.00 0.00 0.00 0.00 0.00 0.00 0.00<br />
14. Accounts Payable 0.04 0.07 0.09 0.13 0.27 0.45 0.62 0.83 0.97<br />
15. Debt owed within one year 0.00 0.00 0.00 0.00 0.00 0.00 0.00 0.00 0.00<br />
16. Short-Term Provisions 0.00 0.00 0.00 0.00 0.00 0.00 0.00 0.00 0.00<br />
17. Other Current Liabilities 0.17 0.56 0.19 0.42 1.20 1.67 1.82 2.80 2.59<br />
18. Total Current Liabilities (13+14+15+16+17) 0.21 0.63 0.28 0.55 1.47 2.12 2.43 3.63 3.56<br />
19. Term Loans 0.01 0.01 0.01 0.01 0.01 0.00 0.00 0.00 0.00<br />
20. Provisions – – – – – – – – –<br />
21. Deferred Taxation 0.00 0.00 0.03 0.04 0.06 0.09 0.14 0.28 0.26<br />
22. Other Term Liabilities 0.00 0.00 0.00 0.01 0.04 0.02 0.03 0.03 0.01<br />
23. Total Term Liabilities (19+20+21+22) 0.01 0.01 0.03 0.06 0.10 0.11 0.17 0.31 0.28<br />
24. Total Liabilities (18+23)<br />
Shareholders’ Equity<br />
0.22 0.64 0.32 0.61 1.58 2.23 2.60 3.94 3.84<br />
25. Retained Earnings -0.11 0.09 -0.10 0.35 1.68 3.55 5.23 6.58 7.78<br />
26. Subscribed Capital 1.83 1.89 2.10 2.14 2.25 2.33 2.37 2.36 2.42<br />
27. Minority Interests 0.00 0.00 0.00 0.00 0.00 0.00 0.00 0.00 0.00<br />
28. Other Equity Items 0.00 0.00 0.00 0.00 0.00 0.00 0.00 0.00 0.00<br />
29. Total Shareholders’ Equity<br />
(25+26+27+28)<br />
1.72 1.98 2.00 2.48 3.93 5.87 7.60 8.94 10.20<br />
<strong>Rapid</strong> <strong>Ratings</strong> | © All rights reserved <strong>Rapid</strong> <strong>Ratings</strong> International 2011 Page 6 of 8
Section 6: Research In Motion Ltd Income Statement<br />
FHR <strong>Report</strong><br />
Research In Motion Ltd, December 22, 2011<br />
Table 5: Research In Motion Ltd Income Statement for the 12 months ending November 26, 2011<br />
Note: <strong>Rapid</strong> <strong>Ratings</strong> employs a trailing 12 month perspective with regard to income statement data. Hence, the 2012 Q3<br />
period represents the sum of the four quarters ending with 2012 Q3.<br />
(in USD B)<br />
Revenue<br />
2004 2005 2006 2007 2008 2009 2010 2011 Q3 2012<br />
1. Sales Revenue 0.59 1.35 2.07 3.04 6.01 11.07 14.95 19.91 19.80<br />
2. Other Income 0.00 0.00 0.00 0.00 0.00 0.00 0.00 0.00 0.00<br />
3. Total Operating Revenue (1+2)<br />
Cost of Goods Sold<br />
0.59 1.35 2.07 3.04 6.01 11.07 14.95 19.91 19.80<br />
4. Cost of Goods Sold 0.35 0.67 0.98 1.46 3.04 6.16 8.68 11.52 12.71<br />
5. Gross Profit (1-4)<br />
Operating Expenditure<br />
0.24 0.68 1.09 1.58 2.97 4.90 6.27 8.39 7.09<br />
6. Salaries and Wages 0.00 0.00 0.00 0.00 0.00 0.00 0.00 0.00 0.00<br />
7. Depreciation 0.04 0.05 0.09 0.13 0.18 0.20 0.34 0.50 1.44<br />
8. Amortization 0.02 0.02 0.00 0.00 0.00 0.12 0.27 0.43 0.00<br />
9. Other Operating Expenditure 0.08 0.23 0.18 0.65 1.06 1.85 2.24 2.81 2.68<br />
10. Total Operating Expenditure<br />
(6+7+8+9)<br />
0.14 0.29 0.27 0.77 1.24 2.18 2.85 3.73 4.12<br />
11. Total Cash Expenditure 0.43 0.75 1.27 2.33 4.61 8.92 11.73 15.56 16.06<br />
12. Other Income (as per item 2) 0.00 0.00 0.00 0.00 0.00 0.00 0.00 0.00 0.00<br />
13. Abnormal Items -0.04 -0.35 -0.20 0.00 0.00 0.00 -0.02 -0.02 -0.09<br />
14. Other Operating Items (12 + 13) -0.04 -0.35 -0.20 0.00 0.00 0.00 -0.02 -0.02 -0.09<br />
15. Earnings Before Interest & Tax<br />
(5-10+14)<br />
Net Investment Income<br />
0.07 0.03 0.62 0.81 1.74 2.72 3.40 4.64 2.87<br />
16. Investment Income 0.01 0.04 0.07 0.05 0.08 0.08 0.03 0.01 0.02<br />
17. Interest Received – – – – – – – – –<br />
18. Interest Expense 0.00 0.00 – – – – – 0.00 –<br />
19. Other Investment Expense 0.04 0.00 0.20 0.00 0.01 0.00 0.16 0.00 0.00<br />
20. Net Investment Income Total<br />
(16+17-18-19)<br />
-0.02 0.04 -0.14 0.05 0.07 0.08 -0.14 0.01 0.02<br />
21. Net Profit Before Tax<br />
(NPBT; 15+20)<br />
0.05 0.07 0.48 0.86 1.81 2.80 3.27 4.64 2.89<br />
22. Company Tax Expense 0.00 -0.14 0.11 0.23 0.52 0.91 0.81 1.23 0.67<br />
23. Net Profit After Tax (NPAT; 21-22) 0.05 0.21 0.37 0.63 1.29 1.89 2.46 3.41 2.22<br />
24. Minority Interests 0.00 0.00 0.00 0.00 0.00 0.00 0.00 0.00 –<br />
25. Net Extraordinary Income 0.00 0.00 0.00 0.00 0.00 0.00 0.00 0.00 0.00<br />
26. Net Surplus (23-24+25) 0.05 0.21 0.37 0.63 1.29 1.89 2.46 3.41 2.22<br />
<strong>Rapid</strong> <strong>Ratings</strong> | © All rights reserved <strong>Rapid</strong> <strong>Ratings</strong> International 2011 Page 7 of 8
Contact Details<br />
Head Office<br />
86 Chambers Street, Suite 701<br />
New York, NY 10007<br />
Ph: +1.646.233.4600<br />
Fax: +1.646.219.7460<br />
Rating Equivalency Scale<br />
FHR<br />
Range<br />
EPD<br />
(%)*<br />
Temporal<br />
EPD (%)*<br />
Explanation<br />
Rating equivalents<br />
Moody’s⁺ S&P⁺<br />
*<strong>The</strong> EPDs (estimated probabilities of<br />
default) for each rating notch<br />
represent a seventeen year average<br />
95-100 0.0006 0.005 Minimal Risk of non-payment and insolvency Aaa AAA<br />
(1991-2007) and may be adjusted by<br />
<strong>Rapid</strong> <strong>Ratings</strong> customers to reflect<br />
90-94 0.001 0.01 Exceptionally Low Risk Aa1/Aa2 AA+/AA temporal assumptions. <strong>The</strong> temporal<br />
85-89 0.005 0.04 Very Low Risk Aa3 AAadjustment<br />
shown reflects the<br />
highest year of defaults observed in<br />
80-84 0.01 0.08 Low Risk A1/A2 A+/A our study, 2001.<br />
75-79 0.04 0.31 Moderate to Low Risk and somewhat subject to fluctuations in market conditions A3 A-<br />
70-74 0.08 0.62 Generally Moderate Risk Baa1/Baa2<br />
65-69 0.22 1.69 Moderate Risk / subject to market conditions: investment grade threshold at 65 Baa3 BBB-<br />
60-64 0.42 3.23 Moderate Risk that can worsen with market conditions Ba1 BB+<br />
55-59 0.74 5.70 Medium to Moderate Risk and generally subject to market fluctuations Ba2 BB<br />
50-54 1.26 9.70 Generally Medium Risk Ba3 BB-<br />
45-49 2.04 15.71 Medium Risk / more subject to market conditions B1 B+<br />
40-44 2.94 22.64 Medium Risk that can worsen with market conditions B2 B<br />
35-39 3.96 30.49<br />
Medium to Moderately High Risk and very subject to fluctuations in market<br />
conditions<br />
BBB+/<br />
BBB<br />
B3 B-<br />
30-34 4.88 37.58 Moderately High Risk / Increasingly At Risk Caa1 CCC+<br />
25-29 5.56 42.81 High Risk Caa2 CCC<br />
20-24 5.86 45.12 High Risk of non-payment Caa3 CCC-<br />
15-19 5.90 45.43 High Risk of failure which is unlikely to improve with better market conditions Caa3 CCC-<br />
10-14 5.90 45.43 Very High potential for payment default Ca CC<br />
5-9 5.90 45.43 Still trading but likely under extreme pressure Ca CC<br />
0-4 5.90 45.43 Still trading but possibly insolvent C C<br />
This table shows the equivalents in<br />
the rating levels for the corporate<br />
ratings scale of <strong>Rapid</strong> <strong>Ratings</strong>,<br />
Standard and Poor's and Moody's .<br />
While we are confident that there is a<br />
reasonable degree of accuracy across<br />
the rating levels that we have aligned,<br />
the approach is not scientific and it<br />
could be argued that there are other<br />
similar or proximate alignments that<br />
might also be acceptable. <strong>The</strong> credit<br />
rating equivalents table is not<br />
intended to imply that there is any<br />
correlation between the rating system<br />
and methodology of <strong>Rapid</strong> <strong>Ratings</strong><br />
and the rating systems and<br />
methodologies of Standard & Poor's<br />
or Moody's Investors Services, or that<br />
any other rating agencies would rate<br />
a company at the same level as <strong>Rapid</strong><br />
<strong>Ratings</strong>.<br />
⁺ S&P and Moody's are trademarks of<br />
their respective companies.<br />
While the <strong>Rapid</strong> <strong>Ratings</strong> scale appears to be linear, this is not really the case. Owing to the way the statistical distributions underlying the models for each sector have been constructed,<br />
and the sector specific-weights for each variable, companies make non-linear movements over time on <strong>Rapid</strong> <strong>Ratings</strong>' scale. <strong>The</strong> <strong>Rapid</strong> <strong>Ratings</strong>’ probability of default (PD) model<br />
originally showed a downward slope in default probabilities for all companies in the last 20 rating points on the bottom of the rating scale (i.e. in the very high risk category). This reveals<br />
that some very weak companies continue to survive while many companies in their cohort have defaulted. To facilitate modeling by clients, <strong>Rapid</strong> <strong>Ratings</strong> has capped the PD at the peak<br />
so that client models can fully reflect the underlying risk but avoid getting caught up in the reality of weak survivors.<br />
Disclaimer: A Financial Health Rating (FHR) or equity recommendation from <strong>Rapid</strong> <strong>Ratings</strong> is not a recommendation or opinion that is intended to substitute for a financial advisor's or<br />
investor's independent assessment of whether to buy, sell or hold any financial products. <strong>The</strong> FHR is a statement of opinion derived objectively through our software from public<br />
information about the relevant entity. This information and the related FHR’s and related analysis provided in the reports by <strong>Rapid</strong> <strong>Ratings</strong> do not represent an offer to trade in<br />
securities. <strong>The</strong> research information contained therein is an objective and independent reference source, which should be used in conjunction with other information in forming the basis<br />
for an investment decision. <strong>Rapid</strong> <strong>Ratings</strong> believes that all of its reports are based on reliable data and information, but <strong>Rapid</strong> <strong>Ratings</strong> has not verified this or obtained an independent<br />
verification to this effect. <strong>Rapid</strong> <strong>Ratings</strong> provides no guarantee with respect to the accuracy or completeness of the data relied upon, nor the conclusions derived from the data. Each<br />
FHR is a relative, probabilistic assessment of the credit risk of the relevant entity and its potential to meet financial obligations. It is not a statement that default will or will not occur<br />
given that circumstances change and management can adopt new strategies. <strong>Report</strong>s have been prepared at the request of, and for the purpose of, the subscribers to our service only,<br />
and neither <strong>Rapid</strong> <strong>Ratings</strong> nor any of our employees accept any responsibility on any ground whatsoever, including liability in negligence, to any other person. Finally, <strong>Rapid</strong> <strong>Ratings</strong><br />
and its employees accept no liability whatsoever for any direct, indirect or consequential loss of any kind arising from the use of its ratings and rating research in any way whatsoever,<br />
unless <strong>Rapid</strong> <strong>Ratings</strong> is negligent in misinterpreting or manipulating the data, in which case, our maximum liability to our client is the amount of our fee for the report.<br />
Industry: <strong>The</strong> <strong>Rapid</strong> <strong>Ratings</strong> Industry Classification for this company is IND_604.<br />
Data Source: Bloomberg<br />
Feedback<br />
FHR <strong>Report</strong><br />
Research In Motion Ltd, December 22, 2011<br />
<strong>Rapid</strong> <strong>Ratings</strong> appreciates all comments and suggestions. We use this<br />
information to drive our product development pipeline as we strive to<br />
continually enhance your risk assessment and mitigation practices.<br />
Feedback can be submitted at www.rapidratings.com/feedback<br />
<strong>Rapid</strong> <strong>Ratings</strong> | © All rights reserved <strong>Rapid</strong> <strong>Ratings</strong> International 2011 Page 8 of 8