The FHR™ Report - Rapid Ratings
The FHR™ Report - Rapid Ratings
The FHR™ Report - Rapid Ratings

You also want an ePaper? Increase the reach of your titles
YUMPU automatically turns print PDFs into web optimized ePapers that Google loves.
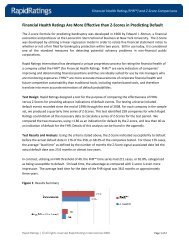
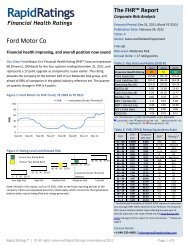
Section 4: <strong>The</strong> Deeper Dive: What We Like, What We Don't Like<br />
In this section, we take a closer look at Research In Motion Ltd, pinpointing current areas of notable strength and weakness in<br />
relation to past performance and in relation to other sector participants. <strong>The</strong> Sector Leaders and Sector Laggards indicate the<br />
performance of companies in the top and bottom tenth percentile of the sector for that performance measure.<br />
What We Like<br />
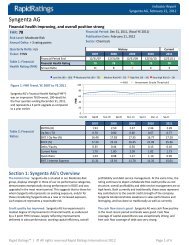
Overall Profitability (90): This score considers a wide variety of profitability measures, such as gross profitability, EBIT and<br />
others relative to revenues and several balance sheet items. Research In Motion Ltd outperformed 90% of its global reference<br />
set over the last 12 months ending November 26, 2011. This represents a modest decline from the prior year.<br />
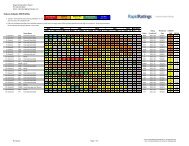
Figure 4: Research In Motion Ltd's Overall Profitability Performance Score over time and Sector Measures for the Q3 2012<br />
period<br />
Performance Score<br />
100<br />
80<br />
60<br />
40<br />
20<br />
0<br />
May-04 May-05 May-06 May-07 May-08 May-09 May-10 May-11<br />
FHR <strong>Report</strong><br />
Research In Motion Ltd, December 22, 2011<br />
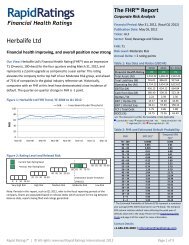
Cost Structure (87): <strong>The</strong> overall cost structure rating is based on a number of ratios incorporating variables such as cost of<br />
goods sold, staff costs, other operating expenditures, depreciation, interest expense, and corporate income tax relative to a<br />
base such as total revenue and total expenditures. Research In Motion Ltd's score, a modest decline from the prior year,<br />
depicts a very strong cost structure.<br />
Figure 5: Research In Motion Ltd's Cost Structure Performance Score over time and Sector Measures for the Q3 2012<br />
period<br />
Performance Score<br />
100<br />
80<br />
60<br />
40<br />
20<br />
0<br />
May-04 May-05 May-06 May-07 May-08 May-09 May-10 May-11<br />
<strong>Rapid</strong> <strong>Ratings</strong> | © All rights reserved <strong>Rapid</strong> <strong>Ratings</strong> International 2011 Page 4 of 8<br />
100<br />
80<br />
60<br />
40<br />
20<br />
0<br />
100<br />
80<br />
60<br />
40<br />
20<br />
0<br />
RIM Sector Average<br />
Sector Leaders Sector Laggards<br />
RIM Sector Average<br />
Sector Leaders Sector Laggards