2011 annual results - Investors - RBS.com
2011 annual results - Investors - RBS.com
2011 annual results - Investors - RBS.com
Create successful ePaper yourself
Turn your PDF publications into a flip-book with our unique Google optimized e-Paper software.
Highlights<br />
<strong>2011</strong> <strong>results</strong> summary (continued)<br />
Efficiency (continued)<br />
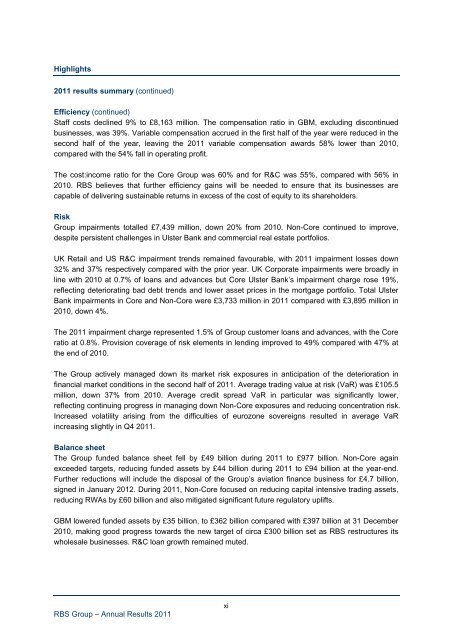
Staff costs declined 9% to £8,163 million. The <strong>com</strong>pensation ratio in GBM, excluding discontinued<br />
businesses, was 39%. Variable <strong>com</strong>pensation accrued in the first half of the year were reduced in the<br />
second half of the year, leaving the <strong>2011</strong> variable <strong>com</strong>pensation awards 58% lower than 2010,<br />
<strong>com</strong>pared with the 54% fall in operating profit.<br />
The cost:in<strong>com</strong>e ratio for the Core Group was 60% and for R&C was 55%, <strong>com</strong>pared with 56% in<br />
2010. <strong>RBS</strong> believes that further efficiency gains will be needed to ensure that its businesses are<br />
capable of delivering sustainable returns in excess of the cost of equity to its shareholders.<br />
Risk<br />
Group impairments totalled £7,439 million, down 20% from 2010. Non-Core continued to improve,<br />
despite persistent challenges in Ulster Bank and <strong>com</strong>mercial real estate portfolios.<br />
UK Retail and US R&C impairment trends remained favourable, with <strong>2011</strong> impairment losses down<br />
32% and 37% respectively <strong>com</strong>pared with the prior year. UK Corporate impairments were broadly in<br />
line with 2010 at 0.7% of loans and advances but Core Ulster Bank’s impairment charge rose 19%,<br />
reflecting deteriorating bad debt trends and lower asset prices in the mortgage portfolio. Total Ulster<br />
Bank impairments in Core and Non-Core were £3,733 million in <strong>2011</strong> <strong>com</strong>pared with £3,895 million in<br />
2010, down 4%.<br />
The <strong>2011</strong> impairment charge represented 1.5% of Group customer loans and advances, with the Core<br />
ratio at 0.8%. Provision coverage of risk elements in lending improved to 49% <strong>com</strong>pared with 47% at<br />
the end of 2010.<br />
The Group actively managed down its market risk exposures in anticipation of the deterioration in<br />
financial market conditions in the second half of <strong>2011</strong>. Average trading value at risk (VaR) was £105.5<br />
million, down 37% from 2010. Average credit spread VaR in particular was significantly lower,<br />
reflecting continuing progress in managing down Non-Core exposures and reducing concentration risk.<br />
Increased volatility arising from the difficulties of eurozone sovereigns resulted in average VaR<br />
increasing slightly in Q4 <strong>2011</strong>.<br />
Balance sheet<br />
The Group funded balance sheet fell by £49 billion during <strong>2011</strong> to £977 billion. Non-Core again<br />
exceeded targets, reducing funded assets by £44 billion during <strong>2011</strong> to £94 billion at the year-end.<br />
Further reductions will include the disposal of the Group’s aviation finance business for £4.7 billion,<br />
signed in January 2012. During <strong>2011</strong>, Non-Core focused on reducing capital intensive trading assets,<br />
reducing RWAs by £60 billion and also mitigated significant future regulatory uplifts.<br />
GBM lowered funded assets by £35 billion, to £362 billion <strong>com</strong>pared with £397 billion at 31 December<br />
2010, making good progress towards the new target of circa £300 billion set as <strong>RBS</strong> restructures its<br />
wholesale businesses. R&C loan growth remained muted.<br />
<strong>RBS</strong> Group – Annual Results <strong>2011</strong><br />
xi


