2011 annual results - Investors - RBS.com
2011 annual results - Investors - RBS.com
2011 annual results - Investors - RBS.com

You also want an ePaper? Increase the reach of your titles
YUMPU automatically turns print PDFs into web optimized ePapers that Google loves.
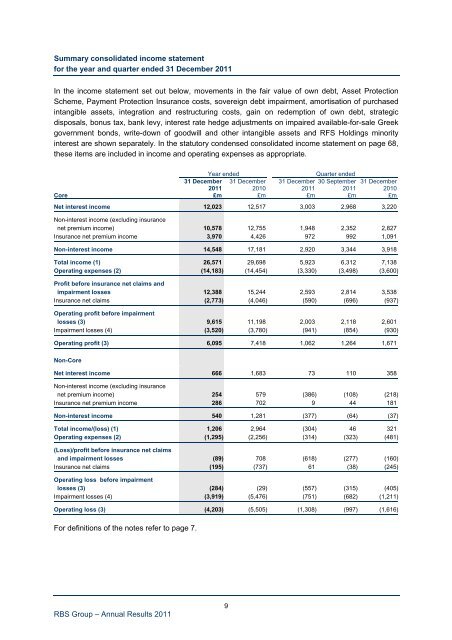
Summary consolidated in<strong>com</strong>e statement<br />
for the year and quarter ended 31 December <strong>2011</strong><br />
In the in<strong>com</strong>e statement set out below, movements in the fair value of own debt, Asset Protection<br />
Scheme, Payment Protection Insurance costs, sovereign debt impairment, amortisation of purchased<br />
intangible assets, integration and restructuring costs, gain on redemption of own debt, strategic<br />
disposals, bonus tax, bank levy, interest rate hedge adjustments on impaired available-for-sale Greek<br />
government bonds, write-down of goodwill and other intangible assets and RFS Holdings minority<br />
interest are shown separately. In the statutory condensed consolidated in<strong>com</strong>e statement on page 68,<br />
these items are included in in<strong>com</strong>e and operating expenses as appropriate.<br />
Year ended Quarter ended<br />
31 December 31 December 31 December 30 September 31 December<br />
<strong>2011</strong><br />
2010<br />
<strong>2011</strong> <strong>2011</strong> 2010<br />
Core £m £m £m £m £m<br />
Net interest in<strong>com</strong>e 12,023 12,517 3,003 2,968 3,220<br />
Non-interest in<strong>com</strong>e (excluding insurance<br />
net premium in<strong>com</strong>e) 10,578 12,755 1,948 2,352 2,827<br />
Insurance net premium in<strong>com</strong>e 3,970 4,426 972 992 1,091<br />
Non-interest in<strong>com</strong>e 14,548 17,181 2,920 3,344 3,918<br />
Total in<strong>com</strong>e (1) 26,571 29,698 5,923 6,312 7,138<br />
Operating expenses (2) (14,183) (14,454) (3,330) (3,498) (3,600)<br />
Profit before insurance net claims and<br />
impairment losses 12,388 15,244 2,593 2,814 3,538<br />
Insurance net claims (2,773) (4,046) (590) (696) (937)<br />
Operating profit before impairment<br />
losses (3) 9,615 11,198 2,003 2,118 2,601<br />
Impairment losses (4) (3,520) (3,780) (941) (854) (930)<br />
Operating profit (3) 6,095 7,418 1,062 1,264 1,671<br />
Non-Core<br />
Net interest in<strong>com</strong>e 666 1,683 73 110 358<br />
Non-interest in<strong>com</strong>e (excluding insurance<br />
net premium in<strong>com</strong>e) 254 579 (386) (108) (218)<br />
Insurance net premium in<strong>com</strong>e 286 702 9 44 181<br />
Non-interest in<strong>com</strong>e 540 1,281 (377) (64) (37)<br />
Total in<strong>com</strong>e/(loss) (1) 1,206 2,964 (304) 46 321<br />
Operating expenses (2) (1,295) (2,256) (314) (323) (481)<br />
(Loss)/profit before insurance net claims<br />
and impairment losses (89) 708 (618) (277) (160)<br />
Insurance net claims (195) (737) 61 (38) (245)<br />
Operating loss before impairment<br />
losses (3) (284) (29) (557) (315) (405)<br />
Impairment losses (4) (3,919) (5,476) (751) (682) (1,211)<br />
Operating loss (3) (4,203) (5,505) (1,308) (997) (1,616)<br />
For definitions of the notes refer to page 7.<br />
<strong>RBS</strong> Group – Annual Results <strong>2011</strong><br />
9