Correct calculation of Dirichlet polygon areas - Chemical Ecology
Correct calculation of Dirichlet polygon areas - Chemical Ecology
Correct calculation of Dirichlet polygon areas - Chemical Ecology

You also want an ePaper? Increase the reach of your titles
YUMPU automatically turns print PDFs into web optimized ePapers that Google loves.
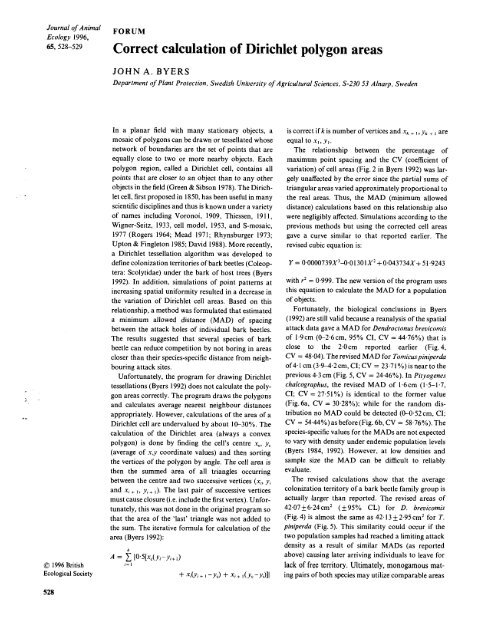
Journal <strong>of</strong> Animal<strong>Ecology</strong> 1996,FORUM<strong>Correct</strong> <strong>calculation</strong> <strong>of</strong> <strong>Dirichlet</strong> <strong>polygon</strong> <strong>areas</strong>JOHN A. BYERSDepartment <strong>of</strong> Plant Protection, Swedish University <strong>of</strong> Agricultural Sciences, S-230 53 Alnarp, SwedenIn a planar field with many stationary objects, amosaic <strong>of</strong> <strong>polygon</strong>s can be drawn or tessellated whosenetwork <strong>of</strong> boundaries are the set <strong>of</strong> points that areequally close to two or more nearby objects. Each<strong>polygon</strong> region, called a <strong>Dirichlet</strong> cell, contains allpoints that are closer to an object than to any otherobjects in the field (Green & Sibson 1978). The <strong>Dirichlet</strong>cell, first proposed in 1850, has been useful in manyscientific disciplines and thus is known under a variety<strong>of</strong> names including Voronoi, 1909, Thiessen, 19 1 1,Wigner-Sei tz, 1933, cell model, 1953, and S-mosaic,1977 (Rogers 1964; Mead 1971; Rhynsburger 1973;Upton & Fingleton 1985; David 1988). More recently,a <strong>Dirichlet</strong> tessellation algorithm was developed todefine colonization territories <strong>of</strong> bark beetles (Coleoptera:Scolytidae) under the bark <strong>of</strong> host trees (Byers1992). In addition, simulations <strong>of</strong> point patterns atincreasing spatial uniformity resulted in a decrease inthe variation <strong>of</strong> <strong>Dirichlet</strong> cell <strong>areas</strong>. Based on thisrelationship, a method was formulated that estimateda minimum allowed distance (MAD) <strong>of</strong> spacingbetween the attack holes <strong>of</strong> individual bark beetles.The results suggested that several species <strong>of</strong> barkbeetle can reduce competition by not boring in <strong>areas</strong>closer than their species-specific distance from neighbowingattack sites.Unfortunately, the program for drawing <strong>Dirichlet</strong>tessellations (Byers 1992) does not calculate the <strong>polygon</strong><strong>areas</strong> correctly. The program draws the <strong>polygon</strong>sand calculates average nearest neighbour distancesappropriately. However, <strong>calculation</strong>s <strong>of</strong> the area <strong>of</strong> a<strong>Dirichlet</strong> cell are undervalued by about 1G30%. The<strong>calculation</strong> <strong>of</strong> the <strong>Dirichlet</strong> area (always a convex<strong>polygon</strong>) is done by finding the cell's centre .u,, y,(average <strong>of</strong> x,y coordinate values) and then sortingthe vertices <strong>of</strong> the <strong>polygon</strong> by angle. The cell area isthen the summed area <strong>of</strong> all triangles occurringbetween the centre and two successive vertices (xi, y,and x, + , , y, + ,). The last pair <strong>of</strong> successive verticesmust causeclosure (i.e. include the first vertex). Unfortunately,this was not done in the original program sothat the area <strong>of</strong> the 'last' triangle was not added tothe sum. The iterative formula for <strong>calculation</strong> <strong>of</strong> thearea (Byers 1992):kA = C IO.~[.L(Y~-Y;+ L)0 1996 British i= IEcological Society + "h'i+ I -YJ + Xi+ I(Y,-Y~)]~is correct if k is number <strong>of</strong> vertices and xk + ,, yk + areequal to I,, y, .The relationship between the percentage <strong>of</strong>maximum point spacing and the CV (coefficient <strong>of</strong>variation) <strong>of</strong> cell <strong>areas</strong> (Fig. 2 in Byers 1992) was largelyunaffected by the error since the partial sums <strong>of</strong>triangular <strong>areas</strong> varied approximately proportional tothe real <strong>areas</strong>. Thus, the MAD (minimum alloweddistance) <strong>calculation</strong>s based on this relationship alsowere negligibly affected. Simulations according to theprevious methods but using the corrected cell <strong>areas</strong>gave a curve similar to that reported earlier. Therevised cubic equation is:with r2 = 0.999. The new version <strong>of</strong> the program usesthis equation to calculate the MAD for a population<strong>of</strong> objects.Fortunately, the biological conclusions in Byers(1992) are still valid because a reanalysis <strong>of</strong> the spatialattack data gave a MAD for Dendroctonus brevicomis<strong>of</strong> 1.9cm (G2.6 cm, 95% CI, CV = 44.76%) that isclose to the 2.0cm reported earlier (Fig.4,CV = 48.04). The revised MAD for Tomicuspiniperda<strong>of</strong>4 I cm (3.94.2 cm, CI; CV = 23.71 %) is near to theprevious 4.3 cm (Fig. 5, CV = 24.46%). In Pityogeneschalcographus, the revised MAD <strong>of</strong> 1.6cm (1.5-1.7,CI; CV = 27.51%) is identical to the former value(Fig. 6a, CV = 30.28%); while for the random distributionno MAD could be detected (0452cm, CI;CV = 54.44%) as before (Fig. 6b, CV = 58.76%). Thespecies-specific values for the MADS are not expectedto vary with density under endemic population levels(Byers 1984, 1992). However, at low densities andsample size the MAD can be difficult to reliablyevaluate.The revised <strong>calculation</strong>s show that the averagecolonization territory <strong>of</strong> a bark beetle family group isactually larger than reported. The revised <strong>areas</strong> <strong>of</strong>42.O7f 6-24cm2 (f 95% CL) for D. brevicomis(Fig. 4) is almost the same as 42 13 + 2.95 cm2 for T.piniperda (Fig. 5). This similarity could occur if thetwo population samples had reached a limiting attackdensity as a result <strong>of</strong> similar MADS (as reportedabove) causing later arriving individuals to leave forlack <strong>of</strong> free territory. Ultimately, monogamous matingpairs <strong>of</strong> both species may utilize comparable <strong>areas</strong>
529J.A . Byers<strong>of</strong> the bark because they are closely related species(Hylesininae, Tribe Tomicini), are alike in size (5 mmlong, lOmg fresh weight), and feed on the phloem <strong>of</strong>similar host trees (Ponderosa and Scots pines, respectively).The colonization territory <strong>of</strong> P. chalcographus(Scolytinae) is smaller at 8.5f 0.5cm2 probably dueto the beetle's smaller resource requirements (its sizeis only 2mm long, I mg weight), although severalfemales may occupy the area with a single male. Thesame density for a random distribution <strong>of</strong> points (fromFig. 6b) gave an average cell area <strong>of</strong> 8.35+0.!Xcm2.The undervalued cell <strong>areas</strong> were not discoveredsooner because one usually tessellates within an innerborder to avoid 'edge effects'. Thus, the total area <strong>of</strong>the <strong>polygon</strong>s is variable and difficult to verify.However, the program can be used to place 50 pointsin an area <strong>of</strong> 100 units on a side, without any innerborder, causing the <strong>polygon</strong>s to fill the arena. theaverage cell area reported with the revised methodand these parameters is, as expected, equal to 1002/50or 200 units.The corrected version <strong>of</strong> the <strong>Dirichlet</strong> program is.available by sending a formatted 3.5' or 5'IBM diskto the author. The s<strong>of</strong>tware also can be downloadedfrom the Internet (http://alyssum.stud.slu.se:8001/ReferencesByers, J.A. (1984) Nearest neighbor analysis and simulation<strong>of</strong> distribution patterns indicates an attack spacing mechanismin the bark beetle, Ips typographus (Coleoptera:Scolytidae). Environmental Entomology, 13, 1 191-1200.Byers, J.A. (1992) <strong>Dirichlet</strong> tessellation <strong>of</strong> bark beetle spatialattack points. Journal <strong>of</strong> Animal <strong>Ecology</strong>, 61. 759-768.David, C.W. (1988) Voronoi polyhedra as structure probesin large molecular systems. VII. Channel identification.Computers and Chemistry, 12, 207-208.Green, P.J. & Sibson, R. (1978) Computing <strong>Dirichlet</strong> tessellationsin the plane. Computer Journal, 21, 168-173.Mead, R. (1971) Models for interplant competition in irregularlydistributed populations. Statistical <strong>Ecology</strong> Vol. 2(eds G. P. Patil, E. C. Pielou & W. E. Waters), pp. 13-30.Penn State University Press, University Park, USA.Rhynsburger, D. (1973) Analytic delineation <strong>of</strong> Thiessen<strong>polygon</strong>s. Geographical Analysis, 5, 1 33- 144.Rogers, C.A. (1964) Packing and Covering. CambridgeTracts in Mathematics and Mathematical Physics. No. 54,Cambridge University Press, Cambridge, UK.Upton, G. & Fingleton, B. (1985) Spatial Data Analysis byExample, Vol. I. John Wiley and Sons, New York, USA.Received 24 January 1996; revision received 7 February I9961996 BritishEcological Society,Journal <strong>of</strong> Animal<strong>Ecology</strong>, 65.528-529