EFFECTIVE ATTRACTION RADIUS: A Method ... - Chemical Ecology
EFFECTIVE ATTRACTION RADIUS: A Method ... - Chemical Ecology
EFFECTIVE ATTRACTION RADIUS: A Method ... - Chemical Ecology

Create successful ePaper yourself
Turn your PDF publications into a flip-book with our unique Google optimized e-Paper software.
Journal of <strong>Chemical</strong> <strong>Ecology</strong>, Vol. 15, No. 2, 1989<br />
A<br />
<strong>EFFECTIVE</strong> <strong>ATTRACTION</strong> <strong>RADIUS</strong>:<br />
<strong>Method</strong> for Comparing Species Attractants<br />
Determining Densities of Flying Insects<br />
and<br />
JOHN A. BYERS, OLLE ANDERBRANT, and JAN LOFQVIST<br />
Department of <strong>Ecology</strong>, University of Lund<br />
S-223 62 Lund, Sweden<br />
(Received October 15, 1987; accepted February 23, 1988)<br />
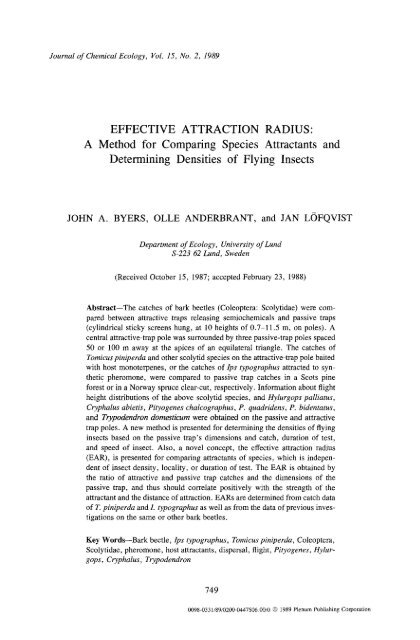
Abstract--The catches of bark beetles (Coleoptera: Scolytidae) were compared<br />
between attractive traps releasing semiochemicals and passive traps<br />
(cylindrical sticky screens hung, at 10 heights of 0.7-11.5 m, on poles). A<br />
central attractive-trap pole was surrounded by three passive-trap poles spaced<br />
50 or 100 m away at the apices of an equilateral triangle. The catches of<br />
Tomicus piniperda and other scolytid species on the attractive-trap pole baited<br />
with host monoterpenes, or the catches of Ips typographus attracted to synthetic<br />
pheromone, were compared to passive trap catches in a Scots pine<br />
forest or in a Norway spruce clear-cut, respectively. Information about flight<br />
height distributions of the above scolytid species, and Hylurgops palliatus,<br />
Cryphalus abietis, Pityogenes chalcographus, P. quadridens, P. bidentatus,<br />
and Trypodendron domesticum were obtained on the passive and attractive<br />
trap poles. A new method is presented for determining the densities of flying<br />
insects based on the passive trap's dimensions and catch, duration of test,<br />
and speed of insect. Also, a novel concept, the effective attraction radius<br />
(EAR), is presented for comparing attractants of species, which is independent<br />
of insect density, locality, or duration of test. The EAR is obtained by<br />
the ratio of attractive and passive trap catches and the dimensions of the<br />
passive trap, and thus should correlate positively with the strength of the<br />
attractant and the distance of attraction. EARs are determined from catch data<br />
of T. piniperda and L typographus as well as from the data of previous investigations<br />
on the same or other bark beetles.<br />
Key Words--Bark beetle, lps typographus, Tomicus piniperda, Coleoptera,<br />
Scolytidae, pheromone, host attractants, dispersal, flight, Pityogenes, Hylurgops,<br />
Cryphalus, Trypodendron<br />
749<br />
0098-0331/89/0200-0447506.00/0 9 1989 Plenum Publishing Corporation
750 BYERS ET AL.<br />
INTRODUCTION<br />
It is of ecological interest to determine the relative abundance of flying insects<br />
at various heights above ground. Also, such knowledge should be considered<br />
when using pheromone traps at certain heights for monitoring the abundance of<br />
a pest species. Information concerning the density of flying insects (per volume<br />
air or per area over land) is often required to build models of host and/or mate<br />
location, dispersal, and disease vector relationships. It is also of interest in<br />
chemical ecology to be able to compare the attractivities of various attractants<br />
of different strengths or blends within a species as well as between species at<br />
different times or under different environmental conditions. For instance, one<br />
question might be whether host attractants are relatively as attractive to one<br />
species, which does not employ long-range pheromones [Tomicus piniperda<br />
(L.); Byers et al., 1985], as are pheromone components to another species lips<br />
typographus (L.); Schylter et al., 19871.<br />
We present a method that provides information helpful for a better understanding<br />
of the above three topics: flight height, flight density, and comparison<br />
of attractant strengths both within and between species. The method involves<br />
comparing the catches of flying insects, exemplified by bark beetles, that are<br />
passively intercepted by cylindrical sticky screens suspended at various heights<br />
above ground on 12-m poles to the catches of these insects attracted to attractants<br />
released from sticky-screen traps on a similar pole in the same area.<br />
METHODS AND MATERIALS<br />
It is obvious that passive insect traps placed at various heights above ground<br />
will catch the proportion of insects flying at each of the respective heights.<br />
However, we believe such an arrangement of traps can also be used to determine<br />
with reasonable success the average densities of insects flying in the vicinity<br />
of the traps. Cylindrical sticky screens in the forest can be considered as<br />
"filtering" or intercepting bark beetles that fly or are carried through the area<br />
during their dispersal and host- and mate-seeking flight. If one had a cylindrical<br />
trap as long as a standing tree, or at least sample traps at many heights encompassing<br />
most of the levels of flight activity, then one can consider this system<br />
in a two-dimensional sense. The trap then can be visualized as a circle on a<br />
plane surface. The trap (or circle) then will catch an average number that is<br />
dependent on the trap's diameter (2 x radius), time length of trapping, average<br />
speed of flying beetles, and the density of flying beetles (number per area) as<br />
shown in equation 1:<br />
Catch = 2 x radius • time x speed x density (1)
<strong>EFFECTIVE</strong> <strong>ATTRACTION</strong> <strong>RADIUS</strong> AND FLIGHT DENSITIES 751<br />
However, if the passive sticky traps with a certain radius are placed in the forest<br />
for a specific time and catch, and we assume an average flight speed (either<br />
from observations of flying beetles or assuming a flight speed equal to the wind<br />
speed), then the density can be determined:<br />
Density = catch/(2 x radius x time x speed) (2)<br />
Passive and attractive (attractant releasing) traps can also be used in a new<br />
concept and method, the effective attraction radius (EAR), for comparing semiquantitatively<br />
the attraction distances of attractants both within and between<br />
species of insects. A maximum possible distance of attraction can be imagined<br />
with the earlier concept of the active space, in which a time-averaged volume<br />
(plume) containing above-behavioral-threshold semiochemical concentrations<br />
elicits attraction responses when entered by the insect (Bossert and Wilson,<br />
1963; Nakamura and Kawasaki, 1977; Baker and Roelofs, 1981; Elkinton and<br />
Card6, 1984). This concept can be modified to an attraction space to find distances<br />
from the source within which, for example, 50 % of the entering insects<br />
are successful in finding the source. The average distance of attraction is another<br />
measurement which may be of interest. We now introduce a new concept, the<br />
EAR, which is equivalent to the distance from an attractive source within which<br />
all insects are assumed to be attracted. The EAR is the radius of a circular plane<br />
oriented perpendicular to the incoming insects and thus can be regarded as the<br />
radius of a spherical volume that surrounds the attractive source:<br />
EAR = (ATC x LCSAPT x PTC -1 • 7['--1) l/2 (3)<br />
where ATC is the attractive trap catch, PTC is the passive trap catch, and<br />
LCSAPT is the longitudinal cross-sectional area of the passive trap.<br />
It is probable that "all" insects are never attracted to semiochemicals if<br />
within a specific distance of the source, and thus the EAR is not a "real"<br />
biological distance. However, the EAR does have positive relationships to the<br />
"real" maximum, 50 % responding, and average distances of attraction as mentioned<br />
in the concepts above. While the active space model, the attraction space<br />
model, or the average attraction distance cannot be investigated easily with trap<br />
catches (Elkinton and Card6, 1984), the EAR can be found in a straightforward<br />
manner by simple comparison of two trap catches. For example, if a passive<br />
trap area in longitudinal cross section, A, containing no attractants, intercepts<br />
X number of beetles per time unit, and if, in the same vicinity, a similar trap<br />
containing attraetant catches 20X beetles per time unit, then the effective area<br />
(longitudinal cross section) of the attractive trap is 20 times larger than the<br />
passive trap, and the EAR = (20A/Tr) 1/2. This ratio of catch between the passive<br />
and attractive traps should remain similar regardless of the density of flying<br />
beetles, so consistent measurements of the EAR can be obtained on different
752 BYERS ET AL.<br />
dates or in different areas. The type and strength of attractant should be the<br />
most important factor in affecting the ratio.<br />
To demonstrate our ideas concerning measurement of flight density and<br />
EAR, we placed metal poles holding cylindrical sticky screens at 10 levels<br />
(from 0.7 to 11.5 m) in or near the forest. Three poles with passive traps were<br />
positioned at the apices of an equilateral triangle while a fourth pole with attractive<br />
traps (host attractants or pheromone) was placed in the center of the triangle.<br />
Each pole was 12 m high and constructed of four 28-mm diameter steel<br />
tubes (3 m long) interconnected and held upright by two sets of four guy wires<br />
attached at 6- and 12-m heights. At the top of each pole was a 30-cm ann with<br />
pulley which suspended a string of 10 cylindrical sticky screens so that they<br />
could be drawn up or down the pole between test periods. Each sticky screen<br />
was 30 cm tall by 15 cm radius (LCSAPT of 0.09 m 2) of 6.5-mm square mesh<br />
coated with Stikem Special (Seabright Enterprises, Emeryville, California).<br />
The attraction of Tomicus piniperda (L.), the European pine shoot beetle,<br />
and associated bark beetles to host monoterpenes (Byers et al., 1985) was investigated<br />
using the poles inside a Scots pine (Pinus sylvestris L.) forest, 60 years<br />
old, near Angelholm, Sweden (April-May 1984). The passive poles were 50 m<br />
from the central attractive pole, forming a triangle of 87 m on a side. Each<br />
tubular trap had two open polyethylene vials (No. 730 Kartell, Italy), 30 mm<br />
x 6-mm ID, for each of the host monoterpenes, (+)-o~-pinene (99 % pure by<br />
GLC; [0/]546 20 ~- +57.4~ (-)-0/-pinene (>99.5% GLC; [0/]546 20 = -50 + _ 1~<br />
(+)-3-carene (>99% GLC; [0/]20 = 17 ___ 0.5~ and terpinolene (>97.3%<br />
GLC). <strong>Chemical</strong>s were from Fluka AG, West Germany, and Carl Roth, Sweden.<br />
Each trap released about 10-20 mg/day of each of the monoterpenes except<br />
for about 3-5 mg/day of terpinolene (these rates are equivalent to that released<br />
from a freshly cut Scots pine log, 28 cm x 15 cm diam.; Byers et al., 1985).<br />
Flight characteristics of Ips typographus (L.), the European spruce bark<br />
beetle, were similarly studied within a year-old clear-cut area adjacent to Norway<br />
spruce [Picea abies (L.) Karst.] forest in Esmm forest district, near Hiller~d,<br />
Denmark (May 1984). The passive poles were positioned 100 m from<br />
the central attractive pole in the corners of a triangle 173 m on a side. These<br />
distances between passive and attractive trapping poles were chosen because<br />
trap and semiochemical interactions are minimal (Schlyter et al., 1987; Byers,<br />
1987) while population levels of flying beetles are still expected to be rather<br />
uniform within this area. Each cylindrical trap on the attractive pole had two<br />
pheromone dispensers, which released 5 mg/day of 2-methyl-3-buten-2-ol and<br />
0.1 mg/day of (4S)-cis-verbenol (Schlyter et al., 1987). Trapping in both areas<br />
was done in the afternoon for the time periods and dates as shown in Table 1.<br />
Wind speeds were taken with a fan anemometer. Bark beetles of all species<br />
caught on the sticky traps during each period were removed at the end of the<br />
test time, cleaned in petroleum ether, and sex determined for T. piniperda and<br />
L typographus.<br />
Since it is possible that too small an active trap would catch a dispropor-
<strong>EFFECTIVE</strong> <strong>ATTRACTION</strong> <strong>RADIUS</strong> AND FLIGHT DENSITIES 753<br />
TABLE 1. NUMBER OF BARK BEETLES CAUGHT ON PASSIVE AND ACTIVE STICKY-<br />
SCREEN TRAPS~ TRAPPING PERIODS, AND WIND SPEEDS USED TO CALCULATE EARs OF<br />
BAITS AND DENSITIES OF FLYING BEETLES a<br />
Beetles caught<br />
Flying beetles/hectare estimated<br />
Trapping<br />
from passive trap poles<br />
Date Passive Active Wind duration EAR b<br />
1984 traps traps (m/sec) (min) (m) A B C Average<br />
Tomicus piniperda c<br />
April 15 7 27 32)<br />
May 22 17 215 1.56 135 0.85 (148) f 32 90<br />
~Densities were calculated from equation 2 using trapping durations as shown and beetles were<br />
assumed to fly at the respective wind speeds (catch = actual catch • 4 to correct for incomplete<br />
trapping surfaces).<br />
bBased on average catch of passive trap poles.<br />
CDensities of flying beetles based on observed flight speed of 1.6 m/sec; attraction of beetles to<br />
host monoterpene mixture.<br />
dDensities of flying beetles based on wind speeds; attraction of beetles to pheromone components.<br />
Pole blown down during experiment.<br />
fBeetle density actually measured at center location, while pheromone bait was at position B.<br />
tionately small number attracted to the source and thus adversely affect measurement<br />
of the EAR, we tested four trap sizes each with the same pheromone<br />
bait as above on L typographus. Cylindrical sticky screens were similar to those<br />
above and of the same length (30 cm) but varied in radius, at 3.75, 7.5, 15,<br />
and 30 cm. These traps were each held at 1.5 m height by wires from a 22-<br />
mm-diam, steel tube driven into the ground. Two sets of each of the four sizes<br />
were tested in May and June of 1984 and 1985 for a total of 21 replicates with<br />
rotation among positions. Linear and logarithmic regressions of the total catches<br />
and of the proportions among trap sizes at each trap radius were compared.<br />
RESULTS<br />
Height above Ground of Flying Bark Beetles. Catches of bark beetles by<br />
the passive sticky screens indicate that most species fly above 0.7 m (the lowest<br />
trap level), are most abundant at 1.9-5.5 m, and gradually fly less frequently<br />
at still higher levels (Figures 1 and 2). This pattern is shown best by Hylurgops<br />
palliatus Gyll., Pityogenes bidentatus Hbst., P. quadridens Hart., Trypoden-
754 BYERS ET AL.<br />
Hylurgops pallia/us<br />
m<br />
a11.5]<br />
Passive 1110.31 Attractive<br />
n=86 9 9.1i n=29<br />
9<br />
7 . 9 i<br />
mm 6.7i<br />
m 5.5i<br />
i 4.3 i=<br />
i<br />
3 . 1 1 i<br />
1 . 9 i<br />
.7i<br />
i i i i i = i i i i<br />
40 20 0 0 20 40<br />
Trypodendron domest/cum<br />
m<br />
11.5<br />
Passive 10.3 Attractive<br />
n=17 9.11 n=5<br />
7.91<br />
6.71<br />
5.51<br />
4 . 3 i<br />
IBm . 7 8<br />
f I I I I I I I I I<br />
40 20 0 0 20 40<br />
Pityogenes chaloographus<br />
m<br />
mm 11.5|<br />
Passive 9 Attractive<br />
n=84 B 9.1in=22<br />
7.9=<br />
mm 6.7i<br />
m ~ 5,5i<br />
m 4,3~<br />
BiB 3,1i<br />
m 1.9~<br />
.7i<br />
i i i i i i i i i i<br />
40 20 0 0 2O 40<br />
PERCENT OF TOTAL CATCH<br />
Cryphalus abie Pus<br />
m<br />
| 11.5 I<br />
Passive I 10.3 I Attractive<br />
n=242 I<br />
m<br />
m<br />
m<br />
i<br />
i i i i I<br />
40 20 0<br />
9.1 a n=98<br />
7.9m<br />
6.7l<br />
5.5a<br />
4.3m~<br />
3 , 1 B<br />
1 . 9 B<br />
.7mmm<br />
I ! I I I<br />
0 20 40<br />
Pityogenes b/denta tus<br />
m<br />
11.5<br />
Passive 10.3 Attract<br />
n=23 9.1<br />
7.9<br />
me 6.7<br />
9 5.5<br />
I I I I I<br />
40 20 0<br />
4.3<br />
n=6<br />
3.1<br />
1.9 mmmmmmm<br />
.7<br />
ive<br />
I I I I I<br />
0 20 40<br />
Pityogenes quadridens<br />
m<br />
t 11.5<br />
BB<br />
Passive = 10.3 = Attractive<br />
n=50 ii 9.1 II n=24<br />
= 7.9 mmmimmm<br />
mm 6.7 9<br />
i 5.5<br />
mm 43__<br />
3.1<br />
1.9<br />
BB<br />
I I I I I<br />
40 20 0<br />
.7<br />
I I I I I<br />
0 20 40<br />
PERCENT OFTOTALCATCH<br />
FIG. 1. Height of flying bark beetles as percent of total catch on passive sticky-screen<br />
traps or "attractive" sticky-screen traps releasing host monoterpenes at each level [(+)-<br />
c~-pinene, (-)-a-pinene, (+)-3-carene each at 10-20 mg/day and 3-5 mg/day of terpinolene].<br />
Passive traps at each height on three 12-m poles were spaced 50 m away from<br />
a central active trap pole in Scots pine forest (May 1, 1984).
<strong>EFFECTIVE</strong> <strong>ATTRACTION</strong> <strong>RADIUS</strong> AND FLIGHT DENSITIES 755<br />
Passive<br />
n=lO<br />
I<br />
Tom/cus<br />
I<br />
BB<br />
r--Bin<br />
m<br />
piniporda<br />
m<br />
11.5<br />
10.3<br />
9.1<br />
7.9<br />
6.7<br />
5.5<br />
4.3<br />
3.1<br />
1.9<br />
.7<br />
Attractive<br />
| n=48<br />
[]<br />
[]<br />
I f I I I i I I<br />
2O 0 0 20 40<br />
PERCENT OF TOTAL CATCH<br />
I<br />
60<br />
I<br />
~S f yp o_Grap h u s<br />
m<br />
Pass i ve I~ 11.5<br />
n=103 P'~ ~10"3<br />
.1<br />
I<br />
.9<br />
~ 6.7<br />
5.5<br />
4.3<br />
~ 3.1<br />
1.9<br />
.7<br />
-1<br />
20 0<br />
PERCENT OF TOTAL CATCH<br />
At tract i ve<br />
n=740<br />
I I I I I I I<br />
0 20 40 60<br />
FIG. 2. Height of flying bark beetles as percent of total catch on passxve sticky-screen<br />
traps or attractive sticky-screen traps releasing host monoterpene attractants (T. piniperda)<br />
or pheromone components (I. typographus). Placement of trap poles was as in<br />
Figure 1 for T. piniperda (April 15 and 21, 1984). For I. typographus the passive poles<br />
were spaced 100 m away from the attractive pole in a clear-cut of Norway spruce forest<br />
(May 17, 19, 20-22, 1984). Monoterpene attractant release as in Figure 1, while the<br />
pheromone components, 2-methyl-3-butene-2-ol and cis-verbenol, were released at 5<br />
and 0.1 rag/day, respectively, at each trap level.<br />
dron domesticum L. (although catch was low), and L typographus. P. chalcographus<br />
L. and T. piniperda also did not fly near the ground but they seemed<br />
to exhibit a more uniform distribution of flight heights (Figures 1 and 2),<br />
although the numbers for T. piniperda are too low for reliable estimates.
756 BYERS ET AL.<br />
Most of the distributions of beetles at the heights seemed unaffected by<br />
semiochemicals since chi-square comparisons of the passive and attactive distributions<br />
yielded no significant differences for each species (P > 0.1) except<br />
for P. quadridens (P < 0.05), T. piniperda (P < 0.05), and L typographus<br />
(P < 0.001). However, the distributions of P. quadridens on the attractive<br />
traps is based on a low number, and it is difficult to explain the pattern. The<br />
pattern of T. piniperda is also based on low numbers, but it is consistent with<br />
the pattern for L typographus in which attractive pheromone traps catch proportionately<br />
more beetles on the lowest traps (Figure 2).<br />
Density of Flying Bark Beetles. The number of bark beetles caught on<br />
passive and attractive sticky-screen traps, trapping periods, and speeds of beetles<br />
(either observed or assumed to be equal to the measured wind speed) were<br />
used to calculate the densities of flying beetles per hectare in the level from 0<br />
to 12 m using equation 2 and multiplying by 4 to account for the gaps between<br />
traps (Table 1). The densities of flying beetles (per hectare) were estimated for<br />
each trap pole on each day for T. piniperda and L typographus (Table 1) and<br />
for six other species of bark beetle (Table 2) to indicate the variation in density<br />
with respect to time, area of forest, and species.<br />
TABLE 2. DENSITIES OF FLYING BARK BEETLES IN SCOTS PINE FOREST NEAR<br />
ANGELHOLM, SWEDEN, DURING AFTERNOONS (1330-1730 Hr) OF SPRING DAYS AS<br />
ESTIMATED FROM PASSIVE STICKY SCREENS ON 12-M POLES a<br />
Flying beetles per hectare estimated from<br />
trap poles<br />
Species A B C Average<br />
April 15, 1984<br />
Hylurgops palliatus 52 179 81 104<br />
Trypodendron domesticum 6 29 17 17<br />
April 21, 1984<br />
Hylurgops palliatus 6 29 98 44<br />
Trypodendron domesticum 6 6 12 8<br />
May 1, 1984<br />
Hylurgops palliatus 12 23 17 17<br />
Trypodendron domesticum 6 12 6 8<br />
Pityogenes chalcographus 174 87 226 162<br />
Pityogenes quadridens 116 81 93 97<br />
Pityogenes bidentatus 52 75 6 44<br />
Cryphalus abietis 307 729 365 467<br />
a Densities were calculated from equation 2, where trapping was for 4 hr; all species were assumed<br />
to fly at 1.6 m/sec as observed for T. piniperda; and catch = actual catch • 4 to correct for<br />
incomplete trapping surfaces.
<strong>EFFECTIVE</strong> <strong>ATTRACTION</strong> <strong>RADIUS</strong> AND FLIGHT DENSITIES 757<br />
Tomicus piniperda ~s typographus<br />
m<br />
11.5 [] Effective ~<br />
10.3<br />
9.1<br />
7.9<br />
6.7<br />
5.5<br />
at<br />
Attraction<br />
of<br />
Radius<br />
(EAR)<br />
Baits<br />
10 Levels<br />
4.3<br />
lm<br />
3.1<br />
1.9<br />
.7<br />
FIG. 3. Comparisons of the effective attraction radii (EAR) of attractive, monoterpenereleasing,<br />
sticky-screen traps (T. piniperda) or of pheromone-releasing, sticky-screen<br />
traps (I. typographus). Release of semiochemieals as in Figures 1 and 2.<br />
Effective Attraction Radius for Comparing Attractants of Insects. The average<br />
of EARs for the traps on the entire trap pole in both T. piniperda and L<br />
typographus were similar as were the EAR estimates for each day (Table 1).<br />
The lowest EARs for L typographus were correlated with the highest wind<br />
speeds (Table 1). The EAR was largest at the bottom trap level for both species,<br />
and it was larger for the pheromone compared to host monoterpenes at the dosages<br />
used (Figure 3). At other levels, the EARs were similar within a species<br />
as well as between the two species. The sticky-screen traps of increasing radius<br />
(3.75-30 cm) caught increasing numbers of beetles in a logarithmic relationship<br />
(Figure 4). This curve may be expected if beetles have increasing difficulty<br />
finding a point source of pheromone (i.e., must turn more rapidly than possible<br />
near the source). The coefficient of determination (0.97) was larger than that<br />
for a linear relationship (r 2 = 0.90).<br />
DISCUSSION<br />
Height above Ground of Flying Bark Beetles. Several studies have investigated<br />
the height at which a particular species of bark beetle flies. However,<br />
most of these studies have used only: (1) traps with pheromone, (2) traps at just
758 BYERS ET AL.<br />
I---<br />
"t-<br />
O<br />
(J<br />
400<br />
300<br />
tO<br />
u.1<br />
_J<br />
I--<br />
I.LI<br />
U.I<br />
200<br />
100<br />
0 I I I I I 1<br />
0 10 20 30 40 50 60<br />
TRAP RAD I US (cm)<br />
FIG. 4. Logarithmic relationship between number of I. typographus caught on pheromone<br />
baits and increasing radius of the sticky-screen trap at 1.5-m height. Traps released<br />
5 mg/day of 2-methyl-3-butene-2-ol and 0.1 mg/day of cis-verbenol. The encircled point<br />
shows the size of trap used in the attractive and passive pole experiments.<br />
a few levels, (3) traps at widely spaced levels (up to 150 m height), or (4) traps<br />
that collected beetles for several months. Our 10 passive traps from 0.7 to 11.5<br />
m high appeared sufficient to determine with some precision the distribution of<br />
flight heights over the normal flight range for H. palliatus, Cryphalus abietis<br />
Ratz., T. domesticum, P. bidentatus, P. quadridens, and L typographus but<br />
not, apparently, for P. chalcographus and T. piniperda (Figures 1 and 2). The<br />
catch for T. piniperda was too low to reliably estimate the distribution. On the<br />
other hand, P. chaIcographus exhibited a uniform distribution, except at the<br />
bottom level, which probably indicates they were flying also at higher levels<br />
than the range of traps, as if they were dispersing through the pine forest (a<br />
nonhost tree).<br />
In one of the first studies of flight-height distribution in bark beetles, Gara<br />
and Vit6 (1962) used rotary net traps to suggest that no differences in flight<br />
activity of Dendroctonus brevicomis LeConte and other bark beetles occurred<br />
from ground level to lower crown regions, but "in the upper crown and above<br />
forest stands, bark beetles seemed to fly less frequently." Shore and McLean<br />
(1984) found Trypodendron lineatum O1. responded over 76 days to lineatinbaited<br />
traps at 0-, 1-, 2-, 3-, and 4-m heights with most (31.6%) caught on the<br />
1-m trap at the level just above the underbrush (effectively the lowest trap). The
<strong>EFFECTIVE</strong> <strong>ATTRACTION</strong> <strong>RADIUS</strong> AND FLIGHT DENSITIES 759<br />
highest catch on the "lowest" trap of a column of traps releasing semiochemicals<br />
is the same result we found for T. piniperda and I. typographus (Figure<br />
2). It is possible that these high catches on the lowest trap were due either (1)<br />
to beetles flying lower in order to avoid flying against higher wind speeds, (2)<br />
to increasing inability to orient to the source at higher levels due to relatively<br />
stronger, more turbulent wind or a decrease in the optomotor response further<br />
from the ground, or (3) to the absence of a visual silhouette (tree) in conjunction<br />
with odor stimuli, and thus they were trying to land on a fallen tree.<br />
Schmitz (1980) intercepted L pini Say as they flew to a source of naturally<br />
produced pheromone (0- to 2-m height) by four columns, one in each cardinal<br />
direction, of 11 flat sticky traps from 2 to 17 m high about 45 m from the source.<br />
He found most beetles flew below 10 m as they approached the source. However,<br />
these results cannot be compared either to our passive trap catches or to<br />
our column of semiochemical release.<br />
Cuthbert and Peacock (1975) placed flat sticky traps baited either with<br />
multilure or not at about 3.5-, 7-, and 12-m heights in healthy or diseased elm<br />
trees. They found that Scolytus multistriatus Marsh. was caught predominantly<br />
at the 3.5-m height in baited or unbaited traps, a result similar to our studies.<br />
Forsse and Solbreck (1985) placed suction traps at 2, 9, 43, and 93 m on a TV<br />
tower and caught L typographus only at 2 and 9 m. They report that the densityheight<br />
profile of all bark beetle species caught (Solbreck, 1985) indicates that<br />
less than 14 % of any species flies above 20 m. Using a similar regression technique<br />
(exponential without 0.7-m height for all r 2 > 0.78), we predict that<br />
87 % of L typographus fly between 1 and 11.5 m high of all those flying up to<br />
100 m high. Similarly, 84% ofH. palliatus, 89% of C. abietis, and 89% of P.<br />
quadridens fly below 11.5-m height.<br />
Duelli et al. (1986) placed pheromone traps near passive traps at nine<br />
heights from 1.7 to 150 m on a weather tower and found that less than 5% of<br />
L typographus fly above 10 m. In contrast, P. chalcographus had a more gradual<br />
decrease in proportion, flying at higher levels (14 % flew higher than 10 m),<br />
which is similar to our results for this species (Figure 1). However, their results<br />
on the passive catches are uncertain because complete or partial pheromone<br />
blends were placed at the same heights on the tower as were the passive traps.<br />
Density of Flying Bark Beetles. The density of flying insects can be determined<br />
either by active methods, whereby suction fans or rotary nets capture<br />
insects, or by passive methods such as our sticky traps. Our investigation is the<br />
first to use such passive methods to determine densities of flying beetles, but<br />
the results of previous studies can be reanalyzed according to equation 2 for<br />
comparison. However, studies that report catches of bark beetles in barrier traps<br />
are less accurate for this purpose because beetles may avoid them due to air<br />
turbulences or may recover their balance after striking the barrier (Chapman
760 BYERS ET AL.<br />
and Kinghom, 1958). Also, a conversion from the width of flat traps to a diameter<br />
(2 x radius) for tubular traps must be done according to the average trap<br />
interception area:<br />
2 • radius = 2 x width * 7r -1 f cos A = 0.637 • width<br />
Thus, assuming a 5-hr flight for each day of a 37-day test and 2 m/sec speed<br />
of beetle or wind, then Cuthbert and Peacock (1975) had a density of flying S.<br />
multistriatus in the healthy elms (0-12 m height) of 1/hectare and in the diseased<br />
elms of 2069/hectare. The results of Schmitz (1980) for I. pini can be<br />
similarly adjusted to yield an average density of 43/hectare (0- to 17-m height)<br />
at 45 m away from a source of pheromone. Byers et al. (1985) report a catch<br />
of 52 T. piniperda on two blank sticky traps (25 cm diam.) for 15 hr (time<br />
unpublished) during the maximum swarming, which yields about 401 flying<br />
beetles per hectare (0-.10 m), clearly a higher population level than that in Table<br />
1.<br />
Our method of flight density estimation assumes that beetles do not avoid,<br />
or are attracted to, the passive traps and thus cause us to under- or overestimate<br />
the population level. Nijholt (1983) questioned whether sticky-screen traps<br />
appear transparent to bark beetles because he found a nonrandom distribution<br />
of catch on a 60 x 80-cm-wide screen held 60 cm above ground. The average<br />
catch of the peripheral areas of the trap was less than the center. However, it<br />
is possible that through the beetles' movements to free themselves from the<br />
stickem, they gradually slid down the sticky screens so that the top periphery<br />
of the trap was depleted of beetles over time, thus accounting for the difference.<br />
Furthermore, the bottom area may have caught less beetles simply because fewer<br />
beetles fly near the ground.<br />
Bark beetles are known to respond to visual silhouettes of the size of a tree<br />
trunk often in combination with attractive semiochemicals (Tilden et al., 1983;<br />
Borden et al., 1986; Payne, 1986). The resolving power of insect eyes depends<br />
on the number of facets and the ommatidial angle. Insects with higher visual<br />
acuities have higher numbers of ommatidia; the eye of the lamellicom beetle<br />
Polyphylla fullo has 12,150 facets, the housefly about 4000, and dragonflies<br />
about 10,000-28,000 (Wigglesworth, 1972). Bark beetles are known to have<br />
rather low acuity, which is explained by the low number of ommatidia. Using<br />
scanning electron micrographs of several genera of Scolytidae, we found that<br />
the eyes of all species have similar low numbers of ommatidia. For example,<br />
I. typographus has 215 facets per eye, T. piniperda also has 215, Scolytus laevis<br />
Chap. has 235, and P. chalcogaphus only 110. In comparison, the bark beetle<br />
predator, Thanasimusformicarius (L.) (Cleridae), has 610 facets per eye, and<br />
the cerambycid, Acanthocinus aedilis (L.), has about 650.<br />
Our sticky-screen traps were at least 75 % transparent while Stikem Special
<strong>EFFECTIVE</strong> <strong>ATTRACTION</strong> <strong>RADIUS</strong> AND FLIGHT DENSITIES 761<br />
is translucent, thus, the traps are similar to spider webs, which are effective in<br />
catching insects with moderate to poor visual acuity. Therefore, it is probable<br />
that the bark beetle species collected neither were attracted to nor avoided the<br />
visual outlines of the sticky traps.<br />
As mentioned above, capture methods have usually been used to estimate<br />
flight densities. Chapman and Kinghorn (1958) used 6 m/sec rotary nets 2 m<br />
above log piles during spring swarming of 7". lineatum to find maximum densities<br />
of 1.521/m 3. This value can be converted to densities for a 0- to 12-m<br />
layer (182,520/hectare) or for a 0- to 3-m layer (45,630/hectare). Forsse and<br />
Solbreck (1985) used suction traps that generated an airflow of 1.67 m3/sec to<br />
capture bark beetles at four heights. However, estimation of densities from this<br />
method is doubtful as insects are only captured when very near the suction inlet.<br />
This distance of capture is hard to estimate because it is different for every<br />
insect, depending on their size and speed (Leos-Martinez et al., 1986).<br />
The results of our passive sticky-screen catches indicate that at the densities<br />
we measured, few trees in the forest would escape being closely passed by<br />
or landed upon by the common bark beetle species. This is in accordance with<br />
findings for D. ponderosae Hopkins (Burnell, 1977; Raffa and Berryman, 1980;<br />
Hynum and Berryman, 1980), showing that beetles land on most trees in the<br />
forest and that this pattern can result from randomly flying beetles. Primary<br />
attraction indicating more susceptible hosts to 7". piniperda (Byers et al., 1985)<br />
would thus not need to reach very far (on the order of our EARs) to attract the<br />
pioneer beetles. If the host conditions were suitable, these pioneers could generate<br />
aggregation pheromone (although this does not appear to be the case for<br />
T. piniperda) or increase the release of the primary attractants through boring<br />
activities (secondary attraction).<br />
Effective Attraction Radius for Comparing Attractants of Insects. Vit6 and<br />
Gara (1962) hypothesized that the number of bark beetle attacks in a source of<br />
attractant influenced the distance over which beetles were drawn, but few experiments<br />
have tested this or determined the distance-concentration relationship.<br />
Using rotary-net traps at the pheromone source and at 15 and 30 m away, Vit6<br />
and Gara (1962) showed that L paraconfusus Lanier were attracted from at least<br />
15 m away to the infested logs. Possibly even at 30 m there was an increased<br />
capture rate, but control data were not presented to establish a difference. Byers<br />
(1983) used a grid of passive sticky traps in three rows distant from a pheromone<br />
source of L paraconfusus to show that "wild" beetles of both sexes were<br />
attracted from at least as far away as 18 m. While an average or a maximum<br />
attraction distance must exist for each specific attractant/species combination,<br />
they are difficult to determine, as noted above. On the other hand, the EAR is<br />
easy to establish and yields an index of the attraction distance so that comparisons<br />
can be made between different times, areas, semiochemical releases, and<br />
insect species.
762 BYERS ET AL.<br />
EARs were calculated at 10 heights for T. piniperda attraction to monoterpenes<br />
released equivalent to a "small log" (28 cm x 13 cm diam.; Byers et<br />
al., 1985) and for L typographus attraction to "medium" levels (Schlyter et<br />
al., 1987) of pheromone (Figure 3). However, these estimates at different<br />
heights may have been greatly influenced by semiochemical interactions between<br />
traps. It would be interesting to test only one pair of traps alone at each of the<br />
levels to see how this affects the EARs. The EAR estimates for T. piniperda<br />
appear similar to those that can be obtained from the data of Byers et al. (1985)<br />
for a small log (EAR = 0.59 m) or a 30 male + 30 female infested log (EAR<br />
= 0.65 m) or small log-equivalent in monoterpene release (EAR = 0.91 m)<br />
and check log (EAR = 1.02 m) at 1.5 m height.<br />
Our EAR estimates for L typographus were probably affected by the higher<br />
than usual wind speeds in the clear-cut (Figure 3, Table 1). Schlyter et al.<br />
(1987) compared a "high" dose (10 X "medium") of L typographus pheromone<br />
to a blank, 12 m away at 1.5-m height, and so we can calculate an EAR<br />
of 1.90 m, and for their "medium" dose an EAR of 0.57 m. If the blank had<br />
been placed further away, so as not to intercept any pheromone-responding<br />
beetles, then the EAR estimate would have been higher and more appropriate.<br />
Thus, as expected, higher release rates of pheromone have higher EARs. Similar<br />
procedures can be used to calculate EARs on previous work that used sticky<br />
traps. For example, Byrne et al. (1974) used sticky traps to catch 6724 Gnathotrichus<br />
sulcatus on two sulcatol-baited traps (each releasing 48-240/zg/day)<br />
versus 51 on two control traps (0.0954 m 2 interception area), which yields an<br />
EAR of 2.00 m.<br />
An EAR can be calculated for any semiochemical and responding insect<br />
species if the passive trap effectively "filters" the flying population according<br />
to the trap's size (sticky traps). However, the attractive trap, while not needing<br />
to be of the same type or dimension as the passive trap, does need to (1) effectively<br />
catch a significant proportion of the insects responding and (2) be similar<br />
or smaller in size than the passive trap in order to obtain consistent EARs for a<br />
particular chemical-insect combination. The trapping efficiencies (percentage<br />
of beetles contacting the trap that are caught) of the passive and attractive traps<br />
within a test pair would not affect the EAR, as long as the efficiencies were<br />
similar. The efficiencies could even be different on different occasions and not<br />
change the EAR unless the efficiencies change disproportionately between the<br />
passive and attractive traps.<br />
Trap size does effect trapping efficiency since Tilden et al. (1979) showed<br />
that many more D. brevicomis were attracted to the vicinity of a pheromone<br />
source and small surrounding trap than were caught on this trap. EAR estimates<br />
obtained by increasing the passive and attractive trap radius would tend to<br />
increase as a function of the trapping efficiency (size) of the attractive trap
<strong>EFFECTIVE</strong> <strong>ATTRACTION</strong> <strong>RADIUS</strong> AND FLIGHT DENSITIES 763<br />
(Figure 4). Thus, the question arises: how does one determine the optimal size<br />
of attractive trap to obtain consistent and maximum EAR estimates<br />
Ideally, one should compare several attractive traps of increasing radii to<br />
determine the function of trapping efficiency with trap size and the effect on the<br />
EAR. In this way, the appropriate trap size can be determined that yields a<br />
consistent and nearly maximum EAR, with a minimum of trap size for practical<br />
reasons. In I. typographus (Figure 4), we found that little further benefit in<br />
maximizing the EAR estimate is gained with increasingly larger attractive traps<br />
beyond 15- to 30-cm radius (we used the 15-cm radius on the poles), while<br />
there are increasing costs of further enlargements of trap radius. It can also be<br />
seen in Figure 4 that L typographus seem to find it increasingly more difficult<br />
to locate pheromone sources that are much smaller than the diameter of a tree.<br />
We predict that such curves for moth species will be shifted to the left on the x<br />
axis, indicative of the smaller target of a female moth.<br />
Several environmental factors will influence the active space (Elkinton and<br />
Card6, 1984), as well as the EAR, such as temperature, wind speed, and their<br />
variation over time. However, these parameters are rather consistent when bark<br />
beetles are responding to semiochemicals. For valid EAR measurements, the<br />
height of the passive and attractive traps should be the same but the level is, in<br />
theory, not too important as different heights would appear as tests at different<br />
densities of flying beetles, which has little effect on the EAR. However, our<br />
measured EARs at different heights indicate that height may be important either<br />
due to windy conditions, response variation with height, or trap interactions.<br />
Thus, it appears that EAR estimates for a particular species should be qualified<br />
by specifying the height of the attractive and passive traps, the release rate<br />
of the semiochemical, and the sizes of the traps. Since most pheromone catches<br />
of scolytids have been done at the 1.5-m height, and we obtained the largest<br />
EAR at about this level, we think this level is appropriate for interspecific comparisons.<br />
Acknowledgments--This work was supported in part by grants from Sweden, STU (84-3937)<br />
and others, NFR, FRN, and SJFR; and from the USA, NSF (INT-8503520). We are grateful to<br />
E. Jirle, J. J6nsson, E. Marling, and B. Hansson for help in setting up the poles in the field. E.<br />
Jirle and J. B6rnfors provided assistance in the sex and species determination of the bark beetles<br />
collected. F. Schlyter provided appropriate baits for L typographus. J. J6nsson gave helpful assistance<br />
in the construction of the 12-m poles. We thank foresters in Esrum forest district for their<br />
cooperation and appreciate the use of StrCdam Biological Station in Demmark. We thank F. Schlyter<br />
and T.C. Baker for review of the manuscript.<br />
REFERENCES<br />
BAKER, T.C., and ROELOFS, W.L. 1981. Initiation and termination of oriental fruit moth male<br />
response to pheromone concentration in the field. Environ. Entomol. 10:211-218.
764 BYERS ET AL.<br />
BORDEN, J.H., HUNT, D.W.A., MILLER, D.R., and SLESSOR, K.N. 1986. Orientation in forest<br />
Coleoptera: An uncertain outcome of responses by individual beetles to variable stimuli, pp.<br />
97-109, in T.L. Payne, M.C. Birch, and C.E.J. Kennedy (eds.). Mechanisms in Insect Olfaction.<br />
Clarendon Press, Oxford.<br />
BOSSERT, W.H., and WILSON, E.O. 1963. The analysis of olfactory communication among animals.<br />
J. Theor. Biol. 5:443-469.<br />
BURNELL, D.G. 1973. A dispersal-aggregation model for mountain pine beetle in lodgepole pine<br />
stands. Res. Popul. Ecol. 19:99-106.<br />
BYERS, J.A. 1983. Sex-specific responses to aggregation pheromone: Regulation of colonization<br />
density in the bark beetle Ips paraconfusus. J. Chem. Ecol. 9:129-142.<br />
BYERS, J.A. 1987. Interactions of pheromone component odor plumes of western pine beetle. J.<br />
Chem. Ecol. 13:2143-2157.<br />
BYERS, J.A., LANNE, B.S., LOFQVIST, L., SCHLYTER, F., and BERGSTROM, G. 1985. Olfactory<br />
recognition of host-tree susceptibility by pine shoot beetles. Naturwissenschaften 72:324-326.<br />
BYRNE, K.J., SWIGAR, A.A., SILVERSTEIN, R.M., BORDEN, J.H., and STOKKINK, E. 1974. Sulcatol:<br />
Population aggregation pheromone in the scolytid beetle, Gnathotrichus sulcatus. J. Insect<br />
Physiol. 20:1895-1900.<br />
CHAPMAN, J.A., and KaNGHORN, J.M. 1958. Studies of flight and attack activity of the ambrosia<br />
beetle, Trypodendron lineatum (Oliv.), and other scolytids. Can. Entomol. 90:362-372.<br />
CUTHBERT, R.A., and PEACOCK, J.W. 1975. Attraction of Scolytus multistriatus to pheromonebaited<br />
traps at different heights. Environ. Entomol. 4:889-890.<br />
DUELLI, VON P., STUDER, M., and NAF, W. 1986. Der Borkenk~iferflug auserhalb des Waldes. J.<br />
Appl. Entomol. 102:139-148.<br />
EL~ZINTON, J.S., and CARDE, R.T. 1984. Odor dispersion, pp. 73-91, in W.J. Bell and R.T. Card6<br />
(eds.). <strong>Chemical</strong> <strong>Ecology</strong> of Insects. Chapman and Hall, London.<br />
FORSSE, E., and SOLBRECK, CH. 1985. Migration in the bark beetle Ips typographus L.: Duration,<br />
timing and height of flight. Z. Angew. Entomol. 100:47-57.<br />
GARA, R.I., and VITE, J.P. 1962. Studies on the flight patterns of bark beetles (Coleoptera: Scolytidae)<br />
in second growth ponderosa pine forests. Contrib. Boyce Thompson Inst. 21:275-289.<br />
HYNUM, B.G., and BERRYMAN, A.A. 1980. Dendroctonus ponderosae (Coleoptera: Scolytidae):<br />
Pre-aggregation landing and gallery initiation on lodgepole pine. Can. Entomol. 112:185-<br />
191.<br />
LEoS-MARTINEZ, GRANOVSKY, T.A., WILLIAMS, H.J., VINSON, S.B., and BURKHOLDER, W.E. 1986.<br />
Estimation of aerial density of the lesser grain borer (Coleoptera: Bostrichidae) in a warehouse<br />
using dominicalure traps. J. Econ. Entomol. 79:1134-1138.<br />
NAKAMURA, K., and KAWASAKI, K. 1977. The active space of the Spodoptera litura (F.) sex pheromone.<br />
Appl. Entomol. Zool. 12:162-177.<br />
NIJHOLT, W.W. 1983. Flight behavior of ambrosia beetles near free-standing sticky-screen traps.<br />
Can. For. Serv. Res. Notes 3:8-9.<br />
PAYNE, T.L. 1986. Olfaction and vision in host finding by a bark beetle, pp. 111-116, in T.L.<br />
Payne, M.C. Birch, and C.E.J. Kennedy (eds.). Mechanisms in Insect Olfaction. Clarendon<br />
Press, Oxford.<br />
RAFFA, K.F., and BERRYMAN, A.A. 1980. Flight responses and host selection by bark beetles, pp.<br />
213-233, in A.A. Berryman and L. Safranyik (eds.). Dispersal of Forest Insects: Evaluation,<br />
Theory and Management Implications. Proceedings IUFRO Conference, Cooperative Extension<br />
Service, Washington State University, Pullman, Washington.<br />
SCHLYTER, F., BYERS, J.A., and LOFQVIST, J. 1987. Attraction to pheromone sources of different<br />
quantity, quality, and spacing: Density-regulation mechanisms in bark beetle Ips typographus.<br />
J. Chem. Ecol. 13:1503-1523.<br />
SCHMIrZ, R.F. 1980. Dispersal of pine engraver beetles in second growth ponderosa pine forests,
<strong>EFFECTIVE</strong> <strong>ATTRACTION</strong> <strong>RADIUS</strong> AND FLIGHT DENSITIES 765<br />
pp. 41-50, in A.A. Berryman and L. Safranyik (eds.). Dispersal of Forest Insects: Evaluation,<br />
Theory and Management Implications. Proceedings IUFRO Conference, Cooperative Extension<br />
Service, Washington State University, Pullman, Washington.<br />
SHORE, T.L., and MCLEAN, J.A. 1984. The effect of height of pheromone-baited traps on catches<br />
of the ambrosia beetle, Trypodendron lineatum. J. Entomol. Soc. B.C. 81:17-18.<br />
SOLBRECK, C. 1985. Insect migration strategies and population dynamics. Contrib. Mar. Sci. Suppl.<br />
27:641-622.<br />
TILDEN, P.E., BEDA~D, W.D., WOOD, D.L., L1NDAHL, K.Q., and RAUCH, P.A. 1979. Trapping<br />
the western pine beetle at and near a source of synthetic attractive pheromone: Effects of trap<br />
size and position. J. Chem. Ecol. 5:519-531.<br />
TILDEN, P.E., BEDARD, W.D., LINDAHL, K.Q., JR., and WOOD, D.L. 1983. Trapping Dendroctonus<br />
brevicomis: Changes in attractant release rate, dispersion of attractant, and silhouette.<br />
J. Chem. Ecol. 9:311-321.<br />
VITs J.P., and GARA, R.I. 1962. Volatile attractants from ponderosa pine attacked by bark beetles<br />
(Coleoptera: Scolytidae). Contrib. Boyce Thompson Inst. 21:251-273.<br />
WIGGLESWORTH, V.B. 1972. The Principles of Insect Physiology, pp. 235-237. John Wiley &<br />
Sons, New York.