Financial Report 2003 (english) PDF ⢠287.26 KB - Kuoni Group
Financial Report 2003 (english) PDF ⢠287.26 KB - Kuoni Group
Financial Report 2003 (english) PDF ⢠287.26 KB - Kuoni Group

You also want an ePaper? Increase the reach of your titles
YUMPU automatically turns print PDFs into web optimized ePapers that Google loves.
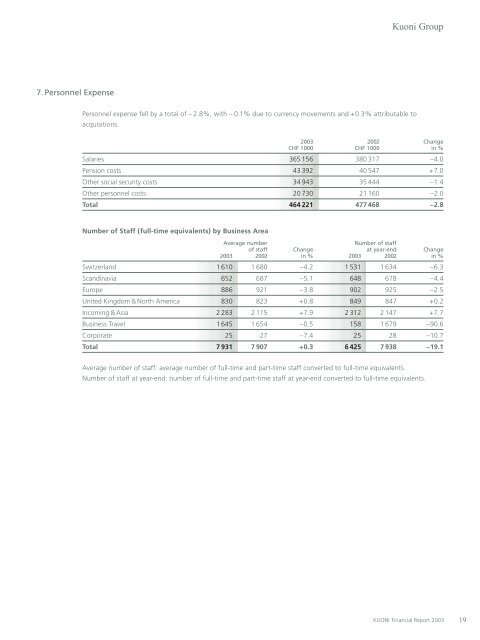
7. Personnel Expense<br />
<strong>Kuoni</strong> <strong>Group</strong><br />
Personnel expense fell by a total of – 2.8%, with – 0.1% due to currency movements and +0.3% attributable to<br />
acquisitions.<br />
<strong>2003</strong> 2002 Change<br />
CHF 1000 CHF 1000 in %<br />
Salaries 365 156 380 317 –4.0<br />
Pension costs 43 392 40 547 +7.0<br />
Other social security costs 34 943 35 444 –1.4<br />
Other personnel costs 20 730 21 160 –2.0<br />
Total 464 221 477 468 –2.8<br />
Number of Staff (full-time equivalents) by Business Area<br />
Average number Number of staff<br />
of staff Change at year-end Change<br />
<strong>2003</strong> 2002 in % <strong>2003</strong> 2002 in %<br />
Switzerland 1 610 1 680 –4.2 1 531 1 634 –6.3<br />
Scandinavia 652 687 –5.1 648 678 –4.4<br />
Europe 886 921 –3.8 902 925 –2.5<br />
United Kingdom & North America 830 823 +0.8 849 847 +0.2<br />
Incoming & Asia 2 283 2 115 +7.9 2 312 2 147 +7.7<br />
Business Travel 1 645 1 654 –0.5 158 1 679 –90.6<br />
Corporate 25 27 –7.4 25 28 –10.7<br />
Total 7 931 7 907 +0.3 6 425 7 938 –19.1<br />
Average number of staff: average number of full-time and part-time staff converted to full-time equivalents.<br />
Number of staff at year-end: number of full-time and part-time staff at year-end converted to full-time equivalents.<br />
KUONI <strong>Financial</strong> <strong>Report</strong> <strong>2003</strong><br />
19