Financial Report 2003 (english) PDF ⢠287.26 KB - Kuoni Group
Financial Report 2003 (english) PDF ⢠287.26 KB - Kuoni Group
Financial Report 2003 (english) PDF ⢠287.26 KB - Kuoni Group

You also want an ePaper? Increase the reach of your titles
YUMPU automatically turns print PDFs into web optimized ePapers that Google loves.
22<br />
Annex<br />
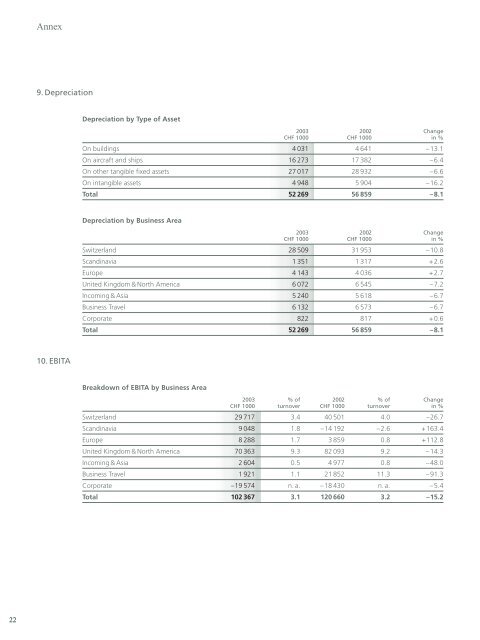
9. Depreciation<br />
10. EBITA<br />
Depreciation by Type of Asset<br />
<strong>2003</strong> 2002 Change<br />
CHF 1000 CHF 1000 in %<br />
On buildings 4 031 4 641 –13.1<br />
On aircraft and ships 16 273 17 382 –6.4<br />
On other tangible fixed assets 27 017 28 932 –6.6<br />
On intangible assets 4 948 5 904 –16.2<br />
Total 52 269 56 859 –8.1<br />
Depreciation by Business Area<br />
<strong>2003</strong> 2002 Change<br />
CHF 1000 CHF 1000 in %<br />
Switzerland 28 509 31 953 –10.8<br />
Scandinavia 1 351 1 317 +2.6<br />
Europe 4 143 4 036 +2.7<br />
United Kingdom & North America 6 072 6 545 –7.2<br />
Incoming & Asia 5 240 5 618 –6.7<br />
Business Travel 6 132 6 573 –6.7<br />
Corporate 822 817 +0.6<br />
Total 52 269 56 859 –8.1<br />
Breakdown of EBITA by Business Area<br />
<strong>2003</strong> % of 2002 % of Change<br />
CHF 1000 turnover CHF 1000 turnover in %<br />
Switzerland 29 717 3.4 40 501 4.0 –26.7<br />
Scandinavia 9 048 1.8 –14 192 –2.6 +163.4<br />
Europe 8 288 1.7 3 859 0.8 +112.8<br />
United Kingdom & North America 70 363 9.3 82 093 9.2 –14.3<br />
Incoming & Asia 2 604 0.5 4 977 0.8 –48.0<br />
Business Travel 1 921 1.1 21 852 11.3 –91.3<br />
Corporate –19 574 n. a. –18 430 n. a. –5.4<br />
Total 102 367 3.1 120 660 3.2 –15.2