Actuarial Review of the Social Insurance Fund 2005 - Department of ...
Actuarial Review of the Social Insurance Fund 2005 - Department of ...
Actuarial Review of the Social Insurance Fund 2005 - Department of ...

You also want an ePaper? Increase the reach of your titles
YUMPU automatically turns print PDFs into web optimized ePapers that Google loves.
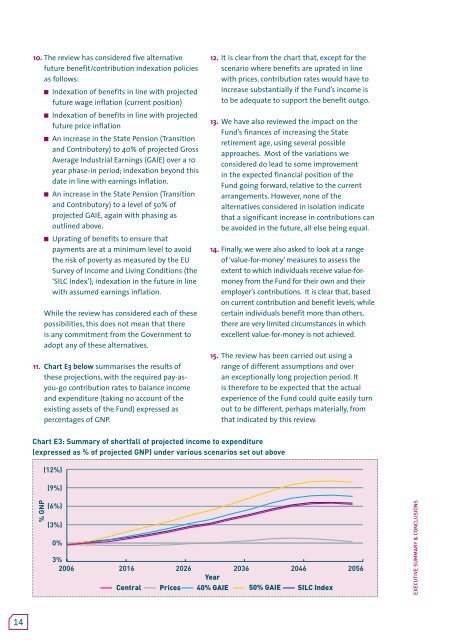
10. The review has considered five alternativefuture benefit/contribution indexation policiesas follows:n Indexation <strong>of</strong> benefits in line with projectedfuture wage inflation (current position)n Indexation <strong>of</strong> benefits in line with projectedfuture price inflationn An increase in <strong>the</strong> State Pension (Transitionand Contributory) to 40% <strong>of</strong> projected GrossAverage Industrial Earnings (GAIE) over a 10year phase-in period; indexation beyond thisdate in line with earnings inflation.n An increase in <strong>the</strong> State Pension (Transitionand Contributory) to a level <strong>of</strong> 50% <strong>of</strong>projected GAIE, again with phasing asoutlined above.n Uprating <strong>of</strong> benefits to ensure thatpayments are at a minimum level to avoid<strong>the</strong> risk <strong>of</strong> poverty as measured by <strong>the</strong> EUSurvey <strong>of</strong> Income and Living Conditions (<strong>the</strong>‘SILC Index’); indexation in <strong>the</strong> future in linewith assumed earnings inflation.While <strong>the</strong> review has considered each <strong>of</strong> <strong>the</strong>sepossibilities, this does not mean that <strong>the</strong>reis any commitment from <strong>the</strong> Government toadopt any <strong>of</strong> <strong>the</strong>se alternatives.11. Chart E3 below summarises <strong>the</strong> results <strong>of</strong><strong>the</strong>se projections, with <strong>the</strong> required pay-asyou-gocontribution rates to balance incomeand expenditure (taking no account <strong>of</strong> <strong>the</strong>existing assets <strong>of</strong> <strong>the</strong> <strong>Fund</strong>) expressed aspercentages <strong>of</strong> GNP.12. It is clear from <strong>the</strong> chart that, except for <strong>the</strong>scenario where benefits are uprated in linewith prices, contribution rates would have toincrease substantially if <strong>the</strong> <strong>Fund</strong>’s income isto be adequate to support <strong>the</strong> benefit outgo.13. We have also reviewed <strong>the</strong> impact on <strong>the</strong><strong>Fund</strong>’s finances <strong>of</strong> increasing <strong>the</strong> Stateretirement age, using several possibleapproaches. Most <strong>of</strong> <strong>the</strong> variations weconsidered do lead to some improvementin <strong>the</strong> expected financial position <strong>of</strong> <strong>the</strong><strong>Fund</strong> going forward, relative to <strong>the</strong> currentarrangements. However, none <strong>of</strong> <strong>the</strong>alternatives considered in isolation indicatethat a significant increase in contributions canbe avoided in <strong>the</strong> future, all else being equal.14. Finally, we were also asked to look at a range<strong>of</strong> ‘value-for-money’ measures to assess <strong>the</strong>extent to which individuals receive value-formoneyfrom <strong>the</strong> <strong>Fund</strong> for <strong>the</strong>ir own and <strong>the</strong>iremployer’s contributions. It is clear that, basedon current contribution and benefit levels, whilecertain individuals benefit more than o<strong>the</strong>rs,<strong>the</strong>re are very limited circumstances in whichexcellent value-for-money is not achieved.15. The review has been carried out using arange <strong>of</strong> different assumptions and overan exceptionally long projection period. Itis <strong>the</strong>refore to be expected that <strong>the</strong> actualexperience <strong>of</strong> <strong>the</strong> <strong>Fund</strong> could quite easily turnout to be different, perhaps materially, fromthat indicated by this review.Chart E3: Summary <strong>of</strong> shortfall <strong>of</strong> projected income to expenditure(expressed as % <strong>of</strong> projected GNP) under various scenarios set out above(12%)(9%)120% GNP(6%)(3%)0%3%2006 2016 2026 2036 2046 2056YearCentral Prices 40% GAIE 50% GAIE SILC IndexExecutive summary & conclusions9060300-3014