Statistical Information on Social Welfare Services 2009 - Welfare.ie
Statistical Information on Social Welfare Services 2009 - Welfare.ie
Statistical Information on Social Welfare Services 2009 - Welfare.ie

Create successful ePaper yourself
Turn your PDF publications into a flip-book with our unique Google optimized e-Paper software.
older preface people from the ministerPreface from the MinisterI welcome the publicati<strong>on</strong> of this 27th editi<strong>on</strong> of the <str<strong>on</strong>g>Statistical</str<strong>on</strong>g> <str<strong>on</strong>g>Informati<strong>on</strong></str<strong>on</strong>g> <strong>on</strong> <strong>Social</strong> <strong>Welfare</strong> <strong>Services</strong>. This<strong>2009</strong> editi<strong>on</strong> of the Annual <str<strong>on</strong>g>Statistical</str<strong>on</strong>g> Report provides comprehensive statistical informati<strong>on</strong> <strong>on</strong> all programmesadministered by the Department of <strong>Social</strong> Protecti<strong>on</strong>.The document illustrates my Department’s <strong>on</strong>going commitment to improving and developing services as anintegral part of wider Government aims and objectives. Reliable data <strong>on</strong> outputs and trends as c<strong>on</strong>tained in thisReport are invaluable elements in the development and implementati<strong>on</strong> of polic<strong>ie</strong>s to build social inclusi<strong>on</strong> andprogress social cohesi<strong>on</strong>.Supports administered by this Department provide for the complex and multi-faceted needs of people at everystage of life. C<strong>on</strong>tinuing to reflect the trend of recent years and re-affirming the Government’s commitment tothe welfare of all those in need of support, social welfare programme expenditure increased to €20.5 billi<strong>on</strong> in<strong>2009</strong> - an increase of 15.3% over the previous year.Statistics tell their own story and in <strong>2009</strong>:iv• Nearly 1.4 milli<strong>on</strong> people were in receipt of a weekly <strong>Social</strong> <strong>Welfare</strong> payment, which was paid in respectof just under 2.1 milli<strong>on</strong> beneficiar<strong>ie</strong>s;• Expenditure <strong>on</strong> State Pensi<strong>on</strong>s increased by 6.3% to €4.6 billi<strong>on</strong>. Payments were made to almost379,000 people in this area;• 602,932 famil<strong>ie</strong>s received a m<strong>on</strong>thly Child Benefit payment, which was paid in respect of 1,156,917children. Expenditure <strong>on</strong> Child Benefit increased by 1.7% to €2.5 billi<strong>on</strong>;• Family Income Supplement was paid to 25,963 famil<strong>ie</strong>s, benefiting nearly 56,000 children;• Expenditure <strong>on</strong> Carer’s Allowance increased by 11.6%;• The numbers in receipt of a Carer’s payment increased from 45,818 to 50,140, an increase of 9.4%.This report illustrates and charts the progress being made in improving and developing services, in tandemwith wider Government aims and objectives that have at their core the delivery of improved quality of life andopportunit<strong>ie</strong>s to people of all ages.Finally, I would like to express my appreciati<strong>on</strong> to the staff throughout the Department, for their c<strong>on</strong>tinuedefforts in implementing the Government’s programme of social welfare protecti<strong>on</strong>, support and reform during achallenging year.Ba mhaith liomsa mo bhuíochas a ghabháil le foireann na Roinne a chabhraí<strong>on</strong>n le muintir na tíre gach a<strong>on</strong> lá.Éam<strong>on</strong> Ó Cuív T.D Minister for <strong>Social</strong> Protecti<strong>on</strong><str<strong>on</strong>g>Statistical</str<strong>on</strong>g> <str<strong>on</strong>g>Informati<strong>on</strong></str<strong>on</strong>g> <strong>on</strong> <strong>Social</strong> <strong>Welfare</strong> <strong>Services</strong> <strong>2009</strong>
éamhrá older people an aireRéamhrá an AireFearaim fáilte roimh fhoilsiú an 27ú eagrán seo den Eolas Staitistiúil ar Sheirbhísí Leasa Shóisialaigh. Gheofar ineagrán <strong>2009</strong> den Tuarascáil Staitistiúil Bhliantúil eolas cuimsitheach staitistiúil ar gach clár a riarann an RoinnCoimirce Sóisialaí.Léirí<strong>on</strong>n an doiciméad tiomantas leanúnach mo Roinne do fheabhas a chur ar sheirbhísí agus forbairt adhéanamh orthu mar chuid dhílis d’aidhmeanna agus cuspóirí ginearálta an Rialtais. Is mór mar a chabhróidh nas<strong>on</strong>raí i<strong>on</strong>taofa ar aschur agus ar threochtaí a gheofar sa Tuarascáil seo chun beartais a fhorbairt agus a chur ingníomh a neartóidh cuimsiú sóisialta agus a dhéanfaidh dul chun cinn i leith chomhtháthú sóisialta.Soláthraí<strong>on</strong>n an Roinn seo tacaíochtaí le haghaidh riachtanais chasta agus iltaobhacha daoine ag gach céim denbheatha. Mhéadaigh an caiteachas ar an gclár leasa shóisialaigh sa bhliain <strong>2009</strong> go €20.5 billiún – méadú de15.3% ar an mbliain roimhe, rud a léirí<strong>on</strong>n treocht na mblianta deireanacha agus a athdhearbhaí<strong>on</strong>n tiomantasan Rialtais do leas iad siúd a bhfuil tacaíocht de dhíth orthu.Insí<strong>on</strong>n na staitisticí a scéal féin agus sa bhliain <strong>2009</strong>:• Bhí geall le 1.4 milliún duine ag fáil íocaíocht sheachtainiúil Leasa Shóisialaigh, a íocadh ar s<strong>on</strong> geall le2.1 tairbhí;• Mhéadaigh caiteachas ar Phinsin Stáit de 6.3% go €4.6 billiún. Rinneadh íocaíochtaí le geall le 379,000duine sa réimse seo;• Fuair 609,932 teaghlach íocaíocht Sochar Linbh, a íocadh ar s<strong>on</strong> 1,156,917 leanbh. Mhéadaigh caiteachasar Shochar Linbh de 1.7% go €2.5 billiún;• Íocadh Forlí<strong>on</strong>adh I<strong>on</strong>caim Teaghlaigh le 25,963 teaghlach, a thairbhigh 56,000 leanbh nó geall leis;• Mhéadaigh caiteachas ar an Liúntas Cúramóra de 11.6%;• Mhéadaigh lí<strong>on</strong> na ndaoine a fhaigheann íocaíocht Cúramóra de 9.4%, ó 45,818 go 50,140.vLéirí<strong>on</strong>n an tuarascáil seo an dul chun cinn atá á dhéanamh maidir le feabhsú agus forbairt seirbhísí, mar chuidd’aidhmeanna agus cuspóirí ginearálta an Rialtais a fhéachann le caighdeán beatha agus deiseanna níos fearr asholáthar do dhaoine ag gach aois.Mar fhocal scoir, is mór agam an iarracht leanúnach a rinne foireann na Roinne seo chun clár an Rialtais umchosaint, tacaíochtaí agus leasú leasa shóisialaigh a chur i ngníomh i mbliain dhúshlánach.Ba mhaith liomsa mo bhuíochas a ghabháil le foireann na Roinne a chabhraí<strong>on</strong>n le muintir na tíre gach a<strong>on</strong> lá.Éam<strong>on</strong> Ó Cuív T.D. Aire Coimirce Sóisialaí<str<strong>on</strong>g>Statistical</str<strong>on</strong>g> <str<strong>on</strong>g>Informati<strong>on</strong></str<strong>on</strong>g> <strong>on</strong> <strong>Social</strong> <strong>Welfare</strong> <strong>Services</strong> <strong>2009</strong>
older summary introducti<strong>on</strong> people and financialIntroducti<strong>on</strong>GeneralThis is the twenty seventh issue of the annual “<str<strong>on</strong>g>Statistical</str<strong>on</strong>g> <str<strong>on</strong>g>Informati<strong>on</strong></str<strong>on</strong>g> <strong>on</strong> <strong>Social</strong> <strong>Welfare</strong> <strong>Services</strong>” preparedby the Department of <strong>Social</strong> Protecti<strong>on</strong>. It sets out comprehensive data relating to services provided by theDepartment.The statistics set out in this report relate to <strong>2009</strong> and earl<strong>ie</strong>r years. In the case of data relating to recip<strong>ie</strong>ntsand beneficiar<strong>ie</strong>s, the figures, unless otherwise stated, refer to the 31st December each year. Several tables,which provide a breakdown of recip<strong>ie</strong>nts or beneficiar<strong>ie</strong>s by some characteristic such as number of dependantsor age, are refered to as “estimated”. This means that the proporti<strong>on</strong>ate breakdown, which is c<strong>on</strong>sidered to bea reliable estimate, was established at a date other than, but close to, 31st December.Expenditure figures for <strong>2009</strong> are provisi<strong>on</strong>al pending certificati<strong>on</strong> by the Comptroller and Auditor General. AllExpenditure figures have been c<strong>on</strong>verted to Euro amountsviSource of DataThe source for the statistics presented, unless otherwise stated, is the Department of <strong>Social</strong> Protecti<strong>on</strong>.Time Ser<strong>ie</strong>s and Changes to Existing PaymentsTime Ser<strong>ie</strong>s data are given, where available. However, the introducti<strong>on</strong> of new payments and changes toexisting payments affect the comparability of different years’ figures in some instances. Relevant tables arefootnoted where appropriate.Breakdown by Secti<strong>on</strong>The report is divided into nine secti<strong>on</strong>s as follows:Secti<strong>on</strong> ASummary and FinancialSecti<strong>on</strong> BOlder PeopleSecti<strong>on</strong> CWidows, Widowers and One Parent Famil<strong>ie</strong>sSecti<strong>on</strong> DChild Related PaymentsSecti<strong>on</strong> EIllness, Disability and CaringSecti<strong>on</strong> FJobseeker’s SupportsSecti<strong>on</strong> GEmployment SupportsSecti<strong>on</strong> HSupplementary <strong>Welfare</strong> AllowanceSecti<strong>on</strong> JMiscellaneous Payments and GrantsAppendix 2 (page 103) lists the payments covered by each category.<str<strong>on</strong>g>Statistical</str<strong>on</strong>g> <str<strong>on</strong>g>Informati<strong>on</strong></str<strong>on</strong>g> <strong>on</strong> <strong>Social</strong> <strong>Welfare</strong> <strong>Services</strong> <strong>2009</strong>
summary and older introducti<strong>on</strong> financial peopleSecti<strong>on</strong> A provides details of expenditure, recip<strong>ie</strong>nts of weekly <strong>Social</strong> <strong>Welfare</strong> Payments, insured pers<strong>on</strong>s andrates of payment.Secti<strong>on</strong> B provides details of expenditure and recip<strong>ie</strong>nts of payments relating to older people.Secti<strong>on</strong> C provides details of expenditure and recip<strong>ie</strong>nts of payments to widows, widowers and <strong>on</strong>e parentfamil<strong>ie</strong>s. It also includes some statistics <strong>on</strong> payment to deserted wives and pris<strong>on</strong>ers’ wives.Secti<strong>on</strong> D provides details of expenditure and recip<strong>ie</strong>nts of child related payments including Child Benefit,Guardian’s Payment and Maternity Benefit.Secti<strong>on</strong> E provides details of expenditure and recip<strong>ie</strong>nts of Illness Benefit, Invalidity Pensi<strong>on</strong>, DisabilityAllowance, Blind Pensi<strong>on</strong>, Carers Allowance and Occupati<strong>on</strong>al Injury Benefits.Secti<strong>on</strong> F provides details of jobseeker’s payments.Secti<strong>on</strong> G provides details of employment supports including Back to Work Allowance, Back to Work EnterpriseAllowance, Back to Educati<strong>on</strong> Allowance, the Family Income Supplement and Farm Assist.Secti<strong>on</strong> H provides details of the range of payments available under the Supplementary <strong>Welfare</strong> Allowancescheme.Secti<strong>on</strong> J provides details of Treatment Benefits, Free Schemes and other miscellaneous payments. This secti<strong>on</strong>includes the number of Pers<strong>on</strong>alised Public Service numbers issued by Nati<strong>on</strong>ality.SummaryReaders v<strong>ie</strong>ws and comments <strong>on</strong> this report are welcome and should be addressed to:Statistics Unit,Department of <strong>Social</strong> Protecti<strong>on</strong>,Floor 1,Áras Mhic Dhiarmada,Store Street,Dublin 1.viiThis Report is also available <strong>on</strong> the internet at www.welfare.<strong>ie</strong>The Department of <strong>Social</strong> Protecti<strong>on</strong> also publishes an Annual Report which provides details of all majordevelopments during the year in questi<strong>on</strong>. The Report is a progress report to the Minister and the Government<strong>on</strong> the implementati<strong>on</strong> of the Department’s Strategy Statement. In additi<strong>on</strong>, the “Guide to <strong>Social</strong> <strong>Welfare</strong><strong>Services</strong>” provides comprehensive informati<strong>on</strong> <strong>on</strong> all social welfare services and is available directly from anyoffice of the Department and <strong>on</strong> the Internet.<str<strong>on</strong>g>Statistical</str<strong>on</strong>g> <str<strong>on</strong>g>Informati<strong>on</strong></str<strong>on</strong>g> <strong>on</strong> <strong>Social</strong> <strong>Welfare</strong> <strong>Services</strong> <strong>2009</strong>
older réamhrá peopleRéamhráCúrsaí GinearáltaIs é seo an seachtú a fiche d<strong>on</strong> bhfoilsiúcháin bliantúil ‘Eolas Staitistiúil ar Sheirbhísí Leasa Shóisialaigh’ aullmhaí<strong>on</strong>n An Roinn Coimirce Sóisialaí. Leagann sé amach s<strong>on</strong>raí cuimsitheach maidir leis na seirbhísí atácurtha ar fáil ag an Roinn.Baineann na staitistic san eagran seo le <strong>2009</strong> agus níos luaithe. Maidir leis na s<strong>on</strong>raí i leith na n-daoine atáag fáil íocaíochtaí nó íocaíochtai ar a s<strong>on</strong> is iad na figiúirí ar 31 Nollaig gach bliain atá luaite, ach amháinnuair a deirtear a mhalairt. Tá a lan de na táblaí a leiri<strong>on</strong>n mi<strong>on</strong>dealaithe i leith daoine ag fáil íocaíochtaí, nóíocaíochtaí ar a s<strong>on</strong>, de réir treith áirithe mar an meid deithiúnaithe, nó aois luaithe mar ‘measta’. Ciallaí<strong>on</strong>n séseo gur bunaíodh na mi<strong>on</strong>dealaithe, ata measaithe a bheith údarásach, ar dháta seachas 31 Nollaig ach gar d<strong>on</strong>dáta sin.Is figúirí sealadach iad na figúirí caiteachas le haghaidh <strong>2009</strong> go dtí go mbeidh siad deimhnithe ag An Ard-Reachtaire Cuntas agus Ciste. Ta na figuirí caiteachas ar fad athruithe go suimeanna Euro.viiiFoinse na S<strong>on</strong>raíIs í An Roinn Coimirce Sóisialaí foinse na staitistic atá léirithe, ach amháin nuair a deirtear a mhalairt.Amsraith agus Athraithe ar ÍocaíochtaíTugtar s<strong>on</strong>rai ar amshraith nuair atá siad ar fáil. I gcásanna áirithe, áfach, cuireann íocaíochtaí nua, m. sh.Liuntas Cúnamh Feirme, nó athraithe ar íocaíochtaí, isteach ar chomparáid idir blianta. Tá f<strong>on</strong>óta leis na tablaicuí nuair is gáMi<strong>on</strong>dealú De Réir RannaTá an eolaí roinnte i naoi gcuid mar a leanas:Cuid A Coimriú agus AirgeadaisCuid B Daoine AostaCuid C Baintreacha Fir & Mná agus Teaghlaigh le Tuismitheoir AmháinCuid D Íocaíochtaí a bhaineann le PáistíCuid E Tinneas, Míchumas agus CúramCuid F Tacáiochtaí DífhostaíochtaCuid G Tacaíochtaí FostaíochtaCuid H Liúntas Leasa Forlí<strong>on</strong>tachCuid J Íocaíochtaí Ilghnéitheach agus De<strong>on</strong>taisTá na h-íocaíochtaí i ngach earnáil leagtha amach in Aguisín 2 (leath. 103)<str<strong>on</strong>g>Statistical</str<strong>on</strong>g> <str<strong>on</strong>g>Informati<strong>on</strong></str<strong>on</strong>g> <strong>on</strong> <strong>Social</strong> <strong>Welfare</strong> <strong>Services</strong> <strong>2009</strong>
older réamhrá peopleTugann Cuid A s<strong>on</strong>raí maidir le caiteachas, le faighteoirí íocaíochtaí seachtainiúil leasa shóisialaigh, le daoineinárachais agus le rátaí íocaíochtaí.Tugann Cuid B eolas maidir le caiteachas agus faighteoirí íocaíochtaí a bhaineann le daoine aosta.Tugann Cuid C eolas maidir le caiteachas ar agus faighteoirí íocaíochtaí do bhaintreacha fir agus mná agusteaghlaigh le tuismitheoir amháin. Tá roinnt staitistic maidir le h-íocaíochtaí do mhná chéile tréigthe agus domhná chéile príosúnaigh san áireamh sa chuid seo freisin.Tugann Cuid D eolas maidir le caiteachas ar agus faighteoirí íocaíochtaí a bhaineann le páistí, Sochar Leanaí,Pinsean Dílleachta agus Sochar Maithreachais san áireamh.Tugann Cuid E eolas maidir le caiteachas ar agus faighteoirí Sochar Breoiteachta, Pinsean Easláinte, LiúntasMíchumais, Pinsean na nDall, Liúntas Cúraim agus Sochair Gortú Ceirde.Tugann Cuid F eolas maidir le h-íocaíochtaí a bhaineann le dífhostaíocht.Tugann Cuid G eolas maidir le tacaiochtai fostaiochta, an Liúntas Filleadh ar Obair, Liúntas Fi<strong>on</strong>tar Filleadhar Obair , Liúntas Filleadh ar Oideachais, Forlí<strong>on</strong>adh d’I<strong>on</strong>cam Teaghlaigh agus Liúntas Cunamh Feirme sanaireamh.Tugann Cuid H eolas maidir leis na h-íocaíochtaí éagsúla a chuirtear ar fáil faoin Scéim Liúntas LeasaForlí<strong>on</strong>tachTugann Cuid J eolas maidir le Sochar Coireála, Saorscéimeanna agus íocaíochtaí ilgnéitheach eile. Tugtar sachuid seo lí<strong>on</strong> na nUimhreacha Pearsanta Seirbhísí Poiblí a eisíodh, arna roinnt de réir náisiúnachtaí.AchomairBeidh fáilte roimh tuairimí leitheoirí maidir leis an tuairisc seo. Ba cheart iad a sheoladh chuig:Rannóg Staitistic,An Roinn Coimirce SoisialaíUrlár 1,Áras Mhic Dhiarmada,Sráid Stórais,Baile Átha Cliath 1ixTá an Tuairisc seo ar fáil freisin ar an idir-líne ag www.welfare.<strong>ie</strong>Foilsí<strong>on</strong>n an Roinn Coimirce Soisialaí Tuairisc Bliantúil a thugann s<strong>on</strong>raí ar an dul chun cinn atá déanta sabhlian atá i gceist. Is tuairisc í chuig an Aire agus an Rialtas ar dul chun cinn maidir le cur i bhfeidhm RáiteasStraitéiseach na Roinne. Chomh maith le sin tugann an ‘Treoirleabhar ar Sheirbhísí Leasa Shóisialaigh’ eolascuimsitheach ar na seirbhísí leasa shóisialaigh ar fad agus tá sé seo ar fáil ó a<strong>on</strong> oifig den Roinn agus ar anidir-líne.<str<strong>on</strong>g>Statistical</str<strong>on</strong>g> <str<strong>on</strong>g>Informati<strong>on</strong></str<strong>on</strong>g> <strong>on</strong> <strong>Social</strong> <strong>Welfare</strong> <strong>Services</strong> <strong>2009</strong>
older summary list of people tables and financialList of TablesSecti<strong>on</strong> A - Summary And FinancialPagexTable A1 Expenditure <strong>on</strong> <strong>Social</strong> <strong>Welfare</strong> by Programme,2008 and <strong>2009</strong> 3Table A2Expenditure <strong>on</strong> <strong>Social</strong> <strong>Welfare</strong> as a Percentage of Current Government Expenditure,GNP and GDP, 2000 to <strong>2009</strong>Table A3 Expenditure <strong>on</strong> <strong>Social</strong> <strong>Welfare</strong> by Payment Type, 2008 and <strong>2009</strong> 4Table A4 Additi<strong>on</strong>al Expenditure Details, 2008 and <strong>2009</strong> 5Table A5 <strong>Social</strong> Insurance and <strong>Social</strong> Assistance Expenditure by Scheme, 2008 and <strong>2009</strong> 6Table A6 Financing of <strong>Social</strong> <strong>Welfare</strong> Expenditure, 2008 and <strong>2009</strong> 7Table A7 Financing of the <strong>Social</strong> Insurance Fund, 2008 and <strong>2009</strong> 7Table A8 Number of Recip<strong>ie</strong>nts and Beneficiar<strong>ie</strong>s of Weekly <strong>Social</strong> <strong>Welfare</strong> Payments, 2000 to 9<strong>2009</strong>Table A9 Number of Recip<strong>ie</strong>nts of Weekly <strong>Social</strong> <strong>Welfare</strong> Payments by Payment Type and10Programme, 2008 and <strong>2009</strong>Table A10 Number of Recip<strong>ie</strong>nts of Weekly <strong>Social</strong> <strong>Welfare</strong> Payments by Lifecycle Stage, 2008 11and <strong>2009</strong>Table A11 Number of Recip<strong>ie</strong>nts of Weekly <strong>Social</strong> <strong>Welfare</strong> Payments by Payment Type and13Insurance or Assistance, 2008 and <strong>2009</strong>Table A12 Number of Beneficiar<strong>ie</strong>s of Weekly <strong>Social</strong> <strong>Welfare</strong> Payments by Payment Type and 14Programme, 2008 and <strong>2009</strong>Table A13 Number of Beneficiar<strong>ie</strong>s of Weekly <strong>Social</strong> <strong>Welfare</strong> Payments by Lifestage Cycle, 2008 15and <strong>2009</strong>Table A14 Number of Beneficiar<strong>ie</strong>s of Weekly <strong>Social</strong> <strong>Welfare</strong> Payments by Payment Type and 16Insurance or Assistance, 2008 and <strong>2009</strong>Table A15 Number of Recip<strong>ie</strong>nts of Weekly <strong>Social</strong> <strong>Welfare</strong> Payments by Sex, Payment Type and 17Insurance or Assistance, <strong>2009</strong>Table A16 Number of Recip<strong>ie</strong>nts, Qualif<strong>ie</strong>d Adults and Qualif<strong>ie</strong>d Children of Weekly <strong>Social</strong>18<strong>Welfare</strong> Payments, <strong>2009</strong>Table A17 Number of Recip<strong>ie</strong>nts, Qualif<strong>ie</strong>d Adults and Qualif<strong>ie</strong>d Children of Weekly <strong>Social</strong>19<strong>Welfare</strong> Payments by Lifestage Cycle, <strong>2009</strong>Table A18 Number of Pers<strong>on</strong>s in each <strong>Social</strong> Insurance Class, 2008 and <strong>2009</strong> 20Table A19 Number of Insured Pers<strong>on</strong>s, 1999/2000 to 2008 21Table A20 <strong>Social</strong> <strong>Welfare</strong> Weekly Rates of Payment from January <strong>2009</strong> 22Table A21 <strong>Social</strong> <strong>Welfare</strong> Weekly Rates of Payment from January 2010 23Table A22 Index of Short-Term Rates of Payment and C<strong>on</strong>sumer Price Index, 2000 to <strong>2009</strong> 24Table A23 Index of L<strong>on</strong>g-Term Rates of Payment and C<strong>on</strong>sumer Price Index, 2000 to <strong>2009</strong> 243Secti<strong>on</strong> B – Older PeoplePageTable B1 Expenditure <strong>on</strong> Older People by Payment Type, 2008 and <strong>2009</strong> 27Table B2 Expenditure <strong>on</strong> Older People by Payment Type, 2000 to <strong>2009</strong> 28Table B3 Number of Recip<strong>ie</strong>nts by Type of State Pensi<strong>on</strong>, 2000 to <strong>2009</strong> 28Table B4Number of Recip<strong>ie</strong>nts of State Pensi<strong>on</strong>s by Type of Pensi<strong>on</strong> and Number of Qualif<strong>ie</strong>dAdults and Children, <strong>2009</strong>29<str<strong>on</strong>g>Statistical</str<strong>on</strong>g> <str<strong>on</strong>g>Informati<strong>on</strong></str<strong>on</strong>g> <strong>on</strong> <strong>Social</strong> <strong>Welfare</strong> <strong>Services</strong> <strong>2009</strong>
summary and list older of financial people tablesTable B5 Number of Recip<strong>ie</strong>nts of State Pensi<strong>on</strong>s by Type of Pensi<strong>on</strong>, Age and Sex, <strong>2009</strong> 30Table B6 Number of Recip<strong>ie</strong>nts of Pre-Retirement Allowance by Age and Sex, <strong>2009</strong> 30Table B7Number of Recip<strong>ie</strong>nts of Living Al<strong>on</strong>e Allowance, Over 80 Allowance and IslandAllowance by Pensi<strong>on</strong> Type, <strong>2009</strong>Table B8 Number of Recip<strong>ie</strong>nts of State Pensi<strong>on</strong>s by Type of Payment and County, <strong>2009</strong> 3130Secti<strong>on</strong> C - Widows, Widowers And One-Parent Famil<strong>ie</strong>sPageTable C1 Expenditure <strong>on</strong> Widow’s, Widower’s and One-Parent Famil<strong>ie</strong>s by Payment Type, 2008and <strong>2009</strong>Table C2 Expenditure <strong>on</strong> Widow/er’s Pensi<strong>on</strong>s, 2000 to <strong>2009</strong> 35Table C3Expenditure <strong>on</strong> Deserted Wife’s Benefit, Deserted Wife’s Allowance, Pris<strong>on</strong>er’s Wife’sAllowance and One-Parent Family Payment, 2000 to <strong>2009</strong>Table C4 Number of Recip<strong>ie</strong>nts of Widow/er’s Pensi<strong>on</strong>s, 2000 to <strong>2009</strong> 36Table C5Number of Recip<strong>ie</strong>nts of Widow/er’s (C<strong>on</strong>tributory)Pensi<strong>on</strong> and Deserted Wife’sBenefit by Number of Qualif<strong>ie</strong>d Children, <strong>2009</strong>Table C6 Number of Recip<strong>ie</strong>nts of Widow/er’s Pensi<strong>on</strong>s by Age and Sex, <strong>2009</strong> 37Table C7Table C8Table C9Table C10Table C11Table C12Number of Recip<strong>ie</strong>nts of Deserted Wife’s Benefit, Deserted Wife’s Allowance, andOne-Parent Family Payment, 2000 to <strong>2009</strong>Number of Recip<strong>ie</strong>nts of Deserted Wife’s Benefit, Deserted Wife’s Allowance by Age,<strong>2009</strong>Number of Recip<strong>ie</strong>nts of One-Parent Family Payment by Status of Parent and Numberof Qualif<strong>ie</strong>d Children, <strong>2009</strong>Number of Recip<strong>ie</strong>nts of One-Parent Family Payment by Status of Parent, Age andSex, <strong>2009</strong>Number of Recip<strong>ie</strong>nts of Widow/er’s Pensi<strong>on</strong>s, Deserted Wife’s Benefit, DesertedWife’s Allowance in receipt of Living Al<strong>on</strong>e and Over 80 Allowances, <strong>2009</strong>Number of Recip<strong>ie</strong>nts of Widow’s, Widower’s and One-Parent Family Payments byPayment Type and County, <strong>2009</strong>353637383838393940xiSecti<strong>on</strong> D - Child Related PaymentsPageTable D1 Expenditure <strong>on</strong> Child Related Payments by Payment Type, 2008 and <strong>2009</strong> 43Table D2 Expenditure <strong>on</strong> Child Benefit, 2000 to <strong>2009</strong> 43Table D3Expenditure <strong>on</strong> Guardian’s Payment (C<strong>on</strong>tributory) and Guardian’s Payment (N<strong>on</strong>-C<strong>on</strong>tributory), 2000 to <strong>2009</strong>Table D4 Expenditure <strong>on</strong> Maternity, Adoptive, and Health & Safety Benefits, 2000 to <strong>2009</strong> 44Table D5 Number of Recip<strong>ie</strong>nts of Guardian’s Payment, 2008 and <strong>2009</strong> 44Table D6 Number of Recip<strong>ie</strong>nts of Maternity Benefit, Adoptive Benefit and Health & Safety 45Benefit, 2008 and <strong>2009</strong>Table D7 Number of Famil<strong>ie</strong>s and Child Beneficiar<strong>ie</strong>s of Child Benefit, 2000 to <strong>2009</strong> 45Table D8 Number of Famil<strong>ie</strong>s Receiving Child Benefit by Number of Child Beneficiar<strong>ie</strong>s, 2000 45to <strong>2009</strong>Table D9 Number of Child Beneficiar<strong>ie</strong>s of Child Benefit by Age, 2000 to <strong>2009</strong> 46Table D10 Number of Qualif<strong>ie</strong>d Child Increases by Payment Type, <strong>2009</strong> 47Table D11 Number of Recip<strong>ie</strong>nts of Guardian’s Payment, Child Benefit, Maternity Benefit andHealth & Safety Benefit by County, <strong>2009</strong>4844<str<strong>on</strong>g>Statistical</str<strong>on</strong>g> <str<strong>on</strong>g>Informati<strong>on</strong></str<strong>on</strong>g> <strong>on</strong> <strong>Social</strong> <strong>Welfare</strong> <strong>Services</strong> <strong>2009</strong>
older summary list of people tables and financialSecti<strong>on</strong> E - Illness, Disability And CaringPagexiiTable E1 Expenditure <strong>on</strong> Illness, Disability and Caring by Payment Type, 2008 and <strong>2009</strong> 51Table E2 Expenditure <strong>on</strong> Illness, Disability and Caring by Payment Type, 2000 to <strong>2009</strong> 51Table E3Recip<strong>ie</strong>nts of Illness, Disability and Caring Payments by Payment Type, 2008 and<strong>2009</strong>Table E4 Number of Recip<strong>ie</strong>nts of Invalidity Pensi<strong>on</strong>, Illness Benefit, Disablement Pensi<strong>on</strong>, 52Disability Allowance, Carer’s Allowance,Death Benefit Pensi<strong>on</strong> & Blind Pensi<strong>on</strong>,2000 to <strong>2009</strong>Table E5 Number of Living Al<strong>on</strong>e and Over 80 Allowances by Payment Type, <strong>2009</strong> 53Table E6 Number of Recip<strong>ie</strong>nts of Illness Benefit by Age and Sex, <strong>2009</strong> 53Table E7 Number of Recip<strong>ie</strong>nts of Invalidity Pensi<strong>on</strong> by Age and Sex, <strong>2009</strong> 53Table E8 Number of Recip<strong>ie</strong>nts of Carer’s Allowance, Carer’s Benefit and Respite Care Grant by 54Age and Sex, <strong>2009</strong>Table E9 Number of Recip<strong>ie</strong>nts of Half Rate Carers By Payment Type <strong>2009</strong> 54Table E10 Number of Recip<strong>ie</strong>nts of Blind Pensi<strong>on</strong> by Age and Sex, <strong>2009</strong> 55Table E11 Number of Recip<strong>ie</strong>nts of Disability Allowance by Age and Sex, <strong>2009</strong> 55Table E12 Number of Recip<strong>ie</strong>nts of Death Benefit Pensi<strong>on</strong>, Disablement Pensi<strong>on</strong> and Incapacity 55Supplement by Age and Sex, <strong>2009</strong>Table E13 Number of Recip<strong>ie</strong>nts of Injury Benefit and Interim Illness Benefit by Age and Sex, 56<strong>2009</strong>Table E14 Number of Recip<strong>ie</strong>nts of Disablement Pensi<strong>on</strong> by Degree of Disablement and by Sex, 56<strong>2009</strong>Table E15 Number of Recip<strong>ie</strong>nts of Illness, Disability and Caring Payments by Payment Type 57and Number of Dependants, <strong>2009</strong>Table E16 Number of Disablement Cases Referred to Medical Assessors for Assessment or58Reassessment, 2000 to <strong>2009</strong>Table E17 Number of Illness Benefit, Invalidity Pensi<strong>on</strong> and Incapacity Supplement Cases59Referred to Medical Assessors, 2000 to <strong>2009</strong>Table E18 Number of Disability Allowance Cases Referred to Medical Assessors, 2000 to <strong>2009</strong> 59Table E19 Number of Recip<strong>ie</strong>nts of Illness, Disability and Caring Payments by Payment Typeand County, <strong>2009</strong>6052Secti<strong>on</strong> F – Jobseeker’s SupportsPageTable F1 Expenditure <strong>on</strong> Jobseeker’s Supports by Payment Type, 2008 and <strong>2009</strong> 63Table F2 Expenditure <strong>on</strong> Jobseeker’s Supports by Payment Type, 2000 to <strong>2009</strong> 63Table F3Table F4Number of Recip<strong>ie</strong>nts of Jobseeker’s Benefit and Jobseeker’s Allowance, 2000 to<strong>2009</strong>Number of Recip<strong>ie</strong>nts of Jobseeker’s Benefit and Jobseeker’s Allowance by Numberof Dependants, <strong>2009</strong>Table F5 Number of Pers<strong>on</strong>s <strong>on</strong> the Live Register <strong>on</strong> the last Friday of each M<strong>on</strong>th, <strong>2009</strong> 65Table F6 Average Number of Pers<strong>on</strong>s <strong>on</strong> the Live Register, 2000 to <strong>2009</strong> 65Table F7 Flows <strong>on</strong> and off the Live Register by M<strong>on</strong>th, <strong>2009</strong> 65Table F8 Number of Pers<strong>on</strong>s <strong>on</strong> the Live Register by Age and Sex, October <strong>2009</strong> 66Table F9Number of Pers<strong>on</strong>s <strong>on</strong> the Live Register in October <strong>2009</strong>, Classif<strong>ie</strong>d by Durati<strong>on</strong> ofClaim636467<str<strong>on</strong>g>Statistical</str<strong>on</strong>g> <str<strong>on</strong>g>Informati<strong>on</strong></str<strong>on</strong>g> <strong>on</strong> <strong>Social</strong> <strong>Welfare</strong> <strong>Services</strong> <strong>2009</strong>
summary and list older of financial people tablesTable F10Table F11Table F12Table F13Number of Pers<strong>on</strong>s <strong>on</strong> the Live Register in October by Sex and Durati<strong>on</strong>, 2000 to<strong>2009</strong>Categor<strong>ie</strong>s Excluded from the Live Register: Number of Short-Time Workers, Self-Employed and Pers<strong>on</strong>s aged 65 and over, in each M<strong>on</strong>th during <strong>2009</strong>Categor<strong>ie</strong>s Excluded from the Live Register: Average Number of Short-Time Workers,Self-Employed and Pers<strong>on</strong>s aged 65 and over, 2000 to <strong>2009</strong>Average Live Register, Total Labour Force and Seas<strong>on</strong>ally Adjusted StandardisedUnemployment Rate, 2000 to <strong>2009</strong>Table F14 Numbers <strong>on</strong> the Live Register by County, 2000 to <strong>2009</strong> 7068696969Secti<strong>on</strong> G – Employment SupportsPageTable G1 Expenditure <strong>on</strong> Employment Supports by Payment Type, 2008 and <strong>2009</strong> 73Table G2 Expenditure <strong>on</strong> Family Income Supplement and Other Employment Supports, 2000to <strong>2009</strong>Table G3 Number of Recip<strong>ie</strong>nts of Employment Supports By Payment Type, 2008 and <strong>2009</strong> 74Table G4 Number of Famil<strong>ie</strong>s receiving Family Income Supplement, 2000 to <strong>2009</strong> 74Table G5 Recip<strong>ie</strong>nts of Family Income Supplement by Age & Sex, <strong>2009</strong> 75Table G6 Number of Famil<strong>ie</strong>s receiving Family Income Supplement By Rate of Payment and 75Family Size, <strong>2009</strong>Table G7 Number of Famil<strong>ie</strong>s receiving Family Income Supplement By Age of Recip<strong>ie</strong>nt and 75Family Income Group, <strong>2009</strong>Table G8 Number of Famil<strong>ie</strong>s receiving Family Income Supplement By Family Status and76Income Group, <strong>2009</strong>Table G9 Number of Recip<strong>ie</strong>nts of Back to Work Allowance By Employment Status and Sex, 76<strong>2009</strong>Table G10 Number of Recip<strong>ie</strong>nts of Back to Work Enterprise Allowance, Back to Work76Allowance, Back to Educati<strong>on</strong> Allowance and Farm Assist, by Age and Sex, <strong>2009</strong>Table G11 Number of Recip<strong>ie</strong>nts of Farm Assist, 2000 to <strong>2009</strong> 77Table G12 Number of People <strong>on</strong> the Live Register Referred to FÁS Under the Nati<strong>on</strong>al77Employment Acti<strong>on</strong> Plan (NEAP), 2000 to <strong>2009</strong>Table G13 Number of Recip<strong>ie</strong>nts of Short-Term Enterprise Allowance, Work Placement77Programme Graduate and Work Placement Programme Open, by Age and Sex, <strong>2009</strong>Table G14 Number of Recip<strong>ie</strong>nts of Employment Supports by County, <strong>2009</strong> 7874xiiiSecti<strong>on</strong> H – Supplementary <strong>Welfare</strong> AllowancePageTable H1 Expenditure <strong>on</strong> Supplementary <strong>Welfare</strong> Allowance by Scheme, 2008 and <strong>2009</strong> 81Table H2 Expenditure <strong>on</strong> Supplementary <strong>Welfare</strong> Allowance Scheme, 2000 to <strong>2009</strong> 81Table H3Table H4Table H5Expenditure <strong>on</strong> Excepti<strong>on</strong>al Needs Payments, Other Excepti<strong>on</strong>al Supplementary<strong>Welfare</strong> Allowance Payments and Urgent Needs Payments, <strong>2009</strong>Number of Recip<strong>ie</strong>nts of Supplementary <strong>Welfare</strong> Allowance By Health ServiceExecutive Area, <strong>2009</strong>Recip<strong>ie</strong>nts and Expenditure <strong>on</strong> Basic Supplementary <strong>Welfare</strong> Allowance, RentSupplement, Mortgage Interest Supplement, Local Authority Mortgage InterestSupplement and Other Supplements, 2000 to <strong>2009</strong>828383<str<strong>on</strong>g>Statistical</str<strong>on</strong>g> <str<strong>on</strong>g>Informati<strong>on</strong></str<strong>on</strong>g> <strong>on</strong> <strong>Social</strong> <strong>Welfare</strong> <strong>Services</strong> <strong>2009</strong>
older summary list of people tables and financialxivTable H6 Number of Recip<strong>ie</strong>nts of Basic Supplementary <strong>Welfare</strong> Allowance, Rent Supplement, 84Mortgage Interest Supplement and Local Authority Mortgage Interest Supplementand other Supplements by Age and Sex, <strong>2009</strong>Table H7 Number of Recip<strong>ie</strong>nts of Rent Supplement, Mortgage Interest Supplement and Local 85Authority Mortgage Interest Supplement by Primary Payment, <strong>2009</strong>Table H8 Number of Recip<strong>ie</strong>nts of Rent Supplement, Mortgage Interest Supplement and Local 85Authority Mortgage Interest Supplement by Claim Durati<strong>on</strong>, <strong>2009</strong>Table H9 Number of Recip<strong>ie</strong>nts of Back to School Clothing and Footwear Allowance by Health 86Service Executive Area, <strong>2009</strong>Table H10 Expenditure <strong>on</strong> Back to School Clothing and Footwear Allowance by Health Service 86Executive Area, 2008 and <strong>2009</strong>Table H11 Number of Recip<strong>ie</strong>nts of Basic Supplementary <strong>Welfare</strong> Allowance Payments by87Category, <strong>2009</strong>Table H12 Number of Recip<strong>ie</strong>nts of Rent Supplement by Durati<strong>on</strong> and by Primary Payment,88<strong>2009</strong>Table H13 Number of Recip<strong>ie</strong>nts of Rent Supplement by Age and Durati<strong>on</strong>, <strong>2009</strong> 89Table H14 Short-Term and L<strong>on</strong>g-Term Recip<strong>ie</strong>nts of Rent Supplement by Primary Payment,90<strong>2009</strong>Table H15 Short-Term and L<strong>on</strong>g-Term Recip<strong>ie</strong>nts of Rent Supplement by County, <strong>2009</strong> 91Table H16 Number of Recip<strong>ie</strong>nts of Basic Supplementary <strong>Welfare</strong> Allowance, Rent Supplement,Mortgage Interest Supplement and Local Authority Mortgage Interest Supplementand Other Supplements by County, <strong>2009</strong>92Secti<strong>on</strong> J - Miscellaneous Payments And GrantsPageTable J1Table J2Expenditure <strong>on</strong> Miscellaneous Payments and Grants by Payment Type, 2008 and<strong>2009</strong>Total Expenditure <strong>on</strong> Household Benefits, Free Travel and Fuel Allowance, 2000 to<strong>2009</strong>Table J3 Miscellaneous Benefits and Allowances: Number of Claims Awarded, 2008 and <strong>2009</strong> 95Table J4 Number of Recip<strong>ie</strong>nts of Household Benefits by Type of Payment Received, <strong>2009</strong> 96Table J5 Number of Recip<strong>ie</strong>nts of <strong>Social</strong> <strong>Welfare</strong> Payments by Payment Type and Method of 98Payment, <strong>2009</strong>Table J6 Pers<strong>on</strong>al Public Service Numbers Issued by Country, 2000 to <strong>2009</strong> 999595<str<strong>on</strong>g>Statistical</str<strong>on</strong>g> <str<strong>on</strong>g>Informati<strong>on</strong></str<strong>on</strong>g> <strong>on</strong> <strong>Social</strong> <strong>Welfare</strong> <strong>Services</strong> <strong>2009</strong>
summary list and older of financial people graphsList of GraphsPageGraph A1 Expenditure <strong>on</strong> <strong>Social</strong> <strong>Welfare</strong> by Programme, <strong>2009</strong> 3Graph A2 Expenditure <strong>on</strong> Main <strong>Social</strong> Insurance Schemes, 2000 to <strong>2009</strong> 7Graph A3 Expenditure <strong>on</strong> Main <strong>Social</strong> Assistance Schemes, 2000 to <strong>2009</strong> 9Graph A4 Financing of the <strong>Social</strong> Insurance Fund, <strong>2009</strong> 9Graph A5 Number of Recip<strong>ie</strong>nts of Weekly <strong>Social</strong> <strong>Welfare</strong> Payments By Programme Area, <strong>2009</strong> 9Graph A6 Recip<strong>ie</strong>nts of Main <strong>Social</strong> Insurance Payments, 2000 to <strong>2009</strong> 12Graph A7 Recip<strong>ie</strong>nts of Main <strong>Social</strong> Assistance Payments, 2000 to <strong>2009</strong> 12Graph A8 Analysis of Insured Populati<strong>on</strong>, 2008 21Graph B1 Number of Recip<strong>ie</strong>nts of State Pensi<strong>on</strong>s, 2000 to <strong>2009</strong> 27Graph C1 Number of Recip<strong>ie</strong>nts of One-Parent Family Payment by Age and Sex, <strong>2009</strong> 35Graph D1 Number of Famil<strong>ie</strong>s receiving Child Benefit by Number of Child Beneficiar<strong>ie</strong>s, 2000to <strong>2009</strong>Graph E1 Number of Recip<strong>ie</strong>nts of Carer’s Allowance by Sex, 2000 to <strong>2009</strong> 50Graph F1 Expenditure <strong>on</strong> Jobseeker’s Benefit and Jobseeker’s Allowance, 2000 to <strong>2009</strong> 64Graph F2 Number of People <strong>on</strong> the Live Register by Age and Sex, <strong>2009</strong> 66Graph F3 Number of People <strong>on</strong> the Live Register in October <strong>2009</strong>, by Sex and Durati<strong>on</strong> 68Graph G1 Expenditure <strong>on</strong> Employment Supports, 2000 to <strong>2009</strong> 73Graph H1 Expenditure <strong>on</strong> Supplementary <strong>Welfare</strong> Allowance Scheme, 2000 to <strong>2009</strong> 81Graph J1 Expenditure <strong>on</strong> Household Benefits, Free Travel and Fuel Allowances, <strong>2009</strong> 94Graph J2 Number of Recip<strong>ie</strong>nts of <strong>Social</strong> <strong>Welfare</strong> Payments by Method of Payment, <strong>2009</strong> 97Graph J3 Pers<strong>on</strong>al Public Service Numbers Issued, 2000 to <strong>2009</strong> 9743xv<str<strong>on</strong>g>Statistical</str<strong>on</strong>g> <str<strong>on</strong>g>Informati<strong>on</strong></str<strong>on</strong>g> <strong>on</strong> <strong>Social</strong> <strong>Welfare</strong> <strong>Services</strong> <strong>2009</strong>
xvi<str<strong>on</strong>g>Statistical</str<strong>on</strong>g> <str<strong>on</strong>g>Informati<strong>on</strong></str<strong>on</strong>g> <strong>on</strong> <strong>Social</strong> <strong>Welfare</strong> <strong>Services</strong> <strong>2009</strong>
Secti<strong>on</strong> ASummary and Financial
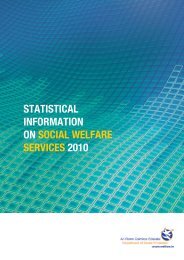
older summary people and financialSecti<strong>on</strong> A: Summary and FinancialExpenditureTotal <strong>Social</strong> <strong>Welfare</strong> expenditure in <strong>2009</strong> was €20,529 milli<strong>on</strong>, an increase of 15.3% over 2008. Expenditure in<strong>2009</strong> represented 36.8% of Gross Current Government expenditure and was equivalent to 15.6% of GNP (Table A2).The main areas of expenditure by programme group were Older People ( 22.3%), Widow’s, Widower’s and One ParentFamil<strong>ie</strong>s ( 12.7%), Illness, Disability and Caring ( 17.1 %), Jobseeker’s Supports ( 18.2 %), Child Related Payments(14.0%), Supplementary <strong>Welfare</strong> Allowance ( 4.7%) and Employment Supports (2.2%). Administrati<strong>on</strong> of the <strong>Social</strong><strong>Welfare</strong> system accounted for 2.8% of total expenditure (Graph A1).Total <strong>Social</strong> <strong>Welfare</strong> expenditure was financed by the Exchequer (52.4%) and the <strong>Social</strong> Insurance Fund (47.6%).The <strong>Social</strong> Insurance Fund was financed by Pay-Related <strong>Social</strong> Insurance c<strong>on</strong>tributi<strong>on</strong>s from employers (72.5%),employees (21.4%), the self-employed (4.3%) and investment income (1.8%). See Tables A6 and A7.Recip<strong>ie</strong>nts of Weekly <strong>Social</strong> <strong>Welfare</strong> Payments2Over 1,379,200 people were in receipt of a weekly social welfare payment at the end of <strong>2009</strong>. As these paymentsincluded increases in respect of over 175,000 Qualif<strong>ie</strong>d Adults and over 466,200 children, al<strong>on</strong>g with Family IncomeSupplement payments made in respect of over 55,700 children, there were over 2,076,200 beneficiar<strong>ie</strong>s in all.Notes: Scheme Changes and Comparability of Year-<strong>on</strong>-Year Data(a) In 2006 age related pensi<strong>on</strong>s were replaced by State Pensi<strong>on</strong>s, with significant administrative alterati<strong>on</strong>s toseveral weekly payment types which had up to that point provided for people aged over 65. These alterati<strong>on</strong>s,implemented in stages following the introducti<strong>on</strong> of the State Pensi<strong>on</strong>s, have resulted in substantial migrati<strong>on</strong>sof recip<strong>ie</strong>nts between scheme types, with accompanying changes in expenditure and recip<strong>ie</strong>nts <strong>on</strong> theseschemes. The most significant transfers of recip<strong>ie</strong>nts were those involving State Pensi<strong>on</strong> (C<strong>on</strong>tributory),formerly known as Old Age Pensi<strong>on</strong> (C<strong>on</strong>tributory), and State Pensi<strong>on</strong> (Transiti<strong>on</strong>), formerly known asRetirement Pensi<strong>on</strong>.Recip<strong>ie</strong>nts of Widow/er’s Pensi<strong>on</strong>, Deserted Wife’s Allowance, Blind Pensi<strong>on</strong>, One Parent Family Payment andPris<strong>on</strong>er’s Wife’s Allowance have since 2006 transferred to State Pensi<strong>on</strong> (N<strong>on</strong>-C<strong>on</strong>tributory) up<strong>on</strong> reaching66 years of age, resulting in some decreases in recip<strong>ie</strong>nts and expenditure <strong>on</strong> such schemes and c<strong>on</strong>comitantincreases in recip<strong>ie</strong>nts and expenditure <strong>on</strong> State Pensi<strong>on</strong> (N<strong>on</strong>-C<strong>on</strong>tributory). Recip<strong>ie</strong>nts of Invalidity Pensi<strong>on</strong>aged 66 years or over are now automatically transferred to State Pensi<strong>on</strong> (C<strong>on</strong>tributory) <strong>on</strong> reaching that agethreshold.One effect of these changes is the erosi<strong>on</strong> of data comparability between 2006 and 2007 in relati<strong>on</strong> torecip<strong>ie</strong>nts and expenditure <strong>on</strong> the schemes altered in 2006 and 2007. For instance, expenditure <strong>on</strong> StatePensi<strong>on</strong> (C<strong>on</strong>tributory) rose by 74.3% between 2006 and 2007, while that <strong>on</strong> State Pensi<strong>on</strong> (Transiti<strong>on</strong>) fell by90.8% over the same period, due to the major shifts in numbers of recip<strong>ie</strong>nts of these weekly payment types.(b) Increases in the maximum durati<strong>on</strong> and maximum payment of Maternity Benefit have resulted in asignificant increase in expenditure <strong>on</strong> the scheme. In March 2006 the maximum durati<strong>on</strong> of Maternity Benefit,Adoptive Benefit and Health and Safety Benefit claims was increased from 18 to 22 weeks, with a subsequentextensi<strong>on</strong> of Maternity Benefit in March 2007 to 26 weeks.(c) From September 2007 a pers<strong>on</strong> may receive half rate carer’s allowance while in receipt of another socialwelfare payment. This may result in double counting<str<strong>on</strong>g>Statistical</str<strong>on</strong>g> <str<strong>on</strong>g>Informati<strong>on</strong></str<strong>on</strong>g> <strong>on</strong> <strong>Social</strong> <strong>Welfare</strong> <strong>Services</strong> <strong>2009</strong>
summary and older financial peopleGraph A1: Expenditure <strong>on</strong> <strong>Social</strong> <strong>Welfare</strong> by Programme, <strong>2009</strong>Jobseeker’s Supports 18.2%Employment Supports 2.2%Supplementary <strong>Welfare</strong>Allowance 4.7%Administrati<strong>on</strong> 2.8%Older People 22.3%Widows, Widowers & OneParent Famil<strong>ie</strong>s 12.7%Child Related Payments 14.0%Illness, Disability andCaring 17.1%Miscellaneous Paymentsand Grants 5.9%Table A1: Expenditure <strong>on</strong> <strong>Social</strong> <strong>Welfare</strong> by Programme, 2008 and <strong>2009</strong>Programme 2008 <strong>2009</strong> (1) Change <strong>2009</strong> over 2008€000 €000Older People 4,300,375 4,569,654 6.3%Widows, Widowers and One Parent Famil<strong>ie</strong>s 2,504,699 2,608,360 4.1%Child Related Payments 2,793,575 2,877,039 3.0%Illness, Disability and Caring 3,301,142 3,504,509 6.2%Jobseeker’s Supports 2,087,695 3,738,330 79.1%Employment Supports 415,721 454,318 9.3%Supplementary <strong>Welfare</strong> Allowance 803,835 969,724 20.6%Miscellaneous Payments and Grants 1,021,730 1,214,540 18.9%Administrati<strong>on</strong> 579,815 592,635 2.2%Total Expenditure 17,808,587 20,529,109 15.3%(1) Provisi<strong>on</strong>al3Table A2: Expenditure <strong>on</strong> <strong>Social</strong> <strong>Welfare</strong> as a Percentage of Current GovernmentExpenditure, GNP and GDP, 2000 to <strong>2009</strong>YearTotal <strong>Social</strong> <strong>Welfare</strong>Expenditure (1) (€m)Index ofExpenditure<strong>Social</strong> <strong>Welfare</strong> Expenditure as a percentage of (3)C<strong>on</strong>sumer PriceIndex (2) Gross Current Gross Gross DomesticGovernmentExpenditureNati<strong>on</strong>alProductProduct2000 (4) 6,713 100.0 100.0 25.9 7.5 6.42001 (4) 7,842 116.8 104.9 26.2 8.0 6.72002 (4) 9,517 141.8 109.7 28.8 8.9 7.32003 (4) 10,493 156.3 113.6 28.9 8.9 7.52004 (4) 11,291 168.2 116.0 28.9 8.9 7.62005 (4) 12,168 181.3 118.9 28.2 8.9 7.52006 (4) 13,586 202.4 123.6 28.6 8.9 7.72007 (4) 15,518 231.2 129.6 29.4 9.6 8.22008 (4) 17,809 265.3 134.9 33.4 11.5 9.8<strong>2009</strong> (4) 20,529 305.8 128.8 36.8 15.6 12.6(1) Includes the full cost of Supplementary <strong>Welfare</strong> Allowance which is administered by the Health Service Executive.(2) Re-based from C<strong>on</strong>sumer Price Index data published by the Central Statistics Office.(3) Source: Central Statistics Office(4) Total <strong>Social</strong> <strong>Welfare</strong> expenditure for these years includes expenditure <strong>on</strong> the Redundancy and Insolvency Schemes which are administered by theDepartment of Enterprise, Trade and Innovati<strong>on</strong>.<str<strong>on</strong>g>Statistical</str<strong>on</strong>g> <str<strong>on</strong>g>Informati<strong>on</strong></str<strong>on</strong>g> <strong>on</strong> <strong>Social</strong> <strong>Welfare</strong> <strong>Services</strong> <strong>2009</strong>
older summary people and financialTable A3: Expenditure <strong>on</strong> <strong>Social</strong> <strong>Welfare</strong> by Payment Type, 2008 and <strong>2009</strong>4Type of Payment 2008 <strong>2009</strong> (3) Change€000 €000State Pensi<strong>on</strong> (C<strong>on</strong>tributory) 3,117,855 3,367,529 8.0%State Pensi<strong>on</strong> (Transiti<strong>on</strong>) 92,089 104,973 14.0%State Pensi<strong>on</strong> (N<strong>on</strong>-C<strong>on</strong>tributory) 972,765 1,000,546 2.9%Pre-Retirement Allowance 117,666 96,606 -17.9%Total Older People 4,300,375 4,569,654 6.3%Widow/er’s (C<strong>on</strong>tributory) Pensi<strong>on</strong> 1,299,039 1,353,507 4.2%Widow/er’s (N<strong>on</strong>-C<strong>on</strong>tributory) Pensi<strong>on</strong> 21,181 21,275 0.4%Deserted Wife’s Benefit 104,618 100,261 -4.2%Deserted Wife’s Allowance 6,624 6,038 -8.8%Pris<strong>on</strong>er’s Wife’s Allowance 7 6 -14.3%One Parent Family Payment 1,067,158 1,121,344 5.1%Widowed Parent Grant (C<strong>on</strong>tributory) 5,543 5,504 -0.7%Widowed Parent Grant (N<strong>on</strong>-C<strong>on</strong>tributory) 529 425 -19.7%Total Widows, Widowers and One Parent Famil<strong>ie</strong>s 2,504,699 2,608,360 4.1%Maternity Benefit 315,878 331,319 4.9%Health and Safety Benefit 576 619 7.5%Adoptive Benefit 1,644 1,247 -24.1%Guardian’s Payment (C<strong>on</strong>tributory) 14,373 11,509 -19.9%Guardian’s Payment (N<strong>on</strong>-C<strong>on</strong>tributory) 7,147 6,024 -15.7%Child Benefit 2,453,957 2,495,304 1.7%Domiciliary Care Allowance 0 31,017 100.0%Total Child Related Payments 2,793,575 2,877,039 3.0%Illness Benefit 852,305 919,640 7.9%Invalidity Pensi<strong>on</strong> 685,717 681,641 -0.6%Injury Benefit 19,250 20,974 9.0%Disablement Benefit 84,443 85,652 1.4%Death Benefit 8,036 5,374 -33.1%Disability Allowance 1,052,660 1,142,769 8.6%Medical Care 282 309 9.6%Carer’s Allowance 450,260 502,469 11.6%Carer’s Benefit 33,666 30,204 -10.3%Respite Care Grant 98,204 99,200 1.0%Blind Pensi<strong>on</strong> 16,319 16,277 -0.3%Total Illness, Disability and Caring 3,301,142 3,504,509 6.2%Jobseeker’s Benefit 928,844 1,733,774 86.7%Jobseeker’s Allowance 1,158,851 2,004,556 73.0%Total Jobseeker’s Supports 2,087,695 3,738,330 79.1%Family Income Supplement 170,309 167,133 -1.9%Employment Support <strong>Services</strong> (1) 160,531 193,888 20.8%Farm Assist 84,881 93,297 9.9%Total Employment Supports 415,721 454,318 9.3%Supplementary <strong>Welfare</strong> Allowance 803,835 969,724 20.6%Total Supplemetary <strong>Welfare</strong> Allowance 803,835 969,724 20.6%Treatment Benefits (1) 97,124 100,179 3.1%Rent Allowance 732 725 -1.0%Household Benefits and Free Travel (1) 578,688 626,219 8.2%Miscellaneous (1) 142,922 137,284 -3.9%Redundancy and Insolvency (2) 202,264 350,133 73.1%Total Miscellaneous Payments and Grants 1,021,730 1,214,540 18.9%Administrati<strong>on</strong> - Insurance Schemes 257,780 281,423 9.2%Administrati<strong>on</strong> - Assistance Schemes 322,035 311,212 -3.4%Total Adminstrati<strong>on</strong> 579,815 592,635 2.2%Grand Total 17,808,587 20,529,109 15.3%(1) See Additi<strong>on</strong>al Expenditure Details in Table A4.(2) These schemes are administered by the Department of Enterprise, Trade and Innovati<strong>on</strong>.(3) Provisi<strong>on</strong>al.<str<strong>on</strong>g>Statistical</str<strong>on</strong>g> <str<strong>on</strong>g>Informati<strong>on</strong></str<strong>on</strong>g> <strong>on</strong> <strong>Social</strong> <strong>Welfare</strong> <strong>Services</strong> <strong>2009</strong>
summary and older financial peopleTable A4: Additi<strong>on</strong>al Expenditure Details, 2008 and <strong>2009</strong>Additi<strong>on</strong>al Details 2008 <strong>2009</strong> (1) ChangeEMPLOYMENT SUPPORT SERVICES€000 €000Back to Work Allowance/Back to Work Enterprise73,169 76,434 4.5%AllowanceBack to Educati<strong>on</strong> Allowance 77,136 107,316 39.1%Part-time Job Incentive Scheme 1,324 1,445 9.1%Other 8,902 8,693 -2.3%TOTAL 160,531 193,888 20.8%TREATMENT BENEFITSDental 69,419 70,818 2.0%Optical 21,703 21,994 1.3%Medical and Surgical 6,002 7,367 22.7%TOTAL 97,124 100,179 3.1%Household Benefits and Free Travel (1)<strong>Social</strong> InsuranceFuel Allowances 54,229 64,096 18.2%Free Electricity 92,772 99,190 6.9%Free Bottled Gas 15 17 13.3%Free Natural Gas 11,433 13,052 14.2%Free Televisi<strong>on</strong> Licence 33,976 33,981 0.0%Free Teleph<strong>on</strong>e Rental 62,155 62,717 0.9%TOTAL 254,580 273,053 7.3%Household Benefits and Free Travel (1)<strong>Social</strong> AssistanceFuel Allowances 115,779 129,528 11.9%Free Travel 68,428 73,489 7.4%Free Electricity 63,966 66,325 3.7%Free Bottled Gas 80 725 806.3%Free Natural Gas 4,098 3,905 -4.7%Free Televisi<strong>on</strong> Licence 21,722 21,731 0.0%Free Teleph<strong>on</strong>e Rental 50,035 57,463 14.8%TOTAL 324,108 353,166 9.0%MISCELLANEOUSBereavement Grants 17,851 18,471 3.5%School Meals 32,422 34,848 7.5%Combat Poverty Agency 4,114 1,564 -62.0%Citizen’s <str<strong>on</strong>g>Informati<strong>on</strong></str<strong>on</strong>g> Board (Comhairle) 29,468 28,005 -5.0%Family Support Agency 35,981 34,660 -3.7%M<strong>on</strong>ey Advice and Budgeting <strong>Services</strong> 16,217 17,041 5.1%Other Grants/Payments 6,869 2,695 -60.8%TOTAL 142,922 137,284 -3.9%5(1) Provisi<strong>on</strong>al.<str<strong>on</strong>g>Statistical</str<strong>on</strong>g> <str<strong>on</strong>g>Informati<strong>on</strong></str<strong>on</strong>g> <strong>on</strong> <strong>Social</strong> <strong>Welfare</strong> <strong>Services</strong> <strong>2009</strong>
older summary people and financialTable A5: <strong>Social</strong> Insurance and <strong>Social</strong> Assistance Expenditure by Scheme, 2008 and <strong>2009</strong>6Type of Payment Expenditure Change2008 <strong>2009</strong> (2)%€000 €000State Pensi<strong>on</strong> (C<strong>on</strong>tributory) 3,117,855 3,367,529 8.0%State Pensi<strong>on</strong> (Transiti<strong>on</strong>) 92,089 104,973 14.0%Widow/er’s (C<strong>on</strong>tributory) Pensi<strong>on</strong> 1,299,039 1,353,507 4.2%Widowed Parent Grant 5,543 5,504 -0.7%Deserted Wife’s Benefit 104,618 100,261 -4.2%Maternity Benefit 315,878 331,319 4.9%Health and Safety Benefit 576 619 7.5%Adoptive Benefit 1,644 1,247 -24.1%Guardian’s Payment (C<strong>on</strong>tributory) 14,373 11,509 -19.9%Illness Benefit 852,305 919,640 7.9%Invalidity Pensi<strong>on</strong> 685,717 681,641 -0.6%Injury Benefit 19,250 20,974 9.0%Carer’s Benefit 33,666 30,204 -10.3%Medical Care 282 309 9.6%Disablement Benefit 84,443 85,652 1.4%Death Benefit Pensi<strong>on</strong> 8,036 5,374 -33.1%Jobseeker’s Benefit 928,844 1,733,774 86.7%Treatment Benefit 97,124 100,179 3.1%Bereavement Grant 17,851 18,471 3.5%Household Benefits and Free Travel (1) 254,580 273,053 7.3%Redundancy and Insolvency 202,264 350,133 73.1%Administrati<strong>on</strong> 257,780 281,423 9.2%TOTAL SOCIAL INSURANCE 8,393,757 9,777,295 16.5%State Pensi<strong>on</strong> (N<strong>on</strong>-C<strong>on</strong>tributory) 972,765 1,000,546 2.9%Pre-Retirement Allowance 117,666 96,606 -17.9%Widow/er’s (N<strong>on</strong>-C<strong>on</strong>tributory) Pensi<strong>on</strong> 21,181 21,275 0.4%Widowed Parent Grant 529 425 -19.7%Deserted Wife’s Allowance 6,624 6,038 -8.8%Pris<strong>on</strong>er’s Wife’s Allowance 7 6 -14.3%One-Parent Family Payment 1,067,158 1,121,344 5.1%Guardian’s Payment (N<strong>on</strong>-C<strong>on</strong>tributory) 7,147 6,024 -15.7%Child Benefit 2,453,957 2,495,304 1.7%Domiciliary Care Allowance 0 31,017 n/aDisability Allowance 1,052,660 1,142,769 8.6%Blind Pensi<strong>on</strong> 16,319 16,277 -0.3%Carer’s Allowance 450,260 502,469 11.6%Respite Care Grant 98,204 99,200 1.0%Jobseeker’s Allowance 1,158,851 2,004,556 73.0%Farm Assist 84,881 93,297 9.9%Employment Support <strong>Services</strong> 160,531 193,888 20.8%Family Income Supplement 170,309 167,133 -1.9%Supplementary <strong>Welfare</strong> Allowance 803,835 969,724 20.6%Rent Allowance 732 725 -1.0%Household Benefits and Free Travel (1) 324,108 353,166 9.0%Miscellaneous (1) 125,071 118,813 -5.0%Administrati<strong>on</strong> 322,035 311,212 -3.4%TOTAL SOCIAL ASSISTANCE 9,414,830 10,751,814 14.2%GRAND TOTAL 17,808,587 20,529,109 15.3%(1) See Additi<strong>on</strong>al Expenditure Details in Table A4.(2) Provisi<strong>on</strong>al<str<strong>on</strong>g>Statistical</str<strong>on</strong>g> <str<strong>on</strong>g>Informati<strong>on</strong></str<strong>on</strong>g> <strong>on</strong> <strong>Social</strong> <strong>Welfare</strong> <strong>Services</strong> <strong>2009</strong>
summary and older financial peopleGraph A2 Expenditure <strong>on</strong> Main <strong>Social</strong> Insurance Schemes, 2000 to <strong>2009</strong>3,5003,0002,5002,000€m1,5001,00050002000 2001 2002 2003 2004 2005 2006 2007 2008 <strong>2009</strong>State pensi<strong>on</strong> (C<strong>on</strong>tributory & Transiti<strong>on</strong>)Widow/er's (C<strong>on</strong>tributory) Pensi<strong>on</strong>Invalidity Pensi<strong>on</strong>Jobseeker's BenefitIllness BenefitTable A6: Financing of <strong>Social</strong> <strong>Welfare</strong> Expenditure, 2008 and <strong>2009</strong>2008 <strong>2009</strong> (1)€000 €000Sources of FinanceState 9,414,830 52.9% 10,751,814 52.4%<strong>Social</strong> Insurance Fund 8,393,757 47.1% 9,777,295 47.6%TOTAL 17,808,587 100.0% 20,529,109 100.0%(1) Provisi<strong>on</strong>al7Table A7: Financing of the <strong>Social</strong> Insurance Fund, 2008 and <strong>2009</strong>Sources of Finance2008 <strong>2009</strong> (1)€000 €000Employer PRSI 5,944,892 73.0% 5,289,372 72.5%Employee PRSI 1,633,708 20.1% 1,559,117 21.4%Self-Employed PRSI 405,582 5.0% 315,495 4.3%Investment Income 160,209 2.0% 132,977 1.8%Other Receipts 19 0.0% 19 0.0%Total Income 8,144,410 100.0% 7,296,980 100.0%Expenditure <strong>on</strong> <strong>Social</strong>Insurance Schemes 8,393,757 9,777,295Surplus -249,347 -2,480,315(1) Provisi<strong>on</strong>alNote: The breakdown between employer and employee c<strong>on</strong>tributi<strong>on</strong>s requires a detailed analysis of data collected by the Revenue Commissi<strong>on</strong>ers.The c<strong>on</strong>tributi<strong>on</strong>s are apporti<strong>on</strong>ed <strong>on</strong> the basis of the most recently available informati<strong>on</strong> and are of necessity provisi<strong>on</strong>al.<str<strong>on</strong>g>Statistical</str<strong>on</strong>g> <str<strong>on</strong>g>Informati<strong>on</strong></str<strong>on</strong>g> <strong>on</strong> <strong>Social</strong> <strong>Welfare</strong> <strong>Services</strong> <strong>2009</strong>
older summary people and financialGraph A3: Expenditure <strong>on</strong> Main <strong>Social</strong> Assistance Schemes, 2000 to <strong>2009</strong>2,5002,0001,500€m1,00050002000 2001 2002 2003 2004 2005 2006 2007 2008 <strong>2009</strong>State Pensi<strong>on</strong> (N<strong>on</strong>-C<strong>on</strong>tributory)One Parent Family PaymentJobseeker's AllowanceDisability AllowanceSupplementary <strong>Welfare</strong> AllowanceGraph A4: Financing of the <strong>Social</strong> Insurance Fund, <strong>2009</strong>8Employee PRSI 21.4%Self-Employed PRSI 4.3%Investment Income andOther Receipts 1.8%Employer PRSI 72.5%Graph A5: Number of Recip<strong>ie</strong>nts of Weekly <strong>Social</strong> <strong>Welfare</strong> Payments by ProgrammeArea, <strong>2009</strong>State Pensi<strong>on</strong>'s 27.5%Illness, Disability and Caring 21.5%Widows, Widowers andOne-Parent Famil<strong>ie</strong>s 15.6%Child Related Payments 1.8%Jobseeker's Supports 26.3%Employment Supports 4.2%Supplementary <strong>Welfare</strong>Allowance 3.1%<str<strong>on</strong>g>Statistical</str<strong>on</strong>g> <str<strong>on</strong>g>Informati<strong>on</strong></str<strong>on</strong>g> <strong>on</strong> <strong>Social</strong> <strong>Welfare</strong> <strong>Services</strong> <strong>2009</strong>
summary and older financial peopleTable A8: Number of Recip<strong>ie</strong>nts and Beneficiar<strong>ie</strong>s of Weekly <strong>Social</strong> <strong>Welfare</strong> Payments,2000 to <strong>2009</strong>Year Recip<strong>ie</strong>nts Beneficiar<strong>ie</strong>s2000 869,994 1,432,7742001 903,375 1,460,5742002 938,971 1,496,7142003 959,432 1,511,7402004 957,732 1,463,9212005 976,613 1,469,1062006 1,003,517 1,506,8242007 1,060,327 1,577,4632008 1,208,883 1,799,875<strong>2009</strong> 1,379,206 2,076,2569<str<strong>on</strong>g>Statistical</str<strong>on</strong>g> <str<strong>on</strong>g>Informati<strong>on</strong></str<strong>on</strong>g> <strong>on</strong> <strong>Social</strong> <strong>Welfare</strong> <strong>Services</strong> <strong>2009</strong>
older summary people and financialTable A9: Number of Recip<strong>ie</strong>nts of Weekly <strong>Social</strong> <strong>Welfare</strong> Payments by Payment Typeand Programme, 2008 and <strong>2009</strong>10Type of Payment Recip<strong>ie</strong>nts Change <strong>2009</strong>0ver 20082008 <strong>2009</strong>State Pensi<strong>on</strong> (C<strong>on</strong>tributory) 250,117 265,102 6.0%State Pensi<strong>on</strong> (Transiti<strong>on</strong>) 7,242 8,378 15.7%State Pensi<strong>on</strong> (N<strong>on</strong>-C<strong>on</strong>tributory) 97,784 97,798 0.0%Pre-Retirement Allowance 8,872 7,468 -15.8%Total Older People 364,015 378,746 4.0%Widow/er’s (C<strong>on</strong>tributory) Pensi<strong>on</strong> 112,237 113,108 0.8%Widow/er’s (N<strong>on</strong>-C<strong>on</strong>tributory) Pensi<strong>on</strong> 2,042 1,998 -2.2%Deserted Wife’s Benefit 9,056 8,737 -3.5%Deserted Wife’s Allowance 617 550 -10.9%One-Parent Family Payment 87,840 90,484 3.0%Total Widows, Widowers and One-Parent Famil<strong>ie</strong>s 211,792 214,877 1.5%Maternity Benefit 23,421 23,294 -0.5%Health and Safety Benefit 69 49 -29.0%Adoptive Benefit 68 64 -5.9%Guardian’s Payment (C<strong>on</strong>tributory) 833 860 3.2%Guardian’s Payment (N<strong>on</strong>-C<strong>on</strong>tributory) 437 420 -3.9%Total Child Related Payments 24,828 24,687 -0.6%Illness Benefit 73,609 77,665 5.5%Invalidity Pensi<strong>on</strong> 53,725 52,922 -1.5%Injury Benefit 846 726 -14.2%Interim Illness Benefit 525 318 -39.4%Disablement Pensi<strong>on</strong> 13,192 13,520 2.5%Death Benefit Pensi<strong>on</strong> 651 637 -2.2%Disability Allowance 95,754 99,576 4.0%Carer’s Benefit 2,249 1,917 -14.8%Carer’s Allowance 43,569 48,223 10.7%Blind Pensi<strong>on</strong> 1,472 1,467 -0.3%Total Illness, Disability and Caring 285,592 296,971 4.0%Jobseeker’s Benefit 121,763 160,122 31.5%Jobseeker’s Allowance 113,603 203,248 78.9%Total Jobseeker’s Supports 235,366 363,370 54.4%Back to Work Allowance Employee 3,558 2,012 -43.5%Back to Work Enterprise AllowanceSelf - Employed First Year 1,470 1,966 33.7%Back to Work Enterprise AllowanceSelf - Employed Years 2 - 4 3,134 2,625 -16.2%Back to Educati<strong>on</strong> Allowance 7,886 15,877 101.3%Part-Time Job Incentive Scheme 184 173 -6.0%Family Income Supplement 27,798 25,963 -6.6%Farm Assist 7,496 8,972 19.7%Total Employment Supports 51,526 57,588 11.8%Supplementary <strong>Welfare</strong> Allowance (1) 35,546 42,775 20.3%Total Supplementary <strong>Welfare</strong> Allowance 35,546 42,775 20.3%Rent Allowance 217 192 -11.5%Total Miscellaneous Payments 217 192 -11.5%Grand Total 1,208,882 1,379,206 14.1%(1) Includes basic weekly payments <strong>on</strong>ly. See Secti<strong>on</strong> H for details of other Supplementary <strong>Welfare</strong> Allowance payments.<str<strong>on</strong>g>Statistical</str<strong>on</strong>g> <str<strong>on</strong>g>Informati<strong>on</strong></str<strong>on</strong>g> <strong>on</strong> <strong>Social</strong> <strong>Welfare</strong> <strong>Services</strong> <strong>2009</strong>
summary and older financial peopleTable A10: Number of Recip<strong>ie</strong>nts of Weekly <strong>Social</strong> <strong>Welfare</strong> Payments by LifecycleStage, 2008 and <strong>2009</strong>Type of Payment Recip<strong>ie</strong>nts Change <strong>2009</strong> over 20082008 <strong>2009</strong>Family Income Supplement 27,798 25,963 -6.6%Guardian’s Payment (C<strong>on</strong>tributory) 833 860 3.2%Guardian’s Payment (N<strong>on</strong>-C<strong>on</strong>tributory) 437 420 -3.9%Total Children & Famil<strong>ie</strong>s 29,068 27,243 -6.3%Adoptive Benefit 68 64 -5.9%Back to Work Allowance Employee 3,558 2,012 -43.5%Back to Work Enterprise AllowanceSelf - Employed First Year 1,470 1,966 33.7%Back to Work Enterprise AllowanceSelf - Employed Years 2 - 4 3,134 2,625 -16.2%Back to Educati<strong>on</strong> Allowance 7,886 15,877 101.3%Carer’s Benefit 2,249 1,917 -14.8%Carer’s Allowance 43,569 48,223 10.7%Deserted Wife’s Benefit 9,056 8,737 -3.5%Deserted Wife’s Allowance 617 550 -10.9%Farm Assist 7,496 8,972 19.7%Health and Safety Benefit 69 49 -29.0%Illness Benefit 73,609 77,665 5.5%Jobseeker’s Benefit 121,763 160,122 31.5%Jobseeker’s Allowance 113,603 203,248 78.9%Maternity Benefit 23,421 23,294 -0.5%One-Parent Family Payment 87,840 90,484 3.0%Part-Time Job Incentive Scheme 184 173 -6.0%Pre-Retirement Allowance 8,872 7,468 -15.8%Pris<strong>on</strong>er’s Wife’s Allowance 1 0 -100.0%Widow/er’s (N<strong>on</strong>-C<strong>on</strong>tributory) Pensi<strong>on</strong> 2,042 1,998 -2.2%Total People of Working Age 510,507 655,444 28.4%Rent Allowance 217 192 -11.5%State Pensi<strong>on</strong> (C<strong>on</strong>tributory) 250,117 265,102 6.0%State Pensi<strong>on</strong> (N<strong>on</strong>-C<strong>on</strong>tributory) 97,784 97,798 0.0%State Pensi<strong>on</strong> (Transiti<strong>on</strong>) 7,242 8,378 15.7%Widow/er’s (C<strong>on</strong>tributory) Pensi<strong>on</strong> 112,237 113,108 0.8%Total Retired & Older People 467,597 484,578 3.6%Death Benefit Pensi<strong>on</strong> 651 637 -2.2%Disability Allowance 95,754 99,576 4.0%Disablement Pensi<strong>on</strong> 13,192 13,520 2.5%Invalidity Pensi<strong>on</strong> 53,725 52,922 -1.5%Injury Benefit 846 726 -14.2%Interim Illness Benefit 525 318 -39.4%Blind Pensi<strong>on</strong> 1,472 1,467 -0.3%Total People with Disabilit<strong>ie</strong>s 166,165 169,166 1.8%Supplementary <strong>Welfare</strong> Allowance (1) 35,546 42,775 20.3%Total Poverty & <strong>Social</strong> Inclusi<strong>on</strong> 35,546 42,775 20.3%Grand Total 1,208,883 1,379,206 14.1%(1) Includes basic weekly payments <strong>on</strong>ly. See Secti<strong>on</strong> H for details of other Supplementary <strong>Welfare</strong> Allowance payments.11<str<strong>on</strong>g>Statistical</str<strong>on</strong>g> <str<strong>on</strong>g>Informati<strong>on</strong></str<strong>on</strong>g> <strong>on</strong> <strong>Social</strong> <strong>Welfare</strong> <strong>Services</strong> <strong>2009</strong>
older summary people and financialGraph A6: Recip<strong>ie</strong>nts of Main <strong>Social</strong> Insurance Payments, 2000 to <strong>2009</strong>300,000250,000200,000Recip<strong>ie</strong>nts150,000100,00050,00002000 2001 2002 2003 2004 2005 2006 2007 2008 <strong>2009</strong>12State Pensi<strong>on</strong> (C<strong>on</strong>tributory & transiti<strong>on</strong>)Widow/er's (C<strong>on</strong>tributory) Pensi<strong>on</strong>Invalidity Pensi<strong>on</strong>Jobseeker's BenefitIllness BenefitGraph A7: Recip<strong>ie</strong>nts of Main <strong>Social</strong> Assistance Payments, 2000 to <strong>2009</strong>250,000200,000Recip<strong>ie</strong>nts150,000100,00050,00002000 2001 2002 2003 2004 2005 2006 2007 2008 <strong>2009</strong>State Pensi<strong>on</strong> (N<strong>on</strong>-C<strong>on</strong>tributory)One Parent Family PaymentJobseeker's AllowanceDisability AllowanceSupplementary <strong>Welfare</strong> Allowance<str<strong>on</strong>g>Statistical</str<strong>on</strong>g> <str<strong>on</strong>g>Informati<strong>on</strong></str<strong>on</strong>g> <strong>on</strong> <strong>Social</strong> <strong>Welfare</strong> <strong>Services</strong> <strong>2009</strong>
summary and older financial peopleTable A11: Number of Recip<strong>ie</strong>nts of Weekly <strong>Social</strong> <strong>Welfare</strong> Payments by PaymentType and Insurance or Assistance, 2008 and <strong>2009</strong>Type of Payment Recip<strong>ie</strong>nts Change <strong>2009</strong> over 20082008 <strong>2009</strong>State Pensi<strong>on</strong> (C<strong>on</strong>tributory) 250,117 265,102 6.0%State Pensi<strong>on</strong> (Transiti<strong>on</strong>) 7,242 8,378 15.7%Widow/er’s (C<strong>on</strong>tributory) Pensi<strong>on</strong> 112,237 113,108 0.8%Deserted Wife’s Benefit 9,056 8,737 -3.5%Maternity Benefit 23,421 23,294 -0.5%Health and Safety Benefit 69 49 -29.0%Adoptive Benefit 68 64 -5.9%Guardian’s Payment (C<strong>on</strong>tributory) 833 860 3.2%Illness Benefit 73,609 77,665 5.5%Invalidity Pensi<strong>on</strong> 53,725 52,922 -1.5%Injury Benefit 846 726 -14.2%Interim Illness Benefit 525 318 -39.4%Disablement Benefit 13,192 13,520 2.5%Death Benefit Pensi<strong>on</strong> 651 637 -2.2%Carer’s Benefit 2,249 1,917 -14.8%Jobseeker’s Benefit 121,763 160,122 31.5%Total <strong>Social</strong> Insurance 669,603 727,419 8.6%State Pensi<strong>on</strong> (N<strong>on</strong>-C<strong>on</strong>tributory) 97,784 97,798 0.0%Pre-Retirement Allowance 8,872 7,468 -15.8%Widow/er’s (N<strong>on</strong>-C<strong>on</strong>tributory) Pensi<strong>on</strong> 2,042 1,998 -2.2%Deserted Wife’s Allowance 617 550 -10.9%Pris<strong>on</strong>er’s Wife’s Allowance 1 0 -100.0%One-Parent Family Payment 87,840 90,484 3.0%Guardian’s Payment (N<strong>on</strong>-C<strong>on</strong>tributory) 437 420 -3.9%Disability Allowance 95,754 99,576 4.0%Blind Pensi<strong>on</strong> 1,472 1,467 -0.3%Carer’s Allowance 43,569 48,223 10.7%Jobseeker’s Allowance 113,603 203,248 78.9%Back to Work Allowance Employee 3,558 2,012 -43.5%Back to Work Enterprise AllowanceSelf - Employed First Year 1,470 1,966 33.7%Back to Work Enterprise AllowanceSelf - Employed Years 2 - 4 3,134 2,625 -16.2%Back to Educati<strong>on</strong> Allowance 7,886 15,877 101.3%Part-Time Job Incentive Scheme 184 173 -6.0%Family Income Supplement 27,798 25,963 -6.6%Farm Assist 7,496 8,972 19.7%Supplementary <strong>Welfare</strong> Allowance (1) 35,546 42,775 20.3%Rent Allowance 217 192 -11.5%Total <strong>Social</strong> Assistance 539,280 651,787 20.9%Grand Total 1,208,883 1,379,206 14.1%(1) Includes basic weekly payments <strong>on</strong>ly. See Secti<strong>on</strong> H for details of other Supplementary <strong>Welfare</strong> Allowance payments.13<str<strong>on</strong>g>Statistical</str<strong>on</strong>g> <str<strong>on</strong>g>Informati<strong>on</strong></str<strong>on</strong>g> <strong>on</strong> <strong>Social</strong> <strong>Welfare</strong> <strong>Services</strong> <strong>2009</strong>
older summary people and financialTable A12: Number of Beneficiar<strong>ie</strong>s of Weekly <strong>Social</strong> <strong>Welfare</strong> Payments by PaymentType and Programme, 2008 and <strong>2009</strong>14Type of Payment Beneficiar<strong>ie</strong>s Change <strong>2009</strong>2008 <strong>2009</strong>over 2008State Pensi<strong>on</strong> (C<strong>on</strong>tributory) 314,295 331,273 5.4%State Pensi<strong>on</strong> (Transiti<strong>on</strong>) 9,511 10,704 12.5%State Pensi<strong>on</strong> (N<strong>on</strong>-C<strong>on</strong>tributory) 101,577 101,349 -0.2%Pre-Retirement Allowance 12,177 10,094 -17.1%Total Older People 437,560 453,420 3.6%Widow/er’s (C<strong>on</strong>tributory) Pensi<strong>on</strong> 124,646 125,106 0.4%Widow/er’s (N<strong>on</strong>-C<strong>on</strong>tributory) Pensi<strong>on</strong> 2,042 1,998 -2.2%Deserted Wife’s Benefit 11,404 10,523 -7.7%Deserted Wife’s Allowance 617 550 -10.9%Pris<strong>on</strong>er’s Wife’s Allowance 1 0 -100.0%One-Parent Family Payment 233,620 240,511 2.9%Total Widows, Widowers and One-Parent372,330 378,688 1.7%Famil<strong>ie</strong>sMaternity Benefit 23,421 23,294 -0.5%Health and Safety Benefit 71 58 -18.3%Adoptive Benefit 68 64 -5.9%Guardian’s Payment (C<strong>on</strong>tributory) 833 860 3.2%Guardian’s Payment (N<strong>on</strong>-C<strong>on</strong>tributory) 437 420 -3.9%Total Child Related Payments 24,830 24,696 -0.5%Illness Benefit 110,764 114,418 3.3%Invalidity Pensi<strong>on</strong> 78,853 77,042 -2.3%Injury Benefit 1,238 1,051 -15.1%Interim Illness Benefit 731 460 -37.1%Disablement Pensi<strong>on</strong> 13,824 14,669 6.1%Death Benefit Pensi<strong>on</strong> 799 761 -4.8%Disability Allowance 127,422 132,913 4.3%Carer’s Benefit 4,801 4,155 -13.5%Carer’s Allowance 71,935 82,892 15.2%Blind Pensi<strong>on</strong> 1,930 1,945 0.8%Total Illness, Disability and Caring 412,297 430,306 4.4%Jobseeker’s Benefit 169,001 229,059 35.5%Jobseeker’s Allowance 187,802 342,752 82.5%Total Jobseeker’s Supports 356,803 571,811 60.3%Back to Work Allowance Employee 7,185 3,921 -45.4%Back to Work Enterprise AllowanceSelf - Employed First Year 3,506 4,303 22.7%Back to Work Enterprise AllowanceSelf - Employed Years 2 - 4 7,232 6,106 -15.6%Back to Educati<strong>on</strong> Allowance 11,876 22,735 91.4%Part-Time Job Incentive Scheme 184 173 -6.0%Family Income Supplement 85,817 81,679 -4.8%Farm Assist 16,787 20,660 23.1%Total Employment Supports 132,587 139,577 5.3%Supplementary <strong>Welfare</strong> Allowance (1) 63,251 77,566 22.6%Total Supplementary <strong>Welfare</strong> Allowance 63,251 77,566 22.6%Rent Allowance 217 192 -11.5%Total Miscellaneous Payments 217 192 -11.5%Grand Total 1,799,875 2,076,256 15.4%(1) Includes basic weekly payments <strong>on</strong>ly. See Secti<strong>on</strong> H for details of other Supplementary <strong>Welfare</strong> Allowance payments.<str<strong>on</strong>g>Statistical</str<strong>on</strong>g> <str<strong>on</strong>g>Informati<strong>on</strong></str<strong>on</strong>g> <strong>on</strong> <strong>Social</strong> <strong>Welfare</strong> <strong>Services</strong> <strong>2009</strong>
summary and older financial peopleTable A13: Number of Beneficiar<strong>ie</strong>s of Weekly <strong>Social</strong> <strong>Welfare</strong> Payments by LifecycleStage, 2008 and <strong>2009</strong>Type of Payment Beneficiar<strong>ie</strong>s Change <strong>2009</strong>over 20082008 <strong>2009</strong>Family Income Supplement 85,817 81,679 -4.8%Guardian’s Payment (C<strong>on</strong>tributory) 833 860 3.2%Guardian’s Payment (N<strong>on</strong>-C<strong>on</strong>tributory) 437 420 -3.9%Total Children & Famil<strong>ie</strong>s 87,087 82,959 -4.7%Adoptive Benefit 68 64 -5.9%Back to Work Allowance Employee 7,185 3,921 -45.4%Back to Work Enterprise AllowanceSelf - Employed First Year 3,508 4,303 22.7%Back to Work Enterprise AllowanceSelf - Employed Years 2 - 4 7,232 6,106 -15.6%Back to Educati<strong>on</strong> Allowance 11,876 22,735 91.4%Carer’s Benefit 4,801 4,155 -13.5%Carer’s Allowance 71,935 82,892 15.2%Deserted Wife’s Benefit 11,404 10,523 -7.7%Deserted Wife’s Allowance 617 550 -10.9%Farm Assist 16,787 20,660 23.1%Health and Safety Benefit 71 58 -18.3%Illness Benefit 110,764 114,418 3.3%Jobseeker’s Benefit 169,001 229,059 35.5%Jobseeker’s Allowance 187,802 342,752 82.5%Maternity Benefit 23,421 23,294 -0.5%One-Parent Family Payment 233,620 240,511 2.9%Part-Time Job Incentive Scheme 184 173 -6.0%Pre-Retirement Allowance 12,177 10,094 -17.1%Pris<strong>on</strong>er’s Wife’s Allowance 1 0 -100.0%Widow/er’s (N<strong>on</strong>-C<strong>on</strong>tributory) Pensi<strong>on</strong> 2,042 1,998 -2.2%Total People of Working Age 874,494 1,118,266 27.9%Rent Allowance 217 192 -11.5%State Pensi<strong>on</strong> (C<strong>on</strong>tributory) 314,295 331,273 5.4%State Pensi<strong>on</strong> (Transiti<strong>on</strong>) 9,511 10,704 12.5%State Pensi<strong>on</strong> (N<strong>on</strong>-C<strong>on</strong>tributory) 101,577 101,349 -0.2%Widow/er’s (C<strong>on</strong>tributory) Pensi<strong>on</strong> 124,646 125,106 0.4%Total Retired & Older People 550,246 568,624 3.3%Invalidity Pensi<strong>on</strong> 78,853 77,042 -2.3%Injury Benefit 1,238 1,051 -15.1%Interim Illness Benefit 731 460 -37.1%Disablement Pensi<strong>on</strong> 13,824 14,669 6.1%Death Benefit Pensi<strong>on</strong> 799 761 -4.8%Disability Allowance 127,422 132,913 4.3%Blind Pensi<strong>on</strong> 1,930 1,945 0.8%Total People with Disabilit<strong>ie</strong>s 224,797 228,841 1.8%Supplementary <strong>Welfare</strong> Allowance (1) 63,251 77,566 22.6%Total Poverty & <strong>Social</strong> Inclusi<strong>on</strong> 63,251 77,566 22.6%Grand Total 1,799,875 2,076,256 15.4%(1) Includes basic weekly payments <strong>on</strong>ly. See Secti<strong>on</strong> H for details of other Supplementary <strong>Welfare</strong> Allowance payments.15<str<strong>on</strong>g>Statistical</str<strong>on</strong>g> <str<strong>on</strong>g>Informati<strong>on</strong></str<strong>on</strong>g> <strong>on</strong> <strong>Social</strong> <strong>Welfare</strong> <strong>Services</strong> <strong>2009</strong>
older summary people and financialTable A14: Number of Beneficiar<strong>ie</strong>s of Weekly <strong>Social</strong> <strong>Welfare</strong> Payments by PaymentType and Insurance or Assistance, 2008 and <strong>2009</strong>16Type of Payment Beneficiar<strong>ie</strong>s Change <strong>2009</strong>over 20082008 <strong>2009</strong>State Pensi<strong>on</strong> (C<strong>on</strong>tributory) 314,295 331,273 5.4%State Pensi<strong>on</strong> (Transiti<strong>on</strong>) 9,511 10,704 12.5%Widow/er’s (C<strong>on</strong>tributory) Pensi<strong>on</strong> 124,646 125,106 0.4%Deserted Wife’s Benefit 11,404 10,523 -7.7%Maternity Benefit 23,421 23,294 -0.5%Health and Safety Benefit 71 58 -18.3%Adoptive Benefit 68 64 -5.9%Guardian’s Payment (C<strong>on</strong>tributory) 833 860 3.2%Illness Benefit 110,764 114,418 3.3%Invalidity Pensi<strong>on</strong> 78,853 77,042 -2.3%Injury Benefit 1,238 1,051 -15.1%Interim Illness Benefit 731 460 -37.1%Disablement Pensi<strong>on</strong> 13,824 14,669 6.1%Death Benefit Pensi<strong>on</strong> 799 761 -4.8%Carer’s Benefit 4,801 4,155 -13.5%Jobseeker’s Benefit 169,001 229,059 35.5%Total <strong>Social</strong> Insurance 864,260 943,497 9.2%State Pensi<strong>on</strong> (N<strong>on</strong>-C<strong>on</strong>tributory) 101,577 101,349 -0.2%Pre-Retirement Allowance 12,177 10,094 -17.1%Widow/er’s (N<strong>on</strong>-C<strong>on</strong>tributory) Pensi<strong>on</strong> 2,042 1,998 -2.2%Deserted Wife’s Allowance 617 550 -10.9%Pris<strong>on</strong>er’s Wife’s Allowance 1 0 -100.0%One-Parent Family Payment 233,620 240,511 2.9%Guardian’s Payment (N<strong>on</strong>-C<strong>on</strong>tributory) 437 420 -3.9%Disability Allowance 127,422 132,913 4.3%Blind Pensi<strong>on</strong> 1,930 1,945 0.8%Carer’s Allowance 71,935 82,892 15.2%Jobseeker’s Allowance 187,802 342,752 82.5%Family Income Supplement 85,817 81,679 -4.8%Back to Work Allowance Employee 7,185 3,921 -45.4%Back to Work Enterprise AllowanceSelf - Employed First Year 3,506 4,303 22.7%Back to Work Enterprise AllowanceSelf - Employed Years 2 - 4 7,232 6,106 -15.6%Back to Educati<strong>on</strong> Allowance 11,876 22,735 91.4%Part-Time Job Incentive Scheme 184 173 -6.0%Farm Assist 16,787 20,660 23.1%Supplementary <strong>Welfare</strong> Allowance (1) 63,251 77,566 22.6%Rent Allowance 217 192 -11.5%Total <strong>Social</strong> Assistance 935,615 1,132,759 21.1%Grand Total 1,799,875 2,076,256 15.4%(1) Includes basic weekly payments <strong>on</strong>ly. See Secti<strong>on</strong> H for details of other Supplementary <strong>Welfare</strong> Allowance payments.<str<strong>on</strong>g>Statistical</str<strong>on</strong>g> <str<strong>on</strong>g>Informati<strong>on</strong></str<strong>on</strong>g> <strong>on</strong> <strong>Social</strong> <strong>Welfare</strong> <strong>Services</strong> <strong>2009</strong>
summary and older financial peopleTable A15: Number of Recip<strong>ie</strong>nts of Weekly <strong>Social</strong> <strong>Welfare</strong> Payments by Sex, PaymentType and Insurance or Assistance, <strong>2009</strong>Type of Payment <strong>2009</strong> TotalMaleFemaleState Pensi<strong>on</strong> (C<strong>on</strong>tributory) 176,013 66.4% 89,089 33.6% 265,102State Pensi<strong>on</strong> (Transiti<strong>on</strong>) 5,718 68.3% 2,660 31.7% 8,378Widow/er’s (C<strong>on</strong>tributory) Pensi<strong>on</strong> 14,961 13.2% 98,147 86.8% 113,108Deserted Wife’s Benefit 0 0.0% 8,737 100.0% 8,737Maternity Benefit 0 0.0% 23,294 100.0% 23,294Health and Safety Benefit 0 0.0% 49 100.0% 49Adoptive Benefit 0 0.0% 64 100.0% 64Guardian’s Payment (C<strong>on</strong>tributory) 430 50.0% 430 50.0% 860Illness Benefit 30,514 39.3% 47,151 60.7% 77,665Invalidity Pensi<strong>on</strong> 25,423 48.0% 27,499 52.0% 52,922Injury Benefit 487 67.1% 239 32.9% 726Interim Illness Benefit 186 58.5% 132 41.5% 318Disablement Pensi<strong>on</strong> 10,700 79.1% 2,820 20.9% 13,520Death Benefit Pensi<strong>on</strong> 6 0.9% 631 99.1% 637Carer’s Benefit 329 17.2% 1,588 82.8% 1,917Jobseeker’s Benefit 99,567 62.2% 60,555 37.8% 160,122Total <strong>Social</strong> Insurance 364,334 50.1% 363,085 49.9% 727,419State Pensi<strong>on</strong> (N<strong>on</strong>-C<strong>on</strong>tributory) 35,877 36.7% 61,921 63.3% 97,798Pre-Retirement Allowance 5,736 76.8% 1,732 23.2% 7,468Widow/er’s (N<strong>on</strong>-C<strong>on</strong>tributory) Pensi<strong>on</strong> 241 12.1% 1,757 87.9% 1,998Deserted Wife’s Allowance 0 0.0% 550 100.0% 550One-Parent Family Payment 1,964 2.2% 88,520 97.8% 90,484Guardian’s Payment (N<strong>on</strong>-C<strong>on</strong>tributory) 210 50.0% 210 50.0% 420Disability Allowance 59,304 59.6% 40,272 40.4% 99,576Blind Pensi<strong>on</strong> 771 52.6% 696 47.4% 1,467Carer’s Allowance 9,884 20.5% 38,339 79.5% 48,223Jobseeker’s Allowance 152,714 75.1% 50,534 24.9% 203,248Family Income Supplement 9,991 38.5% 15,972 61.5% 25,963Back to Work Allowance 935 46.5% 1,077 53.5% 2,012Back to Work Enterprise Allowance 3,402 74.1% 1,189 25.9% 4,591Back to Educati<strong>on</strong> Allowance 9,467 59.6% 6,410 40.4% 15,877Part-Time Job Incentive Scheme 78 45.1% 95 54.9% 173Farm Assist 8,286 92.4% 686 7.6% 8,972Supplementary <strong>Welfare</strong> Allowance (1) 27,831 65.1% 14,944 34.9% 42,775Rent Allowance 139 72.4% 53 27.6% 192Total <strong>Social</strong> Assistance 326,830 50.1% 324,957 49.9% 651,787Grand Total 691,164 50.1% 688,042 49.9% 1,379,206(1) Gender breakdown is estimated17<str<strong>on</strong>g>Statistical</str<strong>on</strong>g> <str<strong>on</strong>g>Informati<strong>on</strong></str<strong>on</strong>g> <strong>on</strong> <strong>Social</strong> <strong>Welfare</strong> <strong>Services</strong> <strong>2009</strong>
older summary people and financialTable A16: Number of Recip<strong>ie</strong>nts, Qualif<strong>ie</strong>d Adults and Qualif<strong>ie</strong>d Children of Weekly<strong>Social</strong> <strong>Welfare</strong> Payments, <strong>2009</strong>18Type of Payment Recip<strong>ie</strong>nts Qualif<strong>ie</strong>dAdultsQualif<strong>ie</strong>d ChildrenOtherChildrenFull Rate Half Rate (1)State Pensi<strong>on</strong> (C<strong>on</strong>tributory) 265,102 63,446 1,438 1,287 0 331,273State Pensi<strong>on</strong> (Transiti<strong>on</strong>) 8,378 2,096 113 117 0 10,704State Pensi<strong>on</strong> (N<strong>on</strong>-C<strong>on</strong>tributory) 97,798 2,955 474 122 0 101,349Pre-Retirement Allowance 7,468 2,021 488 117 0 10,094Total Older People 378,746 70,518 2,513 1,643 0 453,420Widow/er’s (C<strong>on</strong>tributory) Pensi<strong>on</strong> 113,108 0 11,998 0 0 125,106Widow/er’s (N<strong>on</strong>-C<strong>on</strong>tributory) Pensi<strong>on</strong> 1,998 0 0 0 0 1,998Deserted Wife’s Benefit 8,737 0 1,786 0 0 10,523Deserted Wife’s Allowance 550 0 0 0 0 550One-Parent Family Payment 90,484 0 150,024 3 0 240,511Total Widows, Widowers and One-Parent 214,877 0 163,808 3 0 378,688Famil<strong>ie</strong>sMaternity Benefit 23,294 0 0 0 0 23,294Health and Safety Benefit 49 2 3 4 0 58Adoptive Benefit 64 0 0 0 0 64Guardian’s Payment (C<strong>on</strong>tributory) 860 0 0 0 0 860Guardian’s Payment (N<strong>on</strong>-C<strong>on</strong>tributory) 420 0 0 0 0 420Total Child Related Payments 24,687 2 3 4 0 24,696Illness Benefit 77,665 8,271 10,293 18,189 0 114,418Invalidity Pensi<strong>on</strong> 52,922 8,493 4,678 10,949 0 77,042Injury Benefit 726 97 154 74 0 1,051Interim Illness Benefit 318 32 72 38 0 460Disablement Pensi<strong>on</strong> 13,520 159 289 701 0 14,669Death Benefit Pensi<strong>on</strong> 637 0 124 0 0 761Disability Allowance 99,576 8,577 17,386 7,374 0 132,913Carer’s Benefit 1,917 0 65 2,173 0 4,155Carer’s Allowance 48,223 0 2,985 31,684 0 82,892Blind Pensi<strong>on</strong> 1,467 113 232 133 0 1,945Total Illness, Disability and Caring 296,971 25,742 36,278 71,315 0 430,306Jobseeker’s Benefit 160,122 18,281 28,280 22,376 0 229,059Jobseeker’s Allowance 203,248 44,050 74,661 20,793 0 342,752Total Jobseeker’s Supports 363,370 62,331 102,941 43,169 0 571,811Back to Work Allowance Employee 2,012 307 1,255 347 0 3,921Back to Work Enterprise AllowanceSelf - Employed First Year 1,966 524 1,426 387 0 4,303Back to Work Enterprise AllowanceSelf - Employed Years 2 - 4 2,625 778 2,075 628 0 6,106Back to Educati<strong>on</strong> Allowance 15,877 1,405 3,341 2,112 0 22,735Part-Time Job Incentive scheme 173 0 0 0 0 173Family Income Supplement 25,963 0 0 0 55,716 81,679Farm Assist 8,972 4,073 6,074 1,541 0 20,660Total Employment Supports 57,588 7,087 14,171 5,015 55,716 139,577Supplementary <strong>Welfare</strong> Allowance (2) 42,775 9,357 25,434 0 0 77,566Total Supplementary <strong>Welfare</strong> Allowance 42,775 9,357 25,434 0 0 77,566Rent Allowance 192 0 0 0 0 192Total Miscellaneous Payments 192 0 0 0 0 192Grand Total (3) 1,379,206 175,037 345,148 121,149 55,716 2,076,256(1) Where each spouse is in receipt of a half rate increase in respect of a qualif<strong>ie</strong>d child, some double counting of the number of qualif<strong>ie</strong>d children may occur.(2) Includes basic weekly payments <strong>on</strong>ly.(3) The total figures include a small element of double counting as some people could be in receipt of more than <strong>on</strong>e payment, the sec<strong>on</strong>d of which might be, for example,Disablement Benefit, Rent Allowance, Family Income Supplement or half rate Carer’s Allowance.Total<str<strong>on</strong>g>Statistical</str<strong>on</strong>g> <str<strong>on</strong>g>Informati<strong>on</strong></str<strong>on</strong>g> <strong>on</strong> <strong>Social</strong> <strong>Welfare</strong> <strong>Services</strong> <strong>2009</strong>
summary and older financial peopleTable A17: Number of Recip<strong>ie</strong>nts, Qualif<strong>ie</strong>d Adults and Qualif<strong>ie</strong>d Children of Weekly<strong>Social</strong> <strong>Welfare</strong> Payments by Lifecycle Stage, <strong>2009</strong>Type of Payment Recip<strong>ie</strong>nts Qualif<strong>ie</strong>dAdultsQualif<strong>ie</strong>d ChildrenFull Rate Half Rate(1)OtherChildrenFamily Income Supplement 25,963 0 0 0 55,716 81,679Guardian’s Payment (C<strong>on</strong>tributory) 860 0 0 0 0 860Guardian’s Payment420 0 0 0 0 420(N<strong>on</strong>-C<strong>on</strong>tributory)Total Children & Famil<strong>ie</strong>s 27,243 0 0 0 55,716 82,959Adoptive Benefit 64 0 0 0 0 64Back to Work Allowance Employee 2,012 307 1,255 347 0 3,921Back to Work Enterprise AllowanceSelf - Employed First Year 1,966 524 1,426 387 0 4,303Back to Work Enterprise AllowanceSelf - Employed Years 2 - 4 2,625 778 2,075 628 0 6,106Back to Educati<strong>on</strong> Allowance 15,877 1,405 3,341 2,112 0 22,735Carer’s Benefit 1,917 0 65 2,173 0 4,155Carer’s Allowance 48,223 0 2,985 31,684 0 82,892Deserted Wife’s Benefit 8,737 0 1,786 0 0 10,523Deserted Wife’s Allowance 550 0 0 0 0 550Farm Assist 8,972 4,073 6,074 1,541 0 20,660Health and Safety Benefit 49 2 3 4 0 58Illness Benefit 77,665 8,271 10,293 18,189 0 114,418Jobseeker’s Benefit 160,122 18,281 28,280 22,376 0 229,059Jobseeker’s Allowance 203,248 44,050 74,661 20,793 0 342,752Maternity Benefit 23,294 0 0 0 0 23,294One-Parent Family Payment 90,484 0 150,024 3 0 240,511Part-Time Job Incentive scheme 173 0 0 0 0 173Pre-Retirement Allowance 7,468 2,021 488 117 0 10,094Widow/er’s (N<strong>on</strong>-C<strong>on</strong>tributory)1,998 0 0 0 0 1,998Pensi<strong>on</strong>Total People of Working Age 655,444 79,712 282,756 100,354 0 1,118,266Rent Allowance 192 0 0 0 0 192State Pensi<strong>on</strong> (C<strong>on</strong>tributory) 265,102 63,446 1,438 1,287 0 331,273State Pensi<strong>on</strong> (Transiti<strong>on</strong>) 8,378 2,096 113 117 0 10,704State Pensi<strong>on</strong> (N<strong>on</strong>-C<strong>on</strong>tributory) 97,798 2,955 474 122 0 101,349Widow/er’s (C<strong>on</strong>tributory) Pensi<strong>on</strong> 113,108 0 11,998 0 0 21,487Total Retired & Older People 484,578 68,497 14,023 1,526 0 465,005Invalidity Pensi<strong>on</strong> 52,922 8,493 4,678 10,949 0 77,042Injury Benefit 726 97 154 74 0 1,051Interim Illness Benefit 318 32 72 38 0 460Disablement Pensi<strong>on</strong> 13,520 159 289 701 0 14,669Death Benefit Pensi<strong>on</strong> 637 0 124 0 0 761Disability Allowance 99,576 8,577 17,386 7,374 0 132,913Blind Pensi<strong>on</strong> 1,467 113 232 133 0 1,945Total People with Disabilit<strong>ie</strong>s 169,166 17,471 22,935 19,269 0 228,841Supplementary <strong>Welfare</strong> Allowance (2) 42,775 9,357 25,434 0 0 77,566Total Poverty & <strong>Social</strong> Inclusi<strong>on</strong> 42,775 9,357 25,434 0 0 77,566Grand Total (3) 1,379,206 175,037 345,148 121,149 55,716 2,076,256(1) Where each spouse is in receipt of a half rate increase in respect of a qualif<strong>ie</strong>d child, some double counting of the number of qualif<strong>ie</strong>d children may occur.(2) Includes basic weekly payments <strong>on</strong>ly.(3) The total figures include a small element of double counting as some people could be in receipt of more than <strong>on</strong>e payment, the sec<strong>on</strong>d of which might be,for example, Disablement Benefit, Rent Allowance, Family Income Supplement or half rate Carer’s Allowance.Total19<str<strong>on</strong>g>Statistical</str<strong>on</strong>g> <str<strong>on</strong>g>Informati<strong>on</strong></str<strong>on</strong>g> <strong>on</strong> <strong>Social</strong> <strong>Welfare</strong> <strong>Services</strong> <strong>2009</strong>
older summary people and financialTable A18: Number of Pers<strong>on</strong>s in each <strong>Social</strong> Insurance Class, 2007 and 200820Insurance ClassInsured forNumber insured2007 (1) 2008 (2)Male Female Total Male Female TotalA All Benefits (3) 1,256,114 1,158,545 2,414,659 1,234,046 1,163,152 2,397,198B Widow/er’s (C<strong>on</strong>tributory) Pensi<strong>on</strong>s, 16,556 12,131 28,687 16,400 12,021 28,421Bereavement Grant, Guardian’sPayment (C<strong>on</strong>tributory), Carer’sBenefit and limited Injur<strong>ie</strong>s Benefits.C Widow/er’s (C<strong>on</strong>tributory) Pensi<strong>on</strong>s, 782 108 890 745 139 884Bereavement Grant, Carer’s Benefit andGuardian’s Payment (C<strong>on</strong>tributory).D Widow/er’s (C<strong>on</strong>tributory) Pensi<strong>on</strong>s, 35,038 45,563 80,601 34,855 44,357 79,212Guardian’s Payment (C<strong>on</strong>tributory),Bereavement Grant, Carer’s Benefit andOccupati<strong>on</strong>al Injur<strong>ie</strong>s Benefits.E All benefits except Jobseeker’s Benefit, 132 28 160 135 31 166Bereavement Grant and Occupati<strong>on</strong>alInjur<strong>ie</strong>s Benefits.H All benefits <strong>on</strong> discharge. Treatment 8,024 423 8,447 8,093 425 8,518Benefit, Bereavement Grant, Carer’sBenefit and Widow/er’s (C<strong>on</strong>tributory)Pensi<strong>on</strong> (in certain cases) duringserviceJ (4) Occupati<strong>on</strong>al Injur<strong>ie</strong>s Benefits. 13,955 16,137 30,092 16,901 17,016 33,917K No <strong>Social</strong> Insurance benefits. Class K 27,894 11,181 39,075 30,890 11,842 42,732c<strong>on</strong>sists of the Health C<strong>on</strong>tributi<strong>on</strong>.M Occupati<strong>on</strong>al Injur<strong>ie</strong>s Benefits in 97,996 70,213 168,209 106,107 72,700 178,807certain circumstances.P Treatment Benefit and limited14 0 14 14 0 14Jobseeker’s and Illness Benefits.S Widow/er’s (C<strong>on</strong>tributory) Pensi<strong>on</strong>s,Guardian’s Payment (C<strong>on</strong>tributory),State Pensi<strong>on</strong> (C<strong>on</strong>tributory),Bereavement Grant, Maternity Benefitand Adoptive Benefit.284,466 77,303 361,769 262,078 74,109 338,187High Rate + Low Rate: State1,250 790 2,040 1,367 919 2,286Pensi<strong>on</strong> (Transiti<strong>on</strong>), StatePensi<strong>on</strong> (C<strong>on</strong>tributory), Widow/er’s(C<strong>on</strong>tributory) Pensi<strong>on</strong>, Guardian’sPayment (C<strong>on</strong>tributory) andBereavement Grant.Voluntary C<strong>on</strong>tributorsTOTAL 1,742,221 1,392,422 3,134,643 1,711,631 1,396,711 3,108,342(1) Revised figures(2) Provisi<strong>on</strong>al figures(3) This includes 173,338 and 216,988 people in 2007 and 2008 respectively in receipt of credited c<strong>on</strong>tributi<strong>on</strong>s.(4) Class J includes FAS and other trainees.Note: The figures for 2008 represent the most recent out-turn of End-of-Year returns received for the Revenue Commissi<strong>on</strong>ers for both employees and self-employedc<strong>on</strong>tributors. For example, the Self-Employed figures represent the number of self-employed returns received in the Department at the time the extracti<strong>on</strong> exercise was carr<strong>ie</strong>dout. As the transfer of End of Year data is an <strong>on</strong>going process, these figure should not be v<strong>ie</strong>wed as an estimate of the final outturn of c<strong>on</strong>tributors for that year. Data for<strong>2009</strong> is not yet processed.<str<strong>on</strong>g>Statistical</str<strong>on</strong>g> <str<strong>on</strong>g>Informati<strong>on</strong></str<strong>on</strong>g> <strong>on</strong> <strong>Social</strong> <strong>Welfare</strong> <strong>Services</strong> <strong>2009</strong>
summary and older financial peopleGraph A8: Analysis of Insured Populati<strong>on</strong>, 2008Class A 77.1%Class J 1.1%Class S, P & Voluntary 10.9%Class E & H 0.3%Class K & M 7.1%Class B,C & D 3.5%Table A19: Number of Insured Pers<strong>on</strong>s, 1999/2000 to 2008Year Insured Populati<strong>on</strong> Index1999/2000 2,310,525 100.02000/2001 2,417,231 104.62001 (1) 2,410,265 104.32002 2,503,671 108.42003 2,662,148 115.22004 2,752,162 119.12005 2,880,190 124.72006 3,014,487 130.52007 (2) 3,134,643 135.72008 (3) 3,108,342 134.5(1) Short Tax Year(2) Revised(3) Provisi<strong>on</strong>al21<str<strong>on</strong>g>Statistical</str<strong>on</strong>g> <str<strong>on</strong>g>Informati<strong>on</strong></str<strong>on</strong>g> <strong>on</strong> <strong>Social</strong> <strong>Welfare</strong> <strong>Services</strong> <strong>2009</strong>
older summary people and financialTable A20: <strong>Social</strong> <strong>Welfare</strong> Weekly Rates of Payment from January <strong>2009</strong>Type of Payment Pers<strong>on</strong>al Qualif<strong>ie</strong>dAdultChild€ € €SOCIAL INSURANCEL<strong>on</strong>g TermState Pensi<strong>on</strong> (C<strong>on</strong>tributory / Transiti<strong>on</strong>) (1) 230.30 153.50 26.00Invalidity Pensi<strong>on</strong> (2)(3) 209.80 149.70 26.00Widow/er’s (C<strong>on</strong>tributory) Pensi<strong>on</strong> / Deserted 209.80 - 26.00Wife’s Benefit (4)Guardian’s Payment (C<strong>on</strong>tributory) 176.50 - -Death Benefit Pensi<strong>on</strong> 234.70 - -Disablement Pensi<strong>on</strong> 235.40 - -Short TermIllness / Jobseeker’s Benefit 204.30 135.60 26.00Carer’s Benefit 221.20 - 26.0022SOCIAL ASSISTANCEL<strong>on</strong>g TermState Pensi<strong>on</strong> (N<strong>on</strong>-C<strong>on</strong>tributory) 219.00 144.70 26.00Widow/er’s (N<strong>on</strong>-C<strong>on</strong>tributory) Pensi<strong>on</strong> 204.30 - 26.00Deserted / Pris<strong>on</strong>er’s Wife’s Allowance 204.30 - 26.00One-Parent Family Payment 204.30 - 26.00Guardian’s Payment (N<strong>on</strong>-C<strong>on</strong>tributory) 176.50 - -Carer’s Allowance (5) 220.50 - 26.00Jobseeker’s Allowance (L<strong>on</strong>g Term) 204.30 135.60 26.00Pre-Retirement Allowance 204.30 135.60 26.00Disability Allowance 204.30 135.60 26.00Farm Assist 204.30 135.60 26.00Short TermJobseeker’s Allowance (Short Term) 204.30 135.60 26.00Supplementary <strong>Welfare</strong> Allowance 204.30 135.60 26.00OTHER PAYMENTSLiving Al<strong>on</strong>e Allowance 7.70 - -Over 80 Allowance 10.00 - -Island Allowance 12.70 - -Child Benefit (6) (m<strong>on</strong>thly) - 1st & 2nd Child 166.00 - -- 3rd & other Children 203.00 - -(1) If Qualif<strong>ie</strong>d Adult is 66 years or over a rate of €206.30 is payable.(2) If Invalidity Pensi<strong>on</strong>er is age 65 a rate of €230.30 is payable.(3) If qualif<strong>ie</strong>d adult is age 66 or over a rate of €206.30 is payable.(4) If Recip<strong>ie</strong>nt is 66 or over a rate of €230.30 is payable.(5) If Recip<strong>ie</strong>nt is aged 66 or over a rate of €239.00 is payable.(6) These rates apply from April <strong>2009</strong>.<str<strong>on</strong>g>Statistical</str<strong>on</strong>g> <str<strong>on</strong>g>Informati<strong>on</strong></str<strong>on</strong>g> <strong>on</strong> <strong>Social</strong> <strong>Welfare</strong> <strong>Services</strong> <strong>2009</strong>
summary and older financial peopleTable A21: <strong>Social</strong> <strong>Welfare</strong> Weekly Rates of Payment from January 2010Type of Payment Pers<strong>on</strong>al Qualif<strong>ie</strong>dAdultChild€ € €SOCIAL INSURANCEL<strong>on</strong>g TermState Pensi<strong>on</strong> (C<strong>on</strong>tributory / Transiti<strong>on</strong>) (1) 230.30 153.50 29.80Invalidity Pensi<strong>on</strong> (2) (3) 201.50 143.80 29.80Widow/er’s (C<strong>on</strong>tributory) Pensi<strong>on</strong> / Deserted 201.50 - 29.80Wife’s Benefit (4)Guardian’s Payment (C<strong>on</strong>tributory) 169.00 - -Death Benefit Pensi<strong>on</strong> 226.50 - 29.80Disablement Pensi<strong>on</strong> 227.00 - -Short TermIllness / Jobseeker’s Benefit 196.00 130.10 29.80Carer’s Benefit 213.00 - 29.80SOCIAL ASSISTANCEL<strong>on</strong>g TermState Pensi<strong>on</strong> (N<strong>on</strong>-C<strong>on</strong>tributory) 219.00 144.70 29.80Widow/er’s (N<strong>on</strong>-C<strong>on</strong>tributory) Pensi<strong>on</strong> 196.00 - 29.80Deserted / Pris<strong>on</strong>er’s Wife’s Allowance 196.00 - 29.80One-Parent Family Payment 196.00 - 29.80Guardian’s Payment (N<strong>on</strong>-C<strong>on</strong>tributory) 169.00 - -Carer’s Allowance (5) 212.00 - 29.80Jobseeker’s Allowance (L<strong>on</strong>g Term) 196.00 130.10 29.80Pre-Retirement Allowance 196.00 130.10 29.80Disability Allowance 196.00 130.10 29.80Farm Assist 196.00 130.10 29.80Short TermJobseeker’s Allowance (Short Term) 196.00 130.10 29.80Supplementary <strong>Welfare</strong> Allowance 196.00 130.10 29.8023OTHER PAYMENTSLiving Al<strong>on</strong>e Allowance 7.70 - -Over 80 Allowance 10.00 - -Island Allowance 12.70 - -Child Benefit (m<strong>on</strong>thly) - 1st & 2nd Child 150.00 - -- 3rd & other Children 187.00 - -(1) If Qualif<strong>ie</strong>d Adult is 66 years or over a rate of €206.30 is payable.(2) If Invalidity Pensi<strong>on</strong>er is age 65 a rate of €230.30 is payable.(3) If qualif<strong>ie</strong>d adult is age 66 or over a rate of €206.30 is payable.(4) If Recip<strong>ie</strong>nt is 66 or over a rate of €230.30 is payable.(5) If Recip<strong>ie</strong>nt is aged 66 or over a rate of €239.00 is payable.<str<strong>on</strong>g>Statistical</str<strong>on</strong>g> <str<strong>on</strong>g>Informati<strong>on</strong></str<strong>on</strong>g> <strong>on</strong> <strong>Social</strong> <strong>Welfare</strong> <strong>Services</strong> <strong>2009</strong>
older summary people and financialTable A22: Index of Short-Term Rates of Payment and C<strong>on</strong>sumer Price Index, 2000 to<strong>2009</strong>Year Single Pers<strong>on</strong> Couple Couple with2 childrenincluding ChildBenefitCouple with4 childrenincluding ChildBenefitC<strong>on</strong>sumerPrice Index (1)2000 100.0 100.0 100.0 100.0 100.02001 110.3 112.0 108.3 106.1 104.92002 120.7 125.0 123.5 122.8 109.72003 126.8 131.3 129.4 128.7 113.62004 137.0 141.8 137.8 136.0 116.02005 151.2 156.6 149.9 146.6 118.92006 168.5 174.5 163.8 157.9 123.62007 188.8 195.5 184.7 178.0 129.62008 201.0 208.2 196.3 189.0 134.9<strong>2009</strong> 207.6 215.0 202.7 194.9 128.8(1) Rebased from data published by the Central Statistics Office.Note: Based <strong>on</strong> the rates of Jobseeker’s Benefit, Jobseeker’s Allowance and Illness Benefit.Table A23: Index of L<strong>on</strong>g-Term Rates of Payment and C<strong>on</strong>sumer Price Index, 2000 to<strong>2009</strong>24Year Single Pers<strong>on</strong> Couple Couple with2 childrenincluding ChildBenefitCouple with4 childrenincluding ChildBenefitC<strong>on</strong>sumerPrice Index (1)2000 100.0 100.0 100.0 100.0 100.02001 110.4 111.5 108.3 106.3 104.92002 120.8 123.7 122.3 121.7 109.72003 129.1 132.2 129.7 128.6 113.62004 137.3 140.6 136.8 134.9 116.02005 147.1 150.7 145.7 143.1 118.92006 158.6 162.4 155.5 151.6 123.62007 171.7 175.9 168.8 164.3 129.62008 183.2 187.6 179.7 174.7 134.9<strong>2009</strong> 188.9 193.5 185.3 180.1 128.8(1) Rebased from data published by the Central Statistics Office.Note: Based <strong>on</strong> the rates of State Pensi<strong>on</strong> (C<strong>on</strong>tributory).<str<strong>on</strong>g>Statistical</str<strong>on</strong>g> <str<strong>on</strong>g>Informati<strong>on</strong></str<strong>on</strong>g> <strong>on</strong> <strong>Social</strong> <strong>Welfare</strong> <strong>Services</strong> <strong>2009</strong>
Secti<strong>on</strong> BOlder People
older peopleSecti<strong>on</strong> B: Older PeopleExpenditure and Recip<strong>ie</strong>ntsExpenditure <strong>on</strong> payments for older people was over €4,569 milli<strong>on</strong> in <strong>2009</strong>. This represents an increase of 6.3%<strong>on</strong> 2008.The overall number of payments for older people rose by 14,731 in <strong>2009</strong>, an increase of 4.0% <strong>on</strong> 2008.The number of people in receipt of a c<strong>on</strong>tributory pensi<strong>on</strong> (State Pensi<strong>on</strong> (C<strong>on</strong>tributory) and State Pensi<strong>on</strong>(Transiti<strong>on</strong>)) based <strong>on</strong> social insurance c<strong>on</strong>tributi<strong>on</strong>s rose by 16,121 while the number of people in receipt ofthe means tested State Pensi<strong>on</strong> (N<strong>on</strong>-C<strong>on</strong>tributory) increased by 14. The number of people in receipt of Pre-Retirement Allowance fell by 1,404 in <strong>2009</strong>.Notes: Scheme Changes and Comparability of Year-<strong>on</strong>-Year Data26In 2006 age related pensi<strong>on</strong>s were replaced by State Pensi<strong>on</strong>s, with significant administrative alterati<strong>on</strong>s toseveral weekly payment types which had up to that point provided for people aged over 65. These changes,implemented in stages following the introducti<strong>on</strong> of the State Pensi<strong>on</strong>s, have resulted in substantial migrati<strong>on</strong>sof recip<strong>ie</strong>nts between scheme types, with accompanying changes in expenditure <strong>on</strong> these schemes. The mostsignificant transfers of recip<strong>ie</strong>nts were those involving State Pensi<strong>on</strong> (C<strong>on</strong>tributory), formerly known as Old AgePensi<strong>on</strong> (C<strong>on</strong>tributory), and State Pensi<strong>on</strong> (Transiti<strong>on</strong>), formerly known as Retirement Pensi<strong>on</strong>.Recip<strong>ie</strong>nts of Widow/er’s Pensi<strong>on</strong>, Deserted Wife’s Allowance, Blind Pensi<strong>on</strong>, One Parent Family Payment andPris<strong>on</strong>er’s Wife’s Allowance have since 2006 been transferred to State Pensi<strong>on</strong> (N<strong>on</strong>-C<strong>on</strong>tributory) up<strong>on</strong> reaching66 years of age, resulting in some decreases in recip<strong>ie</strong>nts and expenditure <strong>on</strong> such schemes and c<strong>on</strong>comitantincreases in recip<strong>ie</strong>nts and expenditure <strong>on</strong> State Pensi<strong>on</strong> (N<strong>on</strong>-C<strong>on</strong>tributory). Further alterati<strong>on</strong>s have resulted inQualif<strong>ie</strong>d Adults of a State Pensi<strong>on</strong> (N<strong>on</strong>-C<strong>on</strong>tributory) aged over 66 qualifying for a pensi<strong>on</strong> in their own right,with recip<strong>ie</strong>nts of Invalidity Pensi<strong>on</strong> aged 66 years or over being automatically transferred to State Pensi<strong>on</strong>(C<strong>on</strong>tributory) <strong>on</strong> reaching that age threshold.A side-effect of these changes is the erosi<strong>on</strong> of data comparability between 2006 and subsequent years in relati<strong>on</strong>to recip<strong>ie</strong>nts and expenditure <strong>on</strong> the affected schemes<str<strong>on</strong>g>Statistical</str<strong>on</strong>g> <str<strong>on</strong>g>Informati<strong>on</strong></str<strong>on</strong>g> <strong>on</strong> <strong>Social</strong> <strong>Welfare</strong> <strong>Services</strong> <strong>2009</strong>
older peopleGraph B1: Number of Recip<strong>ie</strong>nts of State Pensi<strong>on</strong>s, 2000 to <strong>2009</strong><strong>2009</strong>2008200720062005200420032002200120000 50,000 100,000 150,000 200,000 250,000 300,000 350,000 400,000State Pensi<strong>on</strong> (C<strong>on</strong>tributory)State Pensi<strong>on</strong> (Transiti<strong>on</strong>)State Pensi<strong>on</strong> (N<strong>on</strong>-C<strong>on</strong>tributory)Pre-Retirement AllowanceTable B1: Expenditure <strong>on</strong> Older People by Payment Type, 2008 and <strong>2009</strong>27Payment Type 2008 <strong>2009</strong> (1) Change <strong>2009</strong> over 2008€000 €000<strong>Social</strong> InsuranceState Pensi<strong>on</strong> (C<strong>on</strong>tributory) 3,117,855 3,367,529 8.0%State Pensi<strong>on</strong> (Transiti<strong>on</strong>) 92,089 104,973 14.0%<strong>Social</strong> AssistanceState Pensi<strong>on</strong> (N<strong>on</strong>-C<strong>on</strong>tributory) 972,765 1,000,546 2.9%Pre-Retirement Allowance 117,666 96,606 -17.9%TOTAL 4,300,375 4,569,654 6.3%(1) Provisi<strong>on</strong>al<str<strong>on</strong>g>Statistical</str<strong>on</strong>g> <str<strong>on</strong>g>Informati<strong>on</strong></str<strong>on</strong>g> <strong>on</strong> <strong>Social</strong> <strong>Welfare</strong> <strong>Services</strong> <strong>2009</strong>
older peopleTable B2: Expenditure <strong>on</strong> Older People by Payment Type, 2000 to <strong>2009</strong>Year State Pensi<strong>on</strong>(C<strong>on</strong>tributory) (1)State Pensi<strong>on</strong>(Transiti<strong>on</strong>) (1)State Pensi<strong>on</strong>(N<strong>on</strong>-C<strong>on</strong>tributory) (1)Pre-RetirementAllowanceTotal€000 €000 €000 €000 €0002000 577,365 594,239 456,230 79,252 1,707,0862001 716,474 697,349 490,718 82,774 1,987,3152002 868,529 803,413 537,308 87,028 2,296,2782003 946,902 898,981 565,006 89,077 2,499,9662004 1,050,348 983,706 599,988 94,726 2,728,7682005 1,152,849 1,060,052 631,299 102,879 2,947,0792006 1,580,896 857,627 727,782 113,063 3,279,3682007 2,754,749 79,070 920,167 124,490 3,878,4762008 3,117,855 92,089 972,765 117,666 4,300,375<strong>2009</strong> (2) 3,367,529 104,973 1,000,546 96,606 4,569,654(1) See note <strong>on</strong> scheme changes and comparability of data in the introducti<strong>on</strong> to this secti<strong>on</strong>(2) Provisi<strong>on</strong>al.Table B3: Number of Recip<strong>ie</strong>nts by Type of State Pensi<strong>on</strong>, 2000 to <strong>2009</strong>28YearState Pensi<strong>on</strong>(C<strong>on</strong>tributory) (1)State Pensi<strong>on</strong>(Transiti<strong>on</strong>) (1)State Pensi<strong>on</strong>(N<strong>on</strong>-C<strong>on</strong>tributory) (1)Pre-RetirementAllowance2000 86,217 78,370 90,652 12,521 267,7602001 94,871 80,326 89,061 11,807 276,0652002 105,295 83,055 87,823 11,222 287,3952003 113,970 86,509 86,733 10,957 298,1692004 118,383 88,870 85,172 11,228 303,6532005 124,611 91,047 84,454 11,058 311,1702006 139,724 91,086 97,404 11,149 339,3632007 237,599 5,851 97,726 10,624 351,8002008 250,117 7,242 97,784 8,872 364,015<strong>2009</strong> 265,102 8,378 97,798 7,468 378,746(1) See note <strong>on</strong> scheme changes and comparability of data in the introducti<strong>on</strong> to this secti<strong>on</strong>Total<str<strong>on</strong>g>Statistical</str<strong>on</strong>g> <str<strong>on</strong>g>Informati<strong>on</strong></str<strong>on</strong>g> <strong>on</strong> <strong>Social</strong> <strong>Welfare</strong> <strong>Services</strong> <strong>2009</strong>
older peopleTable B4: Number of Recip<strong>ie</strong>nts of State Pensi<strong>on</strong>s by Type of Pensi<strong>on</strong> and Number ofQualif<strong>ie</strong>d Adults and Children, <strong>2009</strong>DependencyStatusState Pensi<strong>on</strong>(C<strong>on</strong>tributory)State Pensi<strong>on</strong>(Transiti<strong>on</strong>)State Pensi<strong>on</strong>(N<strong>on</strong>-C<strong>on</strong>tributory)Pre-retirementAllowanceTotalPers<strong>on</strong>al Rate <strong>on</strong>ly 200,592 6,186 94,751 1,694 303,223With Qualif<strong>ie</strong>d Adult under 66 18,537 1,837 2,910 2,021 25,305With Qualif<strong>ie</strong>d Adult over 66 44,909 259 45 0 45,2131 full rate Qualif<strong>ie</strong>d Child 914 69 245 247 1,4752 full rate Qualif<strong>ie</strong>d Children 164 10 64 67 3053 full rate Qualif<strong>ie</strong>d Children 40 4 20 18 824 full rate Qualif<strong>ie</strong>d Children 11 3 9 9 325 full rate Qualif<strong>ie</strong>d Children 4 0 1 2 56+ full rate Qualif<strong>ie</strong>d Children 2 0 0 1 31 half rate Qualif<strong>ie</strong>d Child 731 71 62 56 9202 half rate Qualif<strong>ie</strong>d Children 200 18 19 17 2543 half rate Qualif<strong>ie</strong>d Children 46 2 3 2 534 half rate Qualif<strong>ie</strong>d Children 2 1 2 1 65 half rate Qualif<strong>ie</strong>d Children 2 0 1 2 56+ half rate Qualif<strong>ie</strong>d Children 0 0 0 1 1Recip<strong>ie</strong>nts with Qualif<strong>ie</strong>dChild allowances2,116 178 426 423 3,14329Percentage of recip<strong>ie</strong>nts withQualif<strong>ie</strong>d Child Allowances0.8% 2.1% 0.4% 5.7% 0.9%Total Number of Qualif<strong>ie</strong>d63,446 2,096 2,955 2,021 70,518AdultsTotal Number of Children (1) 2,715 230 596 612 4,153(1) A Qualif<strong>ie</strong>d Child increase is payable at half rate where a spouse living with the recip<strong>ie</strong>nt is not a Qualif<strong>ie</strong>d Adult. Each spouse may receive half the Qualif<strong>ie</strong>d Childincrease where both spouses are in receipt of a <strong>Social</strong> <strong>Welfare</strong> payment. This can result in an element of double-counting.<str<strong>on</strong>g>Statistical</str<strong>on</strong>g> <str<strong>on</strong>g>Informati<strong>on</strong></str<strong>on</strong>g> <strong>on</strong> <strong>Social</strong> <strong>Welfare</strong> <strong>Services</strong> <strong>2009</strong>
older peopleTable B5: Number of Recip<strong>ie</strong>nts of State Pensi<strong>on</strong>s by Type of Pensi<strong>on</strong>, Age and Sex, <strong>2009</strong>Age GroupState Pensi<strong>on</strong> State Pensi<strong>on</strong> State Pensi<strong>on</strong>Total(C<strong>on</strong>tributory) (Transiti<strong>on</strong>) (N<strong>on</strong>-C<strong>on</strong>tributory)Males Females Males Females Males Females Males FemalesUnder 70 years 52,882 26,562 5,718 2,660 7,716 10,749 66,316 39,97170 to 74 years 53,849 24,597 0 0 8,357 13,373 62,206 37,97075 to 79 years 39,145 19,162 0 0 7,533 13,079 46,678 32,24180 to 84 years 19,851 11,071 0 0 6,742 11,631 26,593 22,70285 to 89 years 8,028 5,475 0 0 4,014 8,418 12,042 13,89390 to 94 years 1,952 1,764 0 0 1,285 3,561 3,237 5,32595 years and over 306 458 0 0 230 1,110 536 1,568Total 176,013 89,089 5,718 2,660 35,877 61,921 217,608 153,670OVERALL TOTAL 265,102 8,378 97,798 371,278Table B6: Number of Recip<strong>ie</strong>nts of Pre-Retirement Allowance by Age and Sex, <strong>2009</strong>30Age Male Female Total57 179 50 22958 410 121 53159 536 168 70460 707 207 91461 810 221 1,03162 840 242 1,08263 769 259 1,02864 862 239 1,10165 623 225 848Total 5,736 1,732 7,468Note: Pre-Retirement Allowance was abolished for new claimants with effect from 4th July 2007Table B7: Number of Recip<strong>ie</strong>nts of Living Al<strong>on</strong>e Allowance, Over 80 Allowanceand Island Allowance by Pensi<strong>on</strong> Type, <strong>2009</strong>Pensi<strong>on</strong> Type Living Al<strong>on</strong>e Allowance Over 80 Allowance Island AllowanceState Pensi<strong>on</strong> (C<strong>on</strong>tributory) 54,903 48,930 126State Pensi<strong>on</strong> (N<strong>on</strong>-C<strong>on</strong>tributory) 33,032 37,171 250Total 87,935 86,101 376<str<strong>on</strong>g>Statistical</str<strong>on</strong>g> <str<strong>on</strong>g>Informati<strong>on</strong></str<strong>on</strong>g> <strong>on</strong> <strong>Social</strong> <strong>Welfare</strong> <strong>Services</strong> <strong>2009</strong>
older peopleTable B8: Number of Recip<strong>ie</strong>nts of State Pensi<strong>on</strong>s by Type of Payment and County, <strong>2009</strong>CountyState Pensi<strong>on</strong>(C<strong>on</strong>tributory)State Pensi<strong>on</strong>(Transiti<strong>on</strong>)State Pensi<strong>on</strong>(N<strong>on</strong>-C<strong>on</strong>tributory)Pre-RetirementAllowanceCarlow 2,802 81 1,207 119Cavan 2,974 113 2,756 115Clare 5,017 218 3,838 192Cork 26,231 899 10,755 918D<strong>on</strong>egal 6,605 257 6,620 638Dublin 71,321 2,436 11,951 1,482Galway 9,657 328 7,811 333Kerry 6,638 189 5,372 314Kildare 7,293 283 1,852 146Kilkenny 4,172 142 2,295 155Laois 2,851 82 1,690 93Leitrim 1,616 58 1,414 39Limerick 9,885 349 4,383 332L<strong>on</strong>gford 1,765 59 1,439 63Louth 6,771 198 2,101 271Mayo 6,002 198 6,085 281Meath 6,697 283 2,424 183M<strong>on</strong>aghan 2,656 67 2,149 109Offaly 3,419 106 1,669 80Roscomm<strong>on</strong> 2,876 100 2,599 97Sligo 3,307 120 2,153 108Tipperary 8,301 226 4,911 362Waterford 6,306 233 2,507 282Westmeath 4,107 122 1,938 78Wexford 7,345 242 3,880 483Wicklow 6,911 260 1,955 195Others 41,577 729 44 0Total 265,102 8,378 97,798 7,46831<str<strong>on</strong>g>Statistical</str<strong>on</strong>g> <str<strong>on</strong>g>Informati<strong>on</strong></str<strong>on</strong>g> <strong>on</strong> <strong>Social</strong> <strong>Welfare</strong> <strong>Services</strong> <strong>2009</strong>
32<str<strong>on</strong>g>Statistical</str<strong>on</strong>g> <str<strong>on</strong>g>Informati<strong>on</strong></str<strong>on</strong>g> <strong>on</strong> <strong>Social</strong> <strong>Welfare</strong> <strong>Services</strong> <strong>2009</strong>
Secti<strong>on</strong> CWidows, Widowers and One Parent Famil<strong>ie</strong>s
widows, widowers and<strong>on</strong>e parent famil<strong>ie</strong>sSecti<strong>on</strong> C: Widows, Widowers and One ParentFamil<strong>ie</strong>sExpenditure and Recip<strong>ie</strong>ntsExpenditure <strong>on</strong> Widows, Widowers and One Parent Famil<strong>ie</strong>s increased by 4.1% overall in <strong>2009</strong>.The payment type in this programme group with both the largest expenditure and number of recip<strong>ie</strong>nts is Widow/er’s (C<strong>on</strong>tributory) Pensi<strong>on</strong>. At the end of <strong>2009</strong> there were 113,108 recip<strong>ie</strong>nts (98,147 widows and 14,961widowers). Expenditure in <strong>2009</strong> was nearly €1,354 milli<strong>on</strong> which represented an increase of 4.2% over 2008.The number of recip<strong>ie</strong>nts of Deserted Wife’s Benefit and Deserted Wife’s Allowance fell by 319 and 67 respectivelyduring <strong>2009</strong>.Expenditure <strong>on</strong> One-Parent Family Payment increased by 5.1%, while the number of recip<strong>ie</strong>nts rose by 2,644, anincrease of 3.0% <strong>on</strong> 2008.Notes: Scheme Changes and Comparability of Year-<strong>on</strong>-Year Data34In 2006 Age related pensi<strong>on</strong>s were replaced by State Pensi<strong>on</strong>s, with significant administrative alterati<strong>on</strong>s toseveral weekly payment types which had up to that point provided for people aged over 65. These alterati<strong>on</strong>s,implemented in stages following the introducti<strong>on</strong> of the State Pensi<strong>on</strong>s, have resulted in substantial migrati<strong>on</strong>sof recip<strong>ie</strong>nts between scheme types, with accompanying changes in expenditure <strong>on</strong> these schemes. The mostsignificant transfers of recip<strong>ie</strong>nts were those involving State Pensi<strong>on</strong> (C<strong>on</strong>tributory), formerly known as Old AgePensi<strong>on</strong> (C<strong>on</strong>tributory), and State Pensi<strong>on</strong> (Transiti<strong>on</strong>), formerly known as Retirement Pensi<strong>on</strong>.Recip<strong>ie</strong>nts of Widow/er’s Pensi<strong>on</strong>, Deserted Wife’s Allowance, Blind Pensi<strong>on</strong>, One Parent Family Payment andPris<strong>on</strong>er’s Wife’s Allowance have since 2006 been transferred to State Pensi<strong>on</strong> (N<strong>on</strong>-C<strong>on</strong>tributory) up<strong>on</strong> reaching66 years of age, resulting in some decreases in recip<strong>ie</strong>nts and expenditure <strong>on</strong> such schemes and c<strong>on</strong>comitantincreases in recip<strong>ie</strong>nts and expenditure <strong>on</strong> State Pensi<strong>on</strong> (N<strong>on</strong>-C<strong>on</strong>tributory). Further alterati<strong>on</strong>s resulted inQualif<strong>ie</strong>d Adults of a State Pensi<strong>on</strong> (N<strong>on</strong>-C<strong>on</strong>tributory) aged over 66 qualifying for a pensi<strong>on</strong> in their own right,with recip<strong>ie</strong>nts of Invalidity Pensi<strong>on</strong> aged 66 years or over being automatically transferred to State Pensi<strong>on</strong>(C<strong>on</strong>tributory) <strong>on</strong> reaching that age threshold.A side-effect of these changes is the erosi<strong>on</strong> of data comparability between 2006 and subsequent years in relati<strong>on</strong>to recip<strong>ie</strong>nts and expenditure <strong>on</strong> the affected schemes.<str<strong>on</strong>g>Statistical</str<strong>on</strong>g> <str<strong>on</strong>g>Informati<strong>on</strong></str<strong>on</strong>g> <strong>on</strong> <strong>Social</strong> <strong>Welfare</strong> <strong>Services</strong> <strong>2009</strong>
widows, widowers and<strong>on</strong>e parent famil<strong>ie</strong>sGraph C1: Number of Recip<strong>ie</strong>nts of One-Parent Family Payment by Age and Sex, <strong>2009</strong>25,00020,000MaleFemale15,00010,0005,000-Under 20years20 to 24years25 to 29years30 to 34years35 to 39years40 to 44years45 to 49years50 to 54years55 to 59years60 to 64years65 yearsand overTable C1: Expenditure <strong>on</strong> Widow’s, Widower’s and One-Parent Famil<strong>ie</strong>s by PaymentType, 2008 and <strong>2009</strong>Payment Type 2008 <strong>2009</strong> (1) Change <strong>2009</strong> over 2008€000 €000SOCIAL INSURANCEWidow/er’s (C<strong>on</strong>tributory) Pensi<strong>on</strong> 1,299,039 1,353,507 4.2%Deserted Wife’s Benefit 104,618 100,261 -4.2%Widowed Parent Grant (C<strong>on</strong>tributory) 5,543 5,504 -0.7%SOCIAL ASSISTANCEWidow/er’s (N<strong>on</strong>-C<strong>on</strong>tributory) Pensi<strong>on</strong> 21,181 21,275 0.4%Deserted Wife’s Allowance 6,624 6,038 -8.8%Pris<strong>on</strong>er’s Wife’s Allowance 7 6 -14.3%One-Parent Family Payment 1,067,158 1,121,344 5.1%Widowed Parent Grant (N<strong>on</strong>-C<strong>on</strong>tributory) 529 425 -19.7%TOTAL 2,504,699 2,608,360 4.1%(1) Provisi<strong>on</strong>al35Table C2: Expenditure <strong>on</strong> Widow/er’s Pensi<strong>on</strong>s, 2000 to <strong>2009</strong>Year Widow/er’s (C<strong>on</strong>tributory) Pensi<strong>on</strong> Widow/er’s (N<strong>on</strong>-C<strong>on</strong>tributory) Pensi<strong>on</strong> (1) Total€000 €000 €0002000 597,473 94,377 691,8502001 672,959 107,164 780,1232002 761,539 116,493 878,0322003 826,135 116,834 942,9692004 906,449 122,300 1,028,7492005 998,524 126,944 1,125,4682006 1,094,884 103,688 1,198,5722007 1,204,979 19,921 1,224,9002008 1,299,039 21,181 1,320,220<strong>2009</strong> (2) 1,353,507 21,275 1,374,782(1) See note <strong>on</strong> scheme changes and data comparability in the introducti<strong>on</strong> to this secti<strong>on</strong>(2) Provisi<strong>on</strong>al<str<strong>on</strong>g>Statistical</str<strong>on</strong>g> <str<strong>on</strong>g>Informati<strong>on</strong></str<strong>on</strong>g> <strong>on</strong> <strong>Social</strong> <strong>Welfare</strong> <strong>Services</strong> <strong>2009</strong>
widows, widowers and<strong>on</strong>e parent famil<strong>ie</strong>sTable C3: Expenditure <strong>on</strong> Deserted Wife’s Benefit, Deserted Wife’s Allowance,Pris<strong>on</strong>er’s Wife’s Allowance and One-Parent Family Payment, 2000 to <strong>2009</strong>YearDeserted Wife’sBenefitDesertedWife’sAllowance (1)Pris<strong>on</strong>er’s WifeAllowance (1)One-Parent FamilyPayment (1)Total€000 €000 €000 €000 €0002000 83,921 8,394 15 480,113 572,4432001 84,877 9,179 13 537,376 631,4452002 88,150 10,238 12 613,035 711,4352003 89,234 10,605 13 660,586 760,4382004 89,749 10,967 15 694,835 795,5662005 90,620 11,468 14 751,102 853,2042006 94,621 10,547 13 834,262 939,4432007 100,710 6,897 16 962,425 1,070,0482008 104,618 6,624 7 1,067,158 1,178,407<strong>2009</strong> (2) 100,261 6,038 6 1,121,344 1,227,649(1) See note <strong>on</strong> scheme changes and data comparability in the introducti<strong>on</strong> to this secti<strong>on</strong>(2) Provisi<strong>on</strong>al36Table C4: Number of Recip<strong>ie</strong>nts of Widow/er’s Pensi<strong>on</strong>s, 2000 to <strong>2009</strong>YearWidow/er’s (C<strong>on</strong>tributory)Pensi<strong>on</strong>Widow/er’s (N<strong>on</strong>-C<strong>on</strong>tributory)Pensi<strong>on</strong> (1)2000 100,374 17,367 117,7412001 101,267 16,811 118,0782002 102,494 16,318 118,8122003 103,831 15,783 119,6142004 105,338 15,284 120,6222005 109,017 14,729 123,7462006 110,146 2,168 112,3142007 111,460 2,138 113,5982008 112,237 2,042 114,279<strong>2009</strong> 113,108 1,998 115,106(1) See note <strong>on</strong> scheme changes and data comparability in the introducti<strong>on</strong> to this secti<strong>on</strong>Total<str<strong>on</strong>g>Statistical</str<strong>on</strong>g> <str<strong>on</strong>g>Informati<strong>on</strong></str<strong>on</strong>g> <strong>on</strong> <strong>Social</strong> <strong>Welfare</strong> <strong>Services</strong> <strong>2009</strong>
widows, widowers and<strong>on</strong>e parent famil<strong>ie</strong>sTable C5: Number of Recip<strong>ie</strong>nts of Widow/er’s (C<strong>on</strong>tributory) Pensi<strong>on</strong> and DesertedWife’s Benefit by Number of Qualif<strong>ie</strong>d Children, <strong>2009</strong>Type of Recip<strong>ie</strong>ntWidow/er’s (C<strong>on</strong>tributory)Pensi<strong>on</strong>Deserted Wife’s BenefitWithout Qualif<strong>ie</strong>d Children 105,891 7,430 113,321With 1 child 3,998 941 4,939With 2 children 2,072 284 2,356With 3 children 840 65 905With 4 children 239 8 247With 5 children 47 5 52With 6 or more children 21 4 25Total Recip<strong>ie</strong>nts 113,108 8,737 121,845Total Recip<strong>ie</strong>nts with children 7,217 1,307 8,524% of Recip<strong>ie</strong>nts with children 6.4% 15.0% 7.0%Total Number of children 12,069 1,785 13,854TotalTable C6: Number of Recip<strong>ie</strong>nts of Widow/er’s Pensi<strong>on</strong>s by Age and Sex, <strong>2009</strong>Age C<strong>on</strong>tributory Pensi<strong>on</strong>s N<strong>on</strong>-C<strong>on</strong>tributory Pensi<strong>on</strong>s OverallTotalWidows Widowers Total Widows Widowers TotalUnder 25 years 6 0 6 0 0 0 625 to 29 years 48 6 54 1 0 1 5530 to 34 years 174 46 220 2 0 2 22235 to 39 years 496 151 647 4 2 6 65340 to 44 years 1,086 349 1,435 29 7 36 1,47145 to 49 years 2,160 779 2,939 77 20 97 3,03650 to 54 years 3,716 1,367 5,083 186 34 220 5,30355 to 59 years 5,934 2,185 8,119 378 58 436 8,55560 to 64 years 9,428 3,186 12,614 835 97 932 13,54665 to 69 years 11,777 2,352 14,129 245 23 268 14,39770 to 74 years 15,168 1,735 16,903 0 0 0 16,90375 to 79 years 16,829 1,326 18,155 0 0 0 18,15580 years and over 31,325 1,479 32,804 0 0 0 32,804TOTAL 98,147 14,961 113,108 1,757 241 1,998 115,10637<str<strong>on</strong>g>Statistical</str<strong>on</strong>g> <str<strong>on</strong>g>Informati<strong>on</strong></str<strong>on</strong>g> <strong>on</strong> <strong>Social</strong> <strong>Welfare</strong> <strong>Services</strong> <strong>2009</strong>
widows, widowers and<strong>on</strong>e parent famil<strong>ie</strong>sTable C7: Number of Recip<strong>ie</strong>nts of Deserted Wife’s Benefit, Deserted Wife’s Allowanceand One-Parent Family Payment, 2000 to <strong>2009</strong>YearDeserted Wife’sBenefitDeserted Wife’sAllowance (1)One-Parent FamilyPayment (1)2000 12,654 1,613 74,119 88,3862001 12,177 1,612 77,142 90,9312002 11,794 1,582 79,195 92,5712003 11,339 1,523 79,296 92,1582004 10,769 1,456 80,103 92,3282005 10,180 1,382 80,366 91,9282006 9,760 766 83,081 93,6072007 9,395 693 85,084 95,1722008 9,056 617 87,840 97,513<strong>2009</strong> 8,737 550 90,484 99,771(1) See note <strong>on</strong> scheme changes and data comparability in the introducti<strong>on</strong> to this secti<strong>on</strong>TotalTable C8: Number of Recip<strong>ie</strong>nts of Deserted Wife’s Benefit and Deserted Wife’sAllowance by Age, <strong>2009</strong>38Age Deserted Wife’s Benefit Deserted Wife’sAllowanceUnder 25 years 0 025 to 29 years 0 030 to 34 years 1 035 to 39 years 18 040 to 44 years 301 445 to 49 years 1,180 3350 to 54 years 1,863 7455 to 59 years 2,062 15160 to 64 years 1,733 23965 years and over 1,579 49TOTAL 8,737 550Table C9: Number of Recip<strong>ie</strong>nts of One-Parent Family Payment by Status of Parentand Number of Children, <strong>2009</strong>Type of Recip<strong>ie</strong>ntUnmarr<strong>ie</strong>d Parent,Separated Parent,Pris<strong>on</strong>er’s SpouseWidowed Pers<strong>on</strong> Total (1)With 1 child 50,341 432 50,773With 2 children 25,162 236 25,398With 3 children 9,471 119 9,590With 4 children 3,090 49 3,139With 5 children 911 26 937With 6 or more children 369 12 381Total Recip<strong>ie</strong>nts 89,344 874 90,218(1) 266 recip<strong>ie</strong>nts of One-Parent Family Payment were not in receipt of a qualif<strong>ie</strong>d child increase at December <strong>2009</strong>. This is usually because their dependentchild is now claiming a One-Parent Family Payment in their own right<str<strong>on</strong>g>Statistical</str<strong>on</strong>g> <str<strong>on</strong>g>Informati<strong>on</strong></str<strong>on</strong>g> <strong>on</strong> <strong>Social</strong> <strong>Welfare</strong> <strong>Services</strong> <strong>2009</strong>
widows, widowers and<strong>on</strong>e parent famil<strong>ie</strong>sTable C10: Number of Recip<strong>ie</strong>nts of One-Parent Family Payment by Status of Parent,Age and Sex, <strong>2009</strong>Age GroupUnmarr<strong>ie</strong>d Parent,Separated Parent,Pris<strong>on</strong>er’s SpouseWidowed Pers<strong>on</strong>TotalMale Female Male Female Male FemaleUnder 20 years 2 1,520 0 0 2 1,52020 to 24 years 26 12,594 0 3 26 12,59725 to 29 years 95 18,984 2 32 97 19,01630 to 34 years 166 17,320 6 66 172 17,38635 to 39 years 319 15,359 11 145 330 15,50440 to 44 years 466 11,261 30 139 496 11,40045 to 49 years 341 6,758 31 163 372 6,92150 to 54 years 239 2,870 31 125 270 2,99555 to 59 years 116 884 30 97 146 98160 to 64 years 38 141 12 50 50 19165 years and over 3 4 0 5 3 9Total 1,811 87,695 153 825 1,964 88,520Overall Total 89,506 978 90,48439Table C11: Number of Recip<strong>ie</strong>nts of Widow/er’s (C<strong>on</strong>tributory) Pensi<strong>on</strong> and DesertedWife’s Benefit in receipt of Living Al<strong>on</strong>e Allowance, Over 80 Allowance and IslandAllowance, <strong>2009</strong>Pensi<strong>on</strong> TypeLiving Al<strong>on</strong>eAllowanceOver 80 AllowanceIsland AllowanceWidow/er’s (C<strong>on</strong>tributory) Pensi<strong>on</strong> 47,042 32,819 53Deserted Wife’s Benefit 656 116 0Total 47,698 32,935 53<str<strong>on</strong>g>Statistical</str<strong>on</strong>g> <str<strong>on</strong>g>Informati<strong>on</strong></str<strong>on</strong>g> <strong>on</strong> <strong>Social</strong> <strong>Welfare</strong> <strong>Services</strong> <strong>2009</strong>
widows, widowers and<strong>on</strong>e parent famil<strong>ie</strong>sTable C12: Number of Recip<strong>ie</strong>nts of Widow’s, Widower’s and One-Parent Family Payments byPayment Type and County, <strong>2009</strong>40CountyWidow/er’s(C<strong>on</strong>tributary)Pensi<strong>on</strong>Widow/er’s(N<strong>on</strong>-C<strong>on</strong>tributary)Pensi<strong>on</strong>One-ParentFamilyPaymentDesertedWife’s BenefitDesertedWife’sAllowanceCarlow 1,307 34 1,356 104 9Cavan 1,512 45 1,142 72 6Clare 2,547 56 1,769 160 15Cork 12,737 169 9,195 830 60D<strong>on</strong>egal 3,270 181 3,830 175 24Dublin 29,735 318 29,824 3,560 186Galway 4,852 146 3,397 251 32Kerry 3,454 123 2,617 199 17Kildare 3,841 49 3,640 334 9Kilkenny 2,007 35 1,379 130 13Laois 1,553 33 1,095 78 1Leitrim 960 19 389 37 5Limerick 4,913 83 3,871 374 19L<strong>on</strong>gford 987 25 930 78 3Louth 2,896 45 3,057 363 12Mayo 3,340 142 2,026 129 17Meath 3,247 48 2,447 281 24M<strong>on</strong>aghan 1,310 46 997 76 11Offaly 1,772 29 1,352 98 5Roscomm<strong>on</strong> 1,454 40 800 61 5Sligo 1,664 45 1,090 129 4Tipperary 4,305 81 3,131 227 13Waterford 2,996 45 2,992 240 10Westmeath 2,169 37 1,627 158 9Wexford 3,457 83 3,593 267 20Wicklow 3,000 41 2,930 326 21Others 7,823 0 8 0 0Total 113,108 1,998 90,484 8,737 550<str<strong>on</strong>g>Statistical</str<strong>on</strong>g> <str<strong>on</strong>g>Informati<strong>on</strong></str<strong>on</strong>g> <strong>on</strong> <strong>Social</strong> <strong>Welfare</strong> <strong>Services</strong> <strong>2009</strong>
Secti<strong>on</strong> DChild Related Payments
child related paymentsSecti<strong>on</strong> D: Child Related PaymentsExpenditure and Recip<strong>ie</strong>ntsThis secti<strong>on</strong> relates to payments made in respect of children such as Child Benefit, Guardian’s Payments andMaternity related payments. For ease of reference, this secti<strong>on</strong> also gives details of increases in respect ofqualif<strong>ie</strong>d children which are payable with social welfare payments (See Table D10). It should be noted, however,that for the purpose of apporti<strong>on</strong>ing expenditure between programmes, the cost of qualif<strong>ie</strong>d child increases isincluded with the main payment e.g. Qualif<strong>ie</strong>d Child increases paid with State Pensi<strong>on</strong>s are included in the ‘OlderPeople’ programme.Expenditure <strong>on</strong> payments in this programme group rose by 3.0% in <strong>2009</strong>. The breakdown of Child Benefit byfamily size shows that 76.2% of recip<strong>ie</strong>nt famil<strong>ie</strong>s in <strong>2009</strong> have either <strong>on</strong>e or two children. The equivalentpercentage for 2000 was 73.4%. See Table D8 and Graph D1. The number of famil<strong>ie</strong>s receiving Child Benefit roseby 6,824 to 602,932 . The total number of children in respect of whom Child Benefit is paid increased by 14,979to 1,156,917.Expenditure <strong>on</strong> Child Benefit increased by over €41 milli<strong>on</strong> in <strong>2009</strong>, an increase of 1.7% while Maternity Benefitexpenditure increased by over €15 milli<strong>on</strong>, an increase of 4.9%.42Notes: Scheme Changes and Comparability of Year-<strong>on</strong>-Year DataIncreases in the maximum durati<strong>on</strong> and maximum payment of Maternity Benefit, in additi<strong>on</strong> to the increases inthe female populati<strong>on</strong> and the nati<strong>on</strong>al birthrate, have resulted in a significant increase in expenditure <strong>on</strong> thescheme. In March 2006 the maximum durati<strong>on</strong> of Maternity Benefit, Adoptive Benefit and Health and SafetyBenefit claims was increased from 18 to 22 weeks, with a subsequent extensi<strong>on</strong> of Maternity Benefit in March2007 to 26 weeks.A side-effect of these changes is the erosi<strong>on</strong> of data comparability between 2006 and subsequent years in relati<strong>on</strong>to recip<strong>ie</strong>nts and expenditure <strong>on</strong> the affected schemes.
child related paymentsGraph D1: Number of Famil<strong>ie</strong>s Receiving Child Benefit by number of ChildBeneficiar<strong>ie</strong>s, 2000 to <strong>2009</strong>700,000600,000500,000400,000300,000200,000100,00002000 2001 2002 2003 2004 2005 2006 2007 2008 <strong>2009</strong>1 Child 2 Children 3 Children 4 Children 5 Children or moreTable D1: Expenditure <strong>on</strong> Child Related Payments by Payment Type, 2008 and <strong>2009</strong>Payment Type 2008 <strong>2009</strong> (1) Change <strong>2009</strong> over 2008€000 €000SOCIAL INSURANCEMaternity Benefit (2) 315,878 331,319 4.9%Adoptive Benefit (2) 1,644 1,247 -24.1%Health and Safety Benefit (2) 576 619 7.5%Guardian’s Payment (C<strong>on</strong>tributory) 14,373 11,509 -19.9%SOCIAL ASSISTANCEGuardian’s Payment (N<strong>on</strong>-C<strong>on</strong>tributory) 7,147 6,024 -15.7%Domiciliary Care Allowance (3) - 31,017 n/aOTHERChild Benefit 2,453,957 2,495,304 1.7%TOTAL 2,793,575 2,877,039 3.0%(1) Provisi<strong>on</strong>al(2) See note <strong>on</strong> scheme changes and comparability of data in the introducti<strong>on</strong> to this secti<strong>on</strong>(3) Resp<strong>on</strong>sibility for Domiciliary care allowance transferred to the Department of <strong>Social</strong> Protecti<strong>on</strong> in <strong>2009</strong>.43Table D2: Expenditure <strong>on</strong> Child Benefit, 2000 to <strong>2009</strong>YearExpenditure€0002000 637,5432001 964,8472002 1,462,7932003 1,666,5302004 1,765,1172005 1,899,9362006 2,056,9252007 2,232,9742008 2,453,957<strong>2009</strong> (1) 2,495,304(1) Provisi<strong>on</strong>al<str<strong>on</strong>g>Statistical</str<strong>on</strong>g> <str<strong>on</strong>g>Informati<strong>on</strong></str<strong>on</strong>g> <strong>on</strong> <strong>Social</strong> <strong>Welfare</strong> <strong>Services</strong> <strong>2009</strong>
child related paymentsTable D3: Expenditure <strong>on</strong> Guardian’s Payment (C<strong>on</strong>tributory) and Guardian’s Payment(N<strong>on</strong>-C<strong>on</strong>tributory), 2000 to <strong>2009</strong>Year Guardian’s Payment (C<strong>on</strong>tributory) Guardian’s Payment (N<strong>on</strong>-C<strong>on</strong>tributory)€000 €0002000 5,617 2,8962001 9,447 4,4212002 11,694 4,4942003 8,895 5,8052004 9,659 6,2232005 7,516 4,0962006 8,815 4,8322007 9,560 4,3662008 14,373 7,147<strong>2009</strong> (1) 11,509 6,024(1) Provisi<strong>on</strong>alTable D4: Expenditure <strong>on</strong> Maternity, Adoptive and Health & Safety Benefits, 2000 to <strong>2009</strong>44Year Maternity Benefit (1) Adoptive Benefit (1) Health & SafetyBenefit (1)€000 €000 €0002000 58,041 185 1712001 78,933 260 2102002 99,129 578 2172003 107,336 532 2132004 121,571 609 1432005 132,412 709 2932006 180,801 818 3532007 257,896 1,333 5032008 315,878 1,644 576<strong>2009</strong> (2) 331,319 1,247 619(1) See note <strong>on</strong> scheme changes and comparability of data in the introducti<strong>on</strong> to this secti<strong>on</strong>(2) Provisi<strong>on</strong>al.Table D5: Number of Recip<strong>ie</strong>nts of Guardian’s Payment, 2008 and <strong>2009</strong>Payment 2008 <strong>2009</strong> Change <strong>2009</strong> over 2008Guardian’s Payment (C<strong>on</strong>tributory) 833 860 3.2%Guardian’s Payment (N<strong>on</strong>-C<strong>on</strong>tributory) 437 420 -3.9%Total 1,270 1,280 0.8%<str<strong>on</strong>g>Statistical</str<strong>on</strong>g> <str<strong>on</strong>g>Informati<strong>on</strong></str<strong>on</strong>g> <strong>on</strong> <strong>Social</strong> <strong>Welfare</strong> <strong>Services</strong> <strong>2009</strong>
child related paymentsTable D6: Number of Recip<strong>ie</strong>nts of Maternity Benefit, Health and Safety Benefit andAdoptive Benefit, 2008 and <strong>2009</strong>Payment 2008 <strong>2009</strong> Change <strong>2009</strong> over 2008Recip<strong>ie</strong>nts at 31st December:Maternity Benefit 23,421 23,294 -0.5%Health and Safety Benefit 69 49 -29.0%Adoptive Benefit 68 64 -5.9%Awards during the year:Maternity Benefit 48,037 48,367 0.7%Health and Safety Benefit 289 251 -13.1%Adoptive Benefit 281 203 -27.8%Table D7: Number of Famil<strong>ie</strong>s and Child Beneficiar<strong>ie</strong>s of Child Benefit, 2000 to <strong>2009</strong>Year Famil<strong>ie</strong>s Children2000 510,840 1,018,1752001 514,919 1,014,3402002 522,441 1,019,5512003 534,009 1,034,8512004 540,911 1,051,0052005 547,540 1,060,7402006 562,860 1,083,9802007 579,612 1,110,7152008 596,108 1,141,938<strong>2009</strong> 602,932 1,156,917Table D8: Number of Famil<strong>ie</strong>s Receiving Child Benefit by Number of ChildBeneficiar<strong>ie</strong>s, 2000 to <strong>2009</strong>452000 2001 2002 2003 2004 2005 2006 2007 2008 <strong>2009</strong>Numberof EligibleChildrenin Family1 203,342 208,712 214,916 221,515 221,837 224,686 232,974 241,138 247,345 248,5412 171,646 173,525 176,284 181,018 185,282 188,536 194,250 200,949 207,816 211,1673 90,667 89,564 89,397 90,512 92,379 93,516 94,960 96,956 99,550 101,4544 32,431 31,225 30,552 29,996 30,542 30,258 30,329 30,385 31,069 31,5085 8,795 8,257 7,884 7,732 7,619 7,417 7,266 7,234 7,368 7,3416 2,628 2,450 2,275 2,161 2,175 2,130 2,094 2,022 2,017 1,9887 869 742 712 669 679 630 649 615 617 6098 294 287 267 264 258 242 230 207 213 2219 89 94 95 88 91 79 61 68 74 6410 48 39 36 34 28 34 38 26 29 2711 20 16 15 15 16 6 5 8 8 812 7 6 7 4 4 4 3 4 2 213 3 1 0 0 0 2 1 0 0 214 1 1 1 1 1 0 0 0 0 0Total 510,840 514,919 522,441 534,009 540,911 547,540 562,860 579,612 596,108 602,932Number of 1,018,175 1,014,340 1,019,551 1,034,851 1,051,005 1,060,740 1,083,980 1,110,715 1,141,938 1,156,917Childrenin Respectof whomBenefit ispaid<str<strong>on</strong>g>Statistical</str<strong>on</strong>g> <str<strong>on</strong>g>Informati<strong>on</strong></str<strong>on</strong>g> <strong>on</strong> <strong>Social</strong> <strong>Welfare</strong> <strong>Services</strong> <strong>2009</strong>
child related payments46Table D9: Number of Child Beneficiar<strong>ie</strong>s of Child Benefit by Age, 2000 to <strong>2009</strong>2000 2001 2002 (2) 2003 2004 2005 2006 2007 2008 <strong>2009</strong>Age(in years)Under 1 (1) 46,094 45,691 32,832 41,383 53,401 51,033 58,551 59,123 64,205 62,5251 under 2 54,032 54,931 59,235 59,980 60,096 61,337 62,207 65,990 71,256 72,6382 under 3 55,066 55,214 57,341 58,764 60,421 61,457 63,085 63,684 66,764 70,4983 under 4 54,521 56,131 57,749 56,753 58,989 61,451 62,906 65,175 64,472 66,3944 under 5 52,435 55,473 58,520 57,013 56,915 59,922 62,211 64,296 65,689 64,1175 under 6 51,569 53,276 57,870 57,741 57,197 57,850 60,795 63,914 64,740 65,2496 under 7 50,827 52,279 55,888 56,967 57,857 58,234 58,862 62,326 64,191 64,3907 under 8 52,261 51,447 54,231 54,979 57,094 58,760 59,007 60,129 62,692 63,8088 under 9 54,195 52,815 53,711 53,345 55,116 57,816 59,517 60,137 60,608 62,6909 under 10 55,573 54,738 54,536 52,771 53,488 55,852 58,470 60,456 60,627 60,43110 under 11 56,584 56,074 56,618 53,548 52,977 54,218 56,036 59,470 61,063 60,59811 under 12 54,937 57,015 58,024 55,471 53,698 53,693 54,984 57,488 60,013 61,11412 under 13 57,220 55,383 59,011 56,871 55,401 54,317 53,960 55,757 58,120 60,22413 under 14 59,529 57,522 57,578 57,811 56,940 56,069 55,109 54,993 56,384 57,93614 under 15 61,396 59,815 59,281 56,343 57,891 57,566 56,804 55,588 55,563 56,41015 under 16 60,940 60,652 61,772 57,887 56,398 58,514 58,136 57,365 55,938 55,47616 under 17 50,772 49,485 50,534 53,084 53,582 50,958 54,920 52,574 53,175 52,84417 under 18 52,398 50,488 48,016 52,184 52,145 50,563 49,703 52,619 53,135 53,01018 under 19 37,826 35,911 26,804 41,956 41,399 41,130 38,717 39,631 43,303 46,565Total 1,018,175 1,014,340 1,019,551 1,034,851 1,051,005 1,060,740 1,083,980 1,110,715 1,141,938 1,156,917(1) Underestimates the number eligible because of the time lag in applying for benefit.(2) 2002 numbers understated because of processing delays which were rectif<strong>ie</strong>d in the early m<strong>on</strong>ths of 2003.<str<strong>on</strong>g>Statistical</str<strong>on</strong>g> <str<strong>on</strong>g>Informati<strong>on</strong></str<strong>on</strong>g> <strong>on</strong> <strong>Social</strong> <strong>Welfare</strong> <strong>Services</strong> <strong>2009</strong>
child related paymentsTable D10: Number of Qualif<strong>ie</strong>d Child Increases by Payment Type, <strong>2009</strong>Total Children Total Famil<strong>ie</strong>swith Children6+ Qualif<strong>ie</strong>dChildren5 Qualif<strong>ie</strong>dChildren4 Qualif<strong>ie</strong>dChildren3 Qualif<strong>ie</strong>dChildren2 Qualif<strong>ie</strong>dChildrenPayment 1 Qualif<strong>ie</strong>dChildFull Rate HalfRateFull Rate HalfRateHalfRateFullRateHalfRateFullRateHalfRateFullRateHalfRateFullRateHalfRateFullRateHalfRateFullRateState Pensi<strong>on</strong> (C<strong>on</strong>tributory) 914 731 164 200 40 46 11 2 4 2 2 0 1,438 1,287 1,135 981State Pensi<strong>on</strong> (Transiti<strong>on</strong>) 69 71 10 18 4 2 3 1 0 0 0 0 113 117 86 92State Pensi<strong>on</strong> (N<strong>on</strong>-C<strong>on</strong>tributory) 245 62 64 19 20 3 9 2 1 1 0 0 474 122 339 87Pre-Retirement Allowance 247 56 67 17 18 2 9 1 2 2 1 1 488 117 344 79Widow/er’s (C<strong>on</strong>tributory) Pensi<strong>on</strong> 3,998 0 2,072 0 840 0 239 0 47 0 21 0 11,998 0 7,217 0Deserted Wife’s Benefit 941 0 284 0 65 0 8 0 5 0 4 0 1,786 0 1,307 0One-Parent Family Payment (1)(2) 50,773 0 25,398 0 9,590 0 3,139 0 937 0 381 0 150,024 3 90,218 0Health and Safety Benefit 1 2 2 1 0 0 0 0 0 0 0 0 3 4 3 3Illness Benefit 2,391 3,816 1,757 3,626 788 1,570 323 461 94 87 40 20 10,293 18,189 5,393 9,580Invalidity Pensi<strong>on</strong> 1,631 3,160 732 2,080 315 800 93 218 35 50 18 16 4,678 10,949 2,824 6,324Injury Benefit 30 21 28 15 15 6 3 0 1 1 1 0 154 74 78 43Interim Illness Benefit 13 3 14 8 6 5 2 1 1 0 0 0 72 38 36 17Disablement Pensi<strong>on</strong> 43 78 72 240 117 198 32 160 25 25 0 0 289 701 289 701Death Benefit Pensi<strong>on</strong> 54 0 20 0 10 0 0 0 0 0 0 0 124 0 84 0Disability Allowance 3,992 1,433 2,361 1,028 1,208 552 590 251 263 125 204 91 17,386 7,374 8,618 3,480Carer’s Benefit 21 324 12 414 4 234 2 64 0 9 0 3 65 2,173 39 1,048Blind Pensi<strong>on</strong> 50 25 29 18 24 17 7 4 3 1 1 0 232 133 114 65Carer’s Allowance 478 5,262 436 4,000 249 2,607 105 1,177 43 366 37 588 2,985 31,684 1,348 14,000Jobseeker’s Benefit 5,773 5,716 5,247 4,634 2,509 1,754 806 423 168 59 66 23 28,280 22,376 14,569 12,609Jobseeker’s Allowance 11,949 4,269 11,314 3,488 6,595 1,718 2,826 676 1,005 215 597 94 74,661 20,793 34,286 10,460Farm Assist 787 217 729 204 561 151 293 67 115 27 61 9 6,074 1,541 2,546 675Back to Work Allowance 348 74 206 42 96 34 34 18 7 3 6 0 1,255 347 697 171Enterprise Allowance 441 148 531 199 364 76 147 42 48 11 13 3 3,501 1,015 1,544 479Back to Educati<strong>on</strong> Allowance 487 349 493 376 320 202 145 72 43 12 17 9 3,341 2,112 1,505 1,020Supplementary <strong>Welfare</strong> Allowance (3) 5,296 0 3,879 0 2,023 0 864 0 348 0 168 0 25,434 0 12,578 0TOTAL 90,972 25,817 55,921 20,627 25,781 9,977 9,690 3,640 3,195 996 1,638 857 345,148 121,149 187,197 61,914(1) 266 l<strong>on</strong>e parents were not claiming a child increase at December <strong>2009</strong>. This is usually because their dependent child is now claiming a l<strong>on</strong>e parents allowance in their own right and they areremoved from their parent’s claim.(2) A breakdown between full and half-rate children is not available for One-Parent Family Payment(3) Includes Direct Provisi<strong>on</strong> Allowance47<str<strong>on</strong>g>Statistical</str<strong>on</strong>g> <str<strong>on</strong>g>Informati<strong>on</strong></str<strong>on</strong>g> <strong>on</strong> <strong>Social</strong> <strong>Welfare</strong> <strong>Services</strong> <strong>2009</strong>
child related paymentsTable D11: Number of Recip<strong>ie</strong>nts of Guardian’s Payment, Child Benefit, MaternityBenefit and Health & Safety Benefit by County, <strong>2009</strong>48CountyGuardian’sPayment(C<strong>on</strong>tributory)Guardian’sPayment(N<strong>on</strong>-C<strong>on</strong>tributory)ChildBenefitRecip<strong>ie</strong>ntsChildBenefitChildrenMaternityBenefitHealth& SafetyBenefitCarlow 5 4 8,570 16,239 278 1Cavan 9 5 9,805 19,888 361 2Clare 14 6 15,620 31,091 569 1Cork 62 25 68,084 131,083 2,704 3D<strong>on</strong>egal 21 12 20,841 41,942 656 1Dublin 404 177 155,279 286,201 6,554 15Galway 24 18 30,943 61,437 1,212 4Kerry 28 18 18,517 35,696 643 0Kildare 28 15 30,857 59,210 1,228 1Kilkenny 14 8 11,769 23,001 557 1Laois 7 8 10,042 19,882 415 0Leitrim 4 3 4,168 8,348 164 0Limerick 30 23 25,670 48,391 887 1L<strong>on</strong>gford 3 0 5,463 11,098 164 1Louth 13 8 18,053 34,339 619 2Mayo 17 7 16,232 33,086 550 4Meath 26 9 26,593 51,737 1,121 2M<strong>on</strong>aghan 5 1 7,863 15,718 303 1Offaly 18 5 10,449 20,471 346 1Roscomm<strong>on</strong> 8 3 7,604 15,187 301 1Sligo 11 5 8,114 15,890 300 1Tipperary 21 18 21,886 42,263 796 2Waterford 27 11 16,215 30,682 585 0Westmeath 15 10 12,260 24,055 430 1Wexford 27 12 20,999 40,220 656 1Wicklow 19 9 19,980 37,584 746 0Others 0 0 1,056 2,178 149 2Total 860 420 602,932 1,156,917 23,294 49<str<strong>on</strong>g>Statistical</str<strong>on</strong>g> <str<strong>on</strong>g>Informati<strong>on</strong></str<strong>on</strong>g> <strong>on</strong> <strong>Social</strong> <strong>Welfare</strong> <strong>Services</strong> <strong>2009</strong>
Secti<strong>on</strong> EIllness, Disability and Caring
illness, disability and caringSecti<strong>on</strong> E : Illness, Disability and CaringExpenditure and Recip<strong>ie</strong>ntsExpenditure <strong>on</strong> Illness Benefit increased by 7.9% and Invalidity Pensi<strong>on</strong> decreased by 0.6%. Expenditure <strong>on</strong> DisabilityAllowance increased by 8.6% to over €1.14 billi<strong>on</strong>. There are now 99,576 recip<strong>ie</strong>nts of the scheme.Expenditure <strong>on</strong> Carer’s Allowance increased by over €52 milli<strong>on</strong> in <strong>2009</strong>, an increase of 11.6%.There are now 48,223recip<strong>ie</strong>nts of the Scheme, an increase of 4,654 year <strong>on</strong> year.Graph E1 and Table E4 show details of the numbers of Carer’s Allowance recip<strong>ie</strong>nts from 2000 to <strong>2009</strong>.Carer’s Benefit is a payment made to insured pers<strong>on</strong>s who leave the workforce to care for a pers<strong>on</strong>(s) who require full timecare and attenti<strong>on</strong>. The number of recip<strong>ie</strong>nts decreased by 332 to 1,917 in <strong>2009</strong>.Notes: Scheme Changes50Recip<strong>ie</strong>nts of Blind Pensi<strong>on</strong> have since 2006 been transferred to State Pensi<strong>on</strong> (N<strong>on</strong>-C<strong>on</strong>tributory) up<strong>on</strong> reaching 66 yearsof age, resulting in decreases in recip<strong>ie</strong>nts and expenditure <strong>on</strong> the scheme. Recip<strong>ie</strong>nts of Invalidity Pensi<strong>on</strong> have beentransferred to State Pensi<strong>on</strong> (C<strong>on</strong>tributory) up<strong>on</strong> reaching 66 years of age, this change also having been introduced in 2006.A side-effect of these changes is the erosi<strong>on</strong> of data comparability between 2006 and subsequent years in relati<strong>on</strong> torecip<strong>ie</strong>nts and expenditure <strong>on</strong> the affected schemes.From September 2007 a pers<strong>on</strong> may receive half-rate Carer’s Allowance while in receipt of another social welfare payment.This may result in some double counting.There were 19,132 recip<strong>ie</strong>nts of a half-rate Carer’s Allowance at the end of <strong>2009</strong>Graph E1: Number of Recip<strong>ie</strong>nts of Carer’s Allowance by Sex, 2000 to <strong>2009</strong>60,00050,00040,00030,00020,00010,00002000 2001 2002 2003 2004 2005 2006 2007 2008 <strong>2009</strong>Males Females Total
illness, disability and caringTable E1: Expenditure <strong>on</strong> Illness, Disability and Caring by Payment Type, 2008 and <strong>2009</strong>Type of Payment 2008 <strong>2009</strong> (1) Change <strong>2009</strong> over 2008€000 €000SOCIAL INSURANCEIllness Benefit 852,305 919,640 7.9%Invalidity Pensi<strong>on</strong> 685,717 681,641 -0.6%Carer’s Benefit 33,666 30,204 -10.3%SOCIAL ASSISTANCEDisability Allowance 1,052,660 1,142,769 8.6%Blind Pensi<strong>on</strong> 16,319 16,277 -0.3%Carer’s Allowance 450,260 502,469 11.6%Respite Care Grant 98,204 99,200 1.0%OCCUPATIONAL INJURIESBENEFITSInjury Benefit 19,250 20,974 9.0%Disablement Benefit 84,443 85,652 1.4%Death Benefit 8,036 5,374 -33.1%Medical Care 282 309 9.6%TOTAL 3,301,142 3,504,509 6.2%(1) Provisi<strong>on</strong>alTable E2: Expenditure <strong>on</strong> Illness, Disability and Caring by Payment Type, 2000 to <strong>2009</strong>51YearIllnessBenefitOccupati<strong>on</strong>alInjur<strong>ie</strong>sInvalidityPensi<strong>on</strong>(1)Carer’sBenefit (2)BlindPensi<strong>on</strong> (1)DisabilityAllowanceCarer’sAllowanceRespiteCareGrant (4)€000 €000 €000 €000 €000 €000 €000 €000 €0002000 280,828 65,353 311,511 36 12,302 279,176 99,561 0 1,048,7672001 329,897 70,496 354,459 2,457 13,156 332,308 130,325 0 1,233,0982002 385,297 77,018 403,617 5,807 14,221 407,585 160,042 0 1,453,5872003 433,455 78,757 440,263 6,943 14,816 463,608 183,273 0 1,621,1152004 479,611 82,657 487,375 7,698 15,868 544,489 210,277 0 1,827,9752005 540,245 88,057 548,285 9,588 16,661 630,728 223,059 34,302 2,090,9252006 627,642 95,988 602,414 16,688 16,964 738,431 284,584 50,458 2,433,1692007 755,077 104,349 618,133 26,900 15,031 901,131 361,257 73,376 2,855,2542008 852,305 112,014 685,717 33,666 16,319 1,052,660 450,260 98,204 3,301,145<strong>2009</strong> (3) 919,640 112,309 681,641 30,204 16,277 1,142,769 502,469 99,200 3,504,509(1) See note <strong>on</strong> scheme changes in the introducti<strong>on</strong> to this secti<strong>on</strong>(2) Carer’s Benefit was introduced in October, 2000.(3) Provisi<strong>on</strong>al(4) Respite Care Grant was introduced in June 2005.Total<str<strong>on</strong>g>Statistical</str<strong>on</strong>g> <str<strong>on</strong>g>Informati<strong>on</strong></str<strong>on</strong>g> <strong>on</strong> <strong>Social</strong> <strong>Welfare</strong> <strong>Services</strong> <strong>2009</strong>
illness, disability and caringTable E3: Number of Recip<strong>ie</strong>nts of Illness, Disability and Caring Payments by PaymentType, 2008 and <strong>2009</strong>Type of Payment 2008 <strong>2009</strong> Change <strong>2009</strong> over 2008Illness Benefit 73,609 77,665 5.5%Invalidity Pensi<strong>on</strong> 53,725 52,922 -1.5%Interim Illness Benefit 525 318 -39.4%Carer’s Benefit 2,249 1,917 -14.8%Disability Allowance 95,754 99,576 4.0%Carer’s Allowance (1) 43,569 48,223 10.7%Blind Pensi<strong>on</strong> 1,472 1,467 -0.3%Injury Benefit 846 726 -14.2%Death Benefit Pensi<strong>on</strong> 651 637 -2.2%Disablement Pensi<strong>on</strong> (2) (3) (4) 13,192 13,520 2.5%TOTAL 285,592 296,971 4.0%(1) There were 5 people in receipt of Prescribed Relatives Allowance at the end of December <strong>2009</strong>. Prescribed Relatives Allowance was replaced by Carer’s Allowancein 1990.(2) Disablement Pensi<strong>on</strong> is paid where a pers<strong>on</strong> suffers loss of physical or mental faculty as a result of an accident at work or c<strong>on</strong>tracting an occupati<strong>on</strong>al disease.It differs fundamentally from other <strong>Social</strong> <strong>Welfare</strong> income support payments in that it is a compensatory payment, rather than an income maintenancepayment. Accordingly Disablement Pensi<strong>on</strong> can be paid in additi<strong>on</strong> to other <strong>Social</strong> <strong>Welfare</strong> payments such as Illness Benefit and Invalidity Pensi<strong>on</strong> and canalso be paid where a pers<strong>on</strong> c<strong>on</strong>tinues to work.(3) Incapacity Supplement is paid as an increase to Disablement Benefit where a pers<strong>on</strong> is permanently incapable of work and does not qualify for any other<strong>Social</strong> <strong>Welfare</strong> payment. 907 pers<strong>on</strong>s were in receipt of an Incapacity Supplement payment at the end of <strong>2009</strong>.(4) C<strong>on</strong>stant Attendance Allowance is paid as an increase to Disablement Pensi<strong>on</strong> where the degree of disablement is assessed at between 50% and 100% and thepers<strong>on</strong> has been certif<strong>ie</strong>d as being in need of c<strong>on</strong>stant care and attenti<strong>on</strong>. 86 pers<strong>on</strong>s were in receipt of C<strong>on</strong>stant Attendance Allowance at end of <strong>2009</strong>.52Table E4: Number of Recip<strong>ie</strong>nts of Illness, Disability and Caring Payments, 2000 to <strong>2009</strong>YearIllnessBenefitInvalidityPensi<strong>on</strong> (1)InterimIllnessBenefitCarer’sBenefitDisabilityAllowanceCarer’sAllowanceBlindPensi<strong>on</strong> (1)InjuryBenefitDeathBenefitPensi<strong>on</strong>DisablementPensi<strong>on</strong> (2)2000 46,940 48,663 488 50 54,303 16,478 2,229 828 665 10,9252001 50,715 50,615 449 425 57,655 18,785 2,125 861 676 11,2302002 54,590 52,147 404 615 62,783 20,395 2,095 828 668 11,6122003 57,464 53,414 295 639 67,720 21,316 2,061 821 664 11,8982004 58,726 55,864 316 679 72,976 23,030 2,027 915 652 12,1622005 61,845 58,352 355 867 79,253 24,970 1,985 908 647 12,4752006 65,774 51,954 338 1,647 83,697 27,474 1,476 924 646 12,6462007 70,404 53,956 440 2,080 89,048 33,067 1,474 900 647 12,8742008 73,609 53,725 525 2,249 95,754 43,569 1,472 846 651 13,192<strong>2009</strong> 77,665 52,922 318 1,917 99,576 48,223 1,467 726 637 13,520(1) See note <strong>on</strong> scheme changes in the introducti<strong>on</strong> to this secti<strong>on</strong>.(2) Disablement pensi<strong>on</strong> is paid where a pers<strong>on</strong> suffers loss of physical or mental faculty as a result of an accident at work or c<strong>on</strong>tracting an occupati<strong>on</strong>al disease.It differs fundamentally from other social welfare income support payments in that it is a compensatory payment, rather than an income maintenance payment.Accordingly Disablement Pensi<strong>on</strong> can be paid in additi<strong>on</strong> to other <strong>Social</strong> <strong>Welfare</strong> payments such as illness benefit and invalidity pensi<strong>on</strong> and can also be paid wherea pers<strong>on</strong> c<strong>on</strong>tinues to work.<str<strong>on</strong>g>Statistical</str<strong>on</strong>g> <str<strong>on</strong>g>Informati<strong>on</strong></str<strong>on</strong>g> <strong>on</strong> <strong>Social</strong> <strong>Welfare</strong> <strong>Services</strong> <strong>2009</strong>
illness, disability and caringTable E5: Number of Living Al<strong>on</strong>e and Over 80 Allowances by Payment Type, <strong>2009</strong>Payment Type Over 80 Allowance Living Al<strong>on</strong>e AllowanceInvalidity Pensi<strong>on</strong> (1) 0 9,279Death Benefit Pensi<strong>on</strong> 113 214Blind Pensi<strong>on</strong> (1) 0 272Total 113 9,765(1) See note <strong>on</strong> scheme changes in the introducti<strong>on</strong> to this secti<strong>on</strong>Table E6: Number of Recip<strong>ie</strong>nts of Illness Benefit by Age and Sex, <strong>2009</strong>Age Male Female TotalUnder 25 years 762 837 1,59925 to 29 Years 1,517 2,788 4,30530 to 34 years 2,045 4,879 6,92435 to 39 years 2,559 6,565 9,12440 to 44 years 2,736 6,348 9,08445 to 49 years 3,430 6,142 9,57250 to 54 years 4,209 6,510 10,71955 to 59 years 5,824 6,802 12,62660 to 64 years 7,018 5,866 12,88465 years and over 414 414 828Total 30,514 47,151 77,66553Table E7: Number of Recip<strong>ie</strong>nts of Invalidity Pensi<strong>on</strong> by Age and Sex, <strong>2009</strong>Age Male Female TotalUnder 25 years 3 2 525 to 29 years 36 42 7830 to 34 years 153 247 40035 to 39 years 423 775 1,19840 to 44 years 857 1,670 2,52745 to 49 years 1,868 3,289 5,15750 to 54 years 3,400 4,551 7,95155 to 59 years 5,881 6,328 12,20960 to 65 years 12,802 10,595 23,397TOTAL 25,423 27,499 52,922<str<strong>on</strong>g>Statistical</str<strong>on</strong>g> <str<strong>on</strong>g>Informati<strong>on</strong></str<strong>on</strong>g> <strong>on</strong> <strong>Social</strong> <strong>Welfare</strong> <strong>Services</strong> <strong>2009</strong>
illness, disability and caringTable E8: Number of Recip<strong>ie</strong>nts of Carer’s Allowance, Carer’s Benefit and Respite CareGrant by Age and Sex, <strong>2009</strong>Age Carer's Allowance Carer's Benefit Respite Care GrantMale Female Total Male Female Total Male Female TotalUnder 25 years 136 573 709 2 13 15 13 2 1525 to 29 years 195 1,453 1,648 8 60 68 3 3 630 to 34 years 367 2,683 3,050 25 185 210 37 3 4035 to 39 years 673 4,435 5,108 41 309 350 113 8 12140 to 44 years 1,059 5,186 6,245 57 281 338 246 27 27345 to 49 years 1,390 5,010 6,400 59 270 329 387 77 46450 to 54 years 1,349 4,327 5,676 49 204 253 607 79 68655 to 59 years 1,279 4,045 5,324 42 159 201 704 102 80660 to 64 years 1,073 3,808 4,881 40 97 137 673 123 79665 to 69 years 931 2,984 3,915 6 9 15 652 182 83470 to 74 years 704 2,148 2,852 0 0 0 597 216 81375 to 79 years 439 1,158 1,597 0 0 0 429 237 66680 years and over 289 529 818 0 0 0 229 194 423Total 9,884 38,339 48,223 329 1,587 1,916 4,690 1,253 5,943Table E9: Number of Recip<strong>ie</strong>nts of Half Rate Carers By Type of Payment, <strong>2009</strong>54Type of Payment <strong>2009</strong>State Pensi<strong>on</strong> (Transiti<strong>on</strong>/ C<strong>on</strong>tributory) 2,715Qualif<strong>ie</strong>d Adult State Pensi<strong>on</strong> (Transiti<strong>on</strong>/C<strong>on</strong>tributory) 1,723State Pensi<strong>on</strong> (N<strong>on</strong>-C<strong>on</strong>tributory) 1,904Qualif<strong>ie</strong>d Adult State Pensi<strong>on</strong> (N<strong>on</strong>-C<strong>on</strong>tributory) 225Widows (C<strong>on</strong>tributory) Pensi<strong>on</strong> 1,062Widows (N<strong>on</strong>-C<strong>on</strong>tributory) Pensi<strong>on</strong> 74Deserted Wife’s Benefit 305Pris<strong>on</strong>ers Wife’s Allowance 1Blind Pensi<strong>on</strong> 15Qualif<strong>ie</strong>d Adult Blind Pensi<strong>on</strong> 21Invalidity Pensi<strong>on</strong> 1,068Qualif<strong>ie</strong>d Adult Invalidity Pensi<strong>on</strong> 976Disability Allowance 1,040Qualif<strong>ie</strong>d Adult Disability Allowance 1,157Illness Benefit 960Qualif<strong>ie</strong>d Adult Illness Benefit 264Injury Benefit 20Qualif<strong>ie</strong>d Adult Injury Benefit 12Incapacity Benefit 3Qualif<strong>ie</strong>d Adult Incapacity Benefit 8Pre - Retirement Allowance 111Qualif<strong>ie</strong>d Adult Pre-Retirement Allowance 27Jobseeker’s Benefit Qualif<strong>ie</strong>d Adult 340Jobseeker’s Allowance Qualif<strong>ie</strong>d Adult 796Farm Assist 94Qualif<strong>ie</strong>d Adult Farm Assist 72Maternity Benefit 47Health & Safety Benefit 2Health & Safety Benefit Qualif<strong>ie</strong>d Adult 3One Parent Family Payment 3,637Back to Work Qualif<strong>ie</strong>d Adult 10Back to Educati<strong>on</strong> 1Others 439Total 19,132<str<strong>on</strong>g>Statistical</str<strong>on</strong>g> <str<strong>on</strong>g>Informati<strong>on</strong></str<strong>on</strong>g> <strong>on</strong> <strong>Social</strong> <strong>Welfare</strong> <strong>Services</strong> <strong>2009</strong>
illness, disability and caringTable E10: Number of Recip<strong>ie</strong>nts of Blind Pensi<strong>on</strong> by Age and Sex, <strong>2009</strong>Age Male Female TotalUnder 25 years 26 24 5025 to 29 years 43 40 8330 to 34 years 52 55 10735 to 39 years 84 79 16340 to 44 years 95 73 16845 to 49 years 118 85 20350 to 54 years 95 89 18455 to 59 years 116 116 23260 to 64 years 119 114 23365 years 23 21 44Total 771 696 1,467Table E11: Number of Recip<strong>ie</strong>nts of Disability Allowance by Age and Sex, <strong>2009</strong>Age Male Female TotalUnder 25 years 7,267 4,824 12,09125 to 29 years 5,023 3,555 8,57830 to 34 years 5,411 3,654 9,06535 to 39 years 6,060 3,794 9,85440 to 44 years 6,448 4,131 10,57945 to 49 years 6,634 4,427 11,06150 to 54 years 6,540 4,658 11,19855 to 59 years 7,132 5,094 12,22660+ years 8,789 6,135 14,924TOTAL 59,304 40,272 99,57655Table E12: Number of Recip<strong>ie</strong>nts of Death Benefit Pensi<strong>on</strong>, Disablement Pensi<strong>on</strong> andIncapacity Supplement by Age and Sex, <strong>2009</strong>Death Benefit Pensi<strong>on</strong> Disablement Pensi<strong>on</strong> Incapacity Supplement (1)Age Male Female Total Male Female Total Male Female TotalUnder 25 years 0 0 0 76 13 89 7 1 825 to 29 years 0 2 2 203 53 256 14 5 1930 to 34 years 0 4 4 391 131 522 25 10 3535 to 39 years 1 10 11 671 260 931 48 29 7740 to 44 years 0 15 15 947 338 1,285 74 34 10845 to 49 years 1 28 29 1,255 409 1,664 83 37 12050 to 54 years 0 43 43 1,498 426 1,924 114 53 16755 to 59 years 1 82 83 1,553 406 1,959 92 38 13060 to 64 years 0 80 80 1,533 361 1,894 91 41 13265 to 69 years 0 93 93 1,128 204 1,332 42 16 5870 to 74 years 1 85 86 722 101 823 18 8 2675 to 79 years 2 77 79 438 60 498 13 5 1880 years and over 0 112 112 285 58 343 6 3 9Total 6 631 637 10,700 2,820 13,520 627 280 907(1) Incapacity Supplement is paid as a supplement to Disablement Pensi<strong>on</strong>.<str<strong>on</strong>g>Statistical</str<strong>on</strong>g> <str<strong>on</strong>g>Informati<strong>on</strong></str<strong>on</strong>g> <strong>on</strong> <strong>Social</strong> <strong>Welfare</strong> <strong>Services</strong> <strong>2009</strong>
illness, disability and caringTable E13: Number of Recip<strong>ie</strong>nts of Injury Benefit and Interim Illness Benefit by Ageand Sex, <strong>2009</strong>Injury Benefit Interim Illness Benefit (1)Age Male Female Total Male Female TotalUnder 25 years 46 17 63 18 9 2725 to 29 years 64 33 97 25 23 4830 to 34 years 69 29 98 23 14 3735 to 39 years 74 27 101 33 18 5140 to 44 years 64 26 90 28 21 4945 to 49 years 50 33 83 23 14 3750 to 54 years 50 30 80 21 12 3355 to 59 years 40 29 69 9 12 2160 to 64 years 29 12 41 5 8 1365 years 1 3 4 1 1 2Total 487 239 726 186 132 318(1) Interim Illness Benefit is payable to Injury Benefit claimants who satisfy the PRSI c<strong>on</strong>diti<strong>on</strong>s for Illness Benefit while the Injury Benefit claim is beingdecided.56Table E14: Number of Recip<strong>ie</strong>nts of Disablement Pensi<strong>on</strong> by Degree of Disablementand by Sex, <strong>2009</strong> (1)Disablement Pensi<strong>on</strong> by Degree of Disablement (2)Number of Recip<strong>ie</strong>ntsMale Female TotalUnder 20% 1,628 531 2,15920% 2,340 843 3,18330% 2,951 776 3,72740% 1,686 366 2,05250% 810 130 94060% 513 80 59370% 264 31 29580% 209 33 24290% 65 7 72100% 234 23 257Total 10,700 2,820 13,520(1) Includes 907 Incapacity Supplement payments and 87 C<strong>on</strong>stant Attendance Allowance payments. These payments are in additi<strong>on</strong> to Disablement Pensi<strong>on</strong>.(2) The rate of Disablement Pensi<strong>on</strong> depends <strong>on</strong> the degree of disablement, which is medically assessed. For assessments of up to 19% disablement, benefitwill be paid as a single Gratuity, and from 20% upwards a pensi<strong>on</strong> is payable. In additi<strong>on</strong> 1,636 Gratuit<strong>ie</strong>s were paid, 411 of these were provisi<strong>on</strong>al and 1,225were life Gratuit<strong>ie</strong>s<str<strong>on</strong>g>Statistical</str<strong>on</strong>g> <str<strong>on</strong>g>Informati<strong>on</strong></str<strong>on</strong>g> <strong>on</strong> <strong>Social</strong> <strong>Welfare</strong> <strong>Services</strong> <strong>2009</strong>
illness, disability and caringTable E15: Number of Recip<strong>ie</strong>nts of Illness, Disability and Caring Payments by Payment Type and Number of Dependants, <strong>2009</strong>TotalCarer’sAllowanceBlindPensi<strong>on</strong>DisabilityAllowanceDeathBenefitPensi<strong>on</strong>DisablementPensi<strong>on</strong>IntermillnessBenefitInjuryBenefitInvalidity Carer’sPensi<strong>on</strong> (1) BenefitNumber of Recip<strong>ie</strong>nts IllnessBenefitPers<strong>on</strong>al rate <strong>on</strong>ly 57,835 37,167 830 571 258 N/A 553 82,810 1,224 32,875 214,123With Qualif<strong>ie</strong>d Adult <strong>on</strong>ly 4,857 6,607 0 34 7 N/A 0 4,768 64 0 16,337With 1 full rate Qualif<strong>ie</strong>d Child 2,391 1,631 21 30 13 43 54 3,992 50 478 8,703With 2 full rate Qualif<strong>ie</strong>d Children 1,757 732 12 28 14 72 20 2,361 29 436 5,461With 3 full rate Qualif<strong>ie</strong>d Children 788 315 4 15 6 117 10 1,208 24 249 2,736With 4 full rate Qualif<strong>ie</strong>d Children 323 93 2 3 2 32 0 590 7 105 1,157With 5 full rate Qualif<strong>ie</strong>d Children 94 35 0 1 1 25 0 263 3 43 465With 6+ full rate Qualif<strong>ie</strong>d Children 40 18 0 1 0 0 0 204 1 37 301With 1 half rate Qualif<strong>ie</strong>d Child 3,816 3,160 324 21 3 78 0 1,433 25 5,262 14,122With 2 half rate Qualif<strong>ie</strong>d Children 3,626 2,080 414 15 8 240 0 1,028 18 4,000 11,429With 3 half rate Qualif<strong>ie</strong>d Children 1,570 800 234 6 5 198 0 552 17 2,607 5,989With 4 half rate Qualif<strong>ie</strong>d Children 461 218 64 0 1 160 0 251 4 1,177 2,336With 5 half rate Qualif<strong>ie</strong>d Children 87 50 9 1 0 25 0 125 1 366 664With 6+ half rate Qualif<strong>ie</strong>d Children 20 16 3 0 0 0 0 91 0 588 718Total number of recip<strong>ie</strong>nts 77,665 52,922 1,917 726 318 990 637 99,676 1,467 48,223 284,541Recip<strong>ie</strong>nts with Qualif<strong>ie</strong>d Childincreases 14,973 9,148 1,087 121 53 990 84 12,098 179 15,348 54,081Percentage of recip<strong>ie</strong>nts withQualif<strong>ie</strong>d Child increases 19.3% 17.3% 56.7% 16.7% 16.7% 100.0% 13.2% 12.1% 12.2% 31.8% 19.0%Total number of Qualif<strong>ie</strong>d Adults 8,271 8,493 0 97 7 0 0 4,768 64 0 21,700Total number of children (1) 28,482 15,627 2,238 228 110 2,708 124 12,098 3,134 34,669 64,749(1) Where each spouse is in receipt of a half rate increase in respect of a qualif<strong>ie</strong>d child, some double counting of the number of qualif<strong>ie</strong>d children may occur.57<str<strong>on</strong>g>Statistical</str<strong>on</strong>g> <str<strong>on</strong>g>Informati<strong>on</strong></str<strong>on</strong>g> <strong>on</strong> <strong>Social</strong> <strong>Welfare</strong> <strong>Services</strong> <strong>2009</strong>
illness, disability and caringTable E16: Number of Disablement Cases Referred to Medical Assessors forAssessment or Reassessment, 2000 to <strong>2009</strong>YearNumber of Pers<strong>on</strong>sCalled for Examinati<strong>on</strong>Number of Pers<strong>on</strong>sExaminedNumber of Pers<strong>on</strong>swho did not Attend forExaminati<strong>on</strong>2000 4,589 3,428 1,1612001 4,311 2,997 1,3142002 3,898 2,709 1,1892003 3,234 2,296 9382004 2,450 1,744 7062005 2,247 1,541 7062006 2,343 1,621 7222007 2,383 1,617 7662008 2,323 1,564 759<strong>2009</strong> 2,755 1,922 833Table E17: Number of Illness Benefit, Invalidity Pensi<strong>on</strong> and Incapacity SupplementCases Referred to Medical Assessors, 2000 to <strong>2009</strong>58YearNumber ofPers<strong>on</strong>s Calledfor Examinati<strong>on</strong>Number of Pers<strong>on</strong>s Examinedand found to beIncapableof WorkCapableof WorkNumber of Pers<strong>on</strong>s who did notattend for Examinati<strong>on</strong>MedicallyCertif<strong>ie</strong>dUnfit to AttendOthers2000 49,860 27,110 9,120 238 13,3922001 46,072 24,468 8,037 207 13,3602002 45,912 25,091 7,342 208 13,2712003 44,307 22,549 8,267 273 13,2182004 40,762 20,944 7,434 208 12,1762005 37,794 19,584 6,188 192 11,8302006 33,970 18,162 5,560 152 10,0962007 37,853 19,735 6,137 224 11,7572008 43,241 23,028 7,616 289 12,308<strong>2009</strong> 49,063 25,254 11,036 272 12,501<str<strong>on</strong>g>Statistical</str<strong>on</strong>g> <str<strong>on</strong>g>Informati<strong>on</strong></str<strong>on</strong>g> <strong>on</strong> <strong>Social</strong> <strong>Welfare</strong> <strong>Services</strong> <strong>2009</strong>
illness, disability and caringTable E18: Number of Disability Allowance Cases Referred to Medical Assessors,2000 to <strong>2009</strong>Number of Pers<strong>on</strong>s Examined and found to be Number ofYearNumber ofScheduled (1) AllowanceAllowance not attend forExaminati<strong>on</strong>s Qualif<strong>ie</strong>d for Disability Not qualif<strong>ie</strong>d for Disability Pers<strong>on</strong>s who didExaminati<strong>on</strong>2000 10,285 4,017 2,840 3,4282001 9,663 3,577 3,016 3,0702002 8,952 3,295 2,755 2,9022003 10,349 3,511 3,478 3,3602004 11,069 4,182 3,290 3,5972005 10,847 3,808 3,336 3,7032006 10,832 3,838 3,421 3,5732007 13,190 4,724 4,255 4,2112008 14,661 5,370 4,852 4,439<strong>2009</strong> 10,067 3,090 4,340 2,637(1) These figures include Disability Allowance Applicati<strong>on</strong>, Rev<strong>ie</strong>w and Appeal examinati<strong>on</strong>s.59<str<strong>on</strong>g>Statistical</str<strong>on</strong>g> <str<strong>on</strong>g>Informati<strong>on</strong></str<strong>on</strong>g> <strong>on</strong> <strong>Social</strong> <strong>Welfare</strong> <strong>Services</strong> <strong>2009</strong>
illness, disability and caring60Table E19: Number of Recip<strong>ie</strong>nts of Illness, Disability and Caring Payments by Payment Type and County, <strong>2009</strong>RespiteCare GrantCarer'sAllowanceBlindPensi<strong>on</strong>DisabilityAllowanceDeathBenefitPensi<strong>on</strong>InterimIllnessBenefitIncapacity InjurySupplement (1) BenefitDisablementPensi<strong>on</strong>Carer'sBenefitInvalidityPensi<strong>on</strong>IllnessBenefitCarlow 1,623 892 28 225 15 17 8 11 1,408 21 760 79Cavan 1,254 643 24 191 11 14 4 10 1,256 17 793 77Clare 1,574 1,078 46 295 25 10 4 10 2,475 23 1,302 240Cork 9,820 7,061 210 1,909 114 87 48 91 12,230 122 5,545 762D<strong>on</strong>egal 2,725 1,572 67 403 32 19 6 21 4,554 81 2,947 270Dublin 19,215 14,727 385 3,117 185 186 86 143 24,923 394 8,832 1,388Galway 2,946 1,770 148 640 58 32 22 13 5,859 77 2,958 331Kerry 2,036 1,417 74 357 25 12 7 23 4,052 55 2,139 264Kildare 3,652 1,923 92 480 38 39 16 24 3,128 26 1,477 196Kilkenny 1,196 919 41 263 13 20 7 16 1,857 43 954 100Laois 1,159 718 32 184 18 15 5 6 1,518 28 714 103Leitrim 718 415 17 106 8 3 2 8 736 20 468 51Limerick 4,161 2,976 85 840 55 33 11 32 5,105 64 2,532 311L<strong>on</strong>gford 697 597 30 151 12 6 2 8 1,114 11 677 54Louth 3,436 1,923 54 511 27 23 10 19 2,635 51 1,211 129Mayo 2,148 1,263 89 366 38 26 8 13 3,578 65 2,296 234Meath 3,346 1,467 79 520 28 41 18 21 2,237 43 1,275 151M<strong>on</strong>aghan 1,194 555 16 172 12 8 6 11 1,251 14 720 60Offaly 1,565 982 49 243 19 10 5 13 1,649 33 1,003 112Roscomm<strong>on</strong> 1,053 673 43 217 11 8 3 16 1,376 10 825 118Sligo 1,100 736 40 192 19 13 5 5 1,740 52 873 76Tipperary 2,514 1,926 71 578 45 34 11 45 4,459 63 2,482 303Waterford 2,128 1,475 49 408 24 14 4 13 2,548 31 1,253 115Westmeath 1,601 1,148 34 237 25 18 4 15 1,943 31 1,023 113Wexford 2,381 1,834 66 393 25 26 8 21 3,419 55 2,022 211Wicklow 2,131 1,336 45 338 16 11 8 16 2,526 37 1,142 104Others 292 896 3 184 9 1 0 13 0 0 0 1Total 77,665 52,922 1,917 13,520 907 726 318 637 99,576 1,467 48,223 5,953(1) Incapacity Supplement is paid as a supplement to Disablement Pensi<strong>on</strong><str<strong>on</strong>g>Statistical</str<strong>on</strong>g> <str<strong>on</strong>g>Informati<strong>on</strong></str<strong>on</strong>g> <strong>on</strong> <strong>Social</strong> <strong>Welfare</strong> <strong>Services</strong> <strong>2009</strong>
Secti<strong>on</strong> FJobseeker’s Supports
jobseeker’s supportsSecti<strong>on</strong> F: Jobseeker’s SupportsThe statistics in this secti<strong>on</strong> of the report relate to the Live Register, expenditure and recip<strong>ie</strong>nts of jobseeker’spayments;Live Register and Jobseeker’s PaymentsThe Live Register is a m<strong>on</strong>thly statistical count compiled by the Central Statistics Office of certain categor<strong>ie</strong>s ofpers<strong>on</strong>s registered with the Department of <strong>Social</strong> Protecti<strong>on</strong> for Jobseeker’s Benefit, Jobseeker’s Allowance andcredited <strong>Social</strong> Insurance c<strong>on</strong>tributi<strong>on</strong>s.The Live Register comprises of the following classes of people under the age of 65 years:(i)(ii)(iii)all claimants of Jobseeker’s Benefit excluding systematic short-time workers,applicants for Jobseeker’s Allowance excluding smallholders and self-employed pers<strong>on</strong>s,other registrants including applicants for credited <strong>Social</strong> <strong>Welfare</strong> c<strong>on</strong>tributi<strong>on</strong>s but excluding thosedirectly involved in an industrial dispute.This means that not all pers<strong>on</strong>s who are in receipt of Jobseeker’s Benefit or Allowance are <strong>on</strong> the Live Register.Some pers<strong>on</strong>s who are included <strong>on</strong> the Live Register e.g. applicants for credited c<strong>on</strong>tributi<strong>on</strong>s, are not in receiptof a Jobseeker’s Benefit or Allowance payment.62The jobseeker’s recip<strong>ie</strong>nts figure shown in Secti<strong>on</strong> A and tables F3 and F4 is not directly comparable with the LiveRegister figure, as this figure <strong>on</strong>ly includes those who were in receipt of a payment at the end of December.TrendsOverall expenditure <strong>on</strong> Jobseeker’s Supports increased by 79.1% over 2008.Expenditure <strong>on</strong> Jobseeker’s Benefit and Jobseeker’s Allowance rose by nearly €805 milli<strong>on</strong> and €846 milli<strong>on</strong>compared with 2008, increases of 86.7% and 73.0% respectively.The Live Register increased by 132,232 during <strong>2009</strong>, an increase of 45.4%. Table F14 shows the numbers <strong>on</strong> theLive Register by County from 2000 to <strong>2009</strong> and the percentage increase in each county.<str<strong>on</strong>g>Statistical</str<strong>on</strong>g> <str<strong>on</strong>g>Informati<strong>on</strong></str<strong>on</strong>g> <strong>on</strong> <strong>Social</strong> <strong>Welfare</strong> <strong>Services</strong> <strong>2009</strong>
jobseeker’s supportsTable F1: Expenditure <strong>on</strong> Jobseeker’s Supports by Payment Type, 2008 and <strong>2009</strong>Type of Payment 2008 <strong>2009</strong> (1) Change <strong>2009</strong> over 2008€000 €000SOCIAL INSURANCEJobseeker’s Benefit 928,844 1,733,774 86.7%SOCIAL ASSISTANCEJobseeker’s Allowance 1,158,851 2,004,556 73.0%TOTAL 2,087,695 3,738,330 79.1%(1) Provisi<strong>on</strong>alTable F2: Expenditure <strong>on</strong> Jobseeker’s Supports by Payment Type, 2000 to <strong>2009</strong>Year Jobseeker’s Benefit Jobseeker’s Allowance Total€000 €000 €0002000 265,016 469,092 734,1082001 290,689 429,875 720,5642002 423,487 511,985 935,4722003 477,129 565,952 1,043,0812004 455,586 613,817 1,069,4032005 418,085 667,483 1,085,5682006 455,073 768,560 1,223,6332007 544,931 875,092 1,420,0232008 928,844 1,158,851 2,087,695<strong>2009</strong> (1) 1,733,774 2,004,556 3,738,330(1) Provisi<strong>on</strong>al63Table F3: Number of Recip<strong>ie</strong>nts of Jobseeker’s Benefit and Jobseeker’s Allowance,2000 to <strong>2009</strong>Year Jobseeker’s Benefit Jobseeker’s Allowance Total2000 46,565 69,504 116,0692001 59,884 66,563 126,4472002 66,416 71,566 137,9822003 70,090 75,249 145,3392004 57,699 73,840 131,5392005 52,754 75,357 128,1112006 50,542 75,801 126,3432007 59,167 80,268 139,4352008 121,763 113,603 235,366<strong>2009</strong> 160,122 203,248 363,370<str<strong>on</strong>g>Statistical</str<strong>on</strong>g> <str<strong>on</strong>g>Informati<strong>on</strong></str<strong>on</strong>g> <strong>on</strong> <strong>Social</strong> <strong>Welfare</strong> <strong>Services</strong> <strong>2009</strong>
jobseeker’s supportsGraph F1: Expenditure <strong>on</strong> Jobseeker’s Benefit and Jobseeker’s Allowance, 2000 to <strong>2009</strong>4,000,0003,500,0003,000,0002,500,0000002,000,0001,500,0001,000,000500,00002000 2001 2002 2003 2004 2005 2006 2007 2008 <strong>2009</strong>Jobseeker's Benefit Jobseeker's Allowance Total64Table F4: Number of Recip<strong>ie</strong>nts of Jobseeker’s Benefit and Jobseeker’s Allowance byNumber of Dependants, <strong>2009</strong>Number of Recip<strong>ie</strong>ntsJobseeker’sBenefitJobseeker’sAllowancePers<strong>on</strong>al Rate <strong>on</strong>ly 126,730 145,893 272,623With Qualif<strong>ie</strong>d Adult <strong>on</strong>ly 6,214 12,609 18,8231 full rate Qualif<strong>ie</strong>d Child 5,773 11,949 17,7222 full rate Qualif<strong>ie</strong>d Children 5,247 11,314 16,5613 full rate Qualif<strong>ie</strong>d Children 2,509 6,595 9,1044 full rate Qualif<strong>ie</strong>d Children 806 2,826 3,6325 full rate Qualif<strong>ie</strong>d Children 168 1,005 1,1736+full rate Qualif<strong>ie</strong>d Children 66 597 6631 half rate Qualif<strong>ie</strong>d Child 5,716 4,269 9,9852 half rate Qualif<strong>ie</strong>d Children 4,634 3,488 8,1223 half rate Qualif<strong>ie</strong>d Children 1,754 1,718 3,4724 half rate Qualif<strong>ie</strong>d Children 423 676 1,0995 half rate Qualif<strong>ie</strong>d Children 59 215 2746+ half rate Qualif<strong>ie</strong>d Children 23 94 117Total Number of Recip<strong>ie</strong>nts 160,122 203,248 363,370Number of Recip<strong>ie</strong>nts with a Qualif<strong>ie</strong>d Adult 18,281 44,050 62,331Percentage of Recip<strong>ie</strong>nts with a Qualif<strong>ie</strong>d Adult 11.4% 21.7% 17.2%Number of Recip<strong>ie</strong>nts with Qualif<strong>ie</strong>d Children 27,178 44,746 71,924Percentage of Recip<strong>ie</strong>nts with Qualif<strong>ie</strong>d Children 17.0% 22.0% 19.8%Total Number of Children (1) 50,656 95,454 146,110(1) A Qualif<strong>ie</strong>d Child Increase is payable at half rate where a spouse, living with the recip<strong>ie</strong>nt, is not a Qualif<strong>ie</strong>d Adult. Each spouse may receive half theQualif<strong>ie</strong>d Child Increase where both are in receipt of a social welfare payment. This can result in some double counting of the actual number of Qualif<strong>ie</strong>dChildren.Total<str<strong>on</strong>g>Statistical</str<strong>on</strong>g> <str<strong>on</strong>g>Informati<strong>on</strong></str<strong>on</strong>g> <strong>on</strong> <strong>Social</strong> <strong>Welfare</strong> <strong>Services</strong> <strong>2009</strong>
jobseeker’s supportsTable F5: Number of Pers<strong>on</strong>s <strong>on</strong> the Live Register <strong>on</strong> the last Friday of each M<strong>on</strong>th, <strong>2009</strong>M<strong>on</strong>thJobseeker’sBenefitJobseeker’sAllowanceCreditedC<strong>on</strong>tributi<strong>on</strong>sTotal Live RegisterJanuary 163,615 150,856 11,801 326,272February 179,132 161,299 12,022 352,453March 187,878 169,102 12,223 369,203April 193,490 175,534 12,852 381,876May 191,185 189,544 13,405 394,134June 195,079 205,998 14,385 415,462July 196,988 219,463 15,970 432,421August 193,471 226,587 16,667 436,725September 177,413 225,680 16,761 419,854October 168,488 226,550 17,369 412,407November 163,701 231,654 18,150 413,505December 165,307 239,079 19,209 423,595Average 181,312 201,779 15,068 398,159NOTE Live register figures as revised by Central Statistics office to take account of change in method of counting Live Register implemented in October <strong>2009</strong>.Table F6: Average Number of Pers<strong>on</strong>s <strong>on</strong> the Live Register, 2000 to <strong>2009</strong>YearJobseeker’sBenefitJobseeker’sAllowanceCreditedC<strong>on</strong>tributi<strong>on</strong>sAverageLiveRegister2000 57,198 85,013 13,187 155,3982001 58,197 72,552 11,504 142,2532002 73,931 78,010 11,420 163,3612003 79,232 81,355 11,828 172,4152004 71,884 82,693 11,436 166,0132005 62,536 84,150 10,430 157,1162006 61,729 85,950 9,719 157,3982007 65,146 87,756 9,390 162,2922008 103,004 113,643 10,423 227,069<strong>2009</strong> 181,312 201,779 15,068 398,159Source: Central Statistics Office65Table F7: Flows On and Off the Live Register by M<strong>on</strong>th, <strong>2009</strong>M<strong>on</strong>th New Registrati<strong>on</strong> (1) Outflow (1) Live Register (2) Net ChangeJanuary 70,166 33,912 326,272 36,254February 55,804 29,623 352,453 26,181March 47,596 30,846 369,203 16,750April 46,188 33,515 381,876 12,673May 56,399 44,141 394,134 12,258June 52,635 31,307 415,462 21,328July 61,293 44,334 432,421 16,959August 38,383 34,079 436,725 4,304September 46,957 63,828 419,854 -16,871October 60,050 67,497 412,407 -7,447November 47,383 46,285 413,505 1,098December 43,413 33,323 423,595 10,090Total 626,267 492,690 133,577(1)Statistics <strong>on</strong> new registrati<strong>on</strong>s and outflows from October <strong>on</strong>wards include inter-scheme activity <strong>on</strong> the live register.(2) Live Register figures as revised by the Central Statistics Office to take account of change in method of counting live register implemented in October <strong>2009</strong>.<str<strong>on</strong>g>Statistical</str<strong>on</strong>g> <str<strong>on</strong>g>Informati<strong>on</strong></str<strong>on</strong>g> <strong>on</strong> <strong>Social</strong> <strong>Welfare</strong> <strong>Services</strong> <strong>2009</strong>
jobseeker’s supportsTable F8: Number of Pers<strong>on</strong>s <strong>on</strong> the Live Register by Age and Sex, October <strong>2009</strong>Age Males Females TotalNumber Number NumberUnder 20 years 9,514 3.5% 5,856 4.2% 15,370 3.7%20 to 24 years 44,592 16.3% 24,986 18.0% 69,578 16.9%25 to 34 years 90,303 33.0% 42,724 30.8% 133,027 32.3%35 to 44 years 60,527 22.1% 28,527 20.6% 89,054 21.6%45 to 54 years 41,486 15.2% 21,832 15.7% 63,318 15.4%55 to 59 years 15,237 5.6% 8,511 6.1% 23,748 5.8%60 to 64 years 11,936 4.4% 6,376 4.6% 18,312 4.4%Total Live Register 273,595 100.0% 138,812 100.0% 412,407 100.0%Graph F2: Number of Pers<strong>on</strong>s <strong>on</strong> the Live Register by Age and Sex, <strong>2009</strong>100,00090,00080,00070,000MalesFemales60,0006650,00040,00030,00020,00010,0000Under 20 years 20 to 24 years 25 to 34 years 35 to 44 years 45 to 54 years 55 to 59 years 60 to 64 years<str<strong>on</strong>g>Statistical</str<strong>on</strong>g> <str<strong>on</strong>g>Informati<strong>on</strong></str<strong>on</strong>g> <strong>on</strong> <strong>Social</strong> <strong>Welfare</strong> <strong>Services</strong> <strong>2009</strong>
jobseeker’s supportsTable F9: Number of Pers<strong>on</strong>s <strong>on</strong> the Live Register in October <strong>2009</strong>, Classif<strong>ie</strong>d byDurati<strong>on</strong> of ClaimSex/Age< 3 mths 3 - 6 mths 6 - 12mthsDurati<strong>on</strong> of C<strong>on</strong>tinuous Registrati<strong>on</strong>1 - 2 yrs 2 - 3 yrs > 3 yrs TotalMales< 20 yrs 3,651 1,231 3,043 1,588 1 0 9,51420 - 24 yrs 16,088 7,272 11,399 6,000 2,129 1,704 44,59225 - 34 yrs 33,410 12,782 26,227 9,590 3,250 5,044 90,30335 - 44 yrs 20,426 7,744 17,376 6,911 2,521 5,549 60,52745 - 54 yrs 13,580 4,850 11,155 4,356 1,827 5,718 41,48655 - 59 yrs 4,961 1,741 3,961 1,595 664 2,315 15,23760 - 64 yrs 3,850 1,386 3,447 1,401 579 1,273 11,936Total Males 95,966 37,006 76,608 31,441 10,971 21,603 273,595Females< 20 yrs 2,427 829 1,640 960 0 0 5,85620 - 24 yrs 11,318 4,039 4,832 2,770 1,114 913 24,98625 - 34 yrs 20,642 6,643 10,327 2,641 892 1,579 42,72435 - 44 yrs 13,020 4,092 7,013 2,014 829 1,559 28,52745 - 54 yrs 10,606 2,609 4,306 1,620 698 1,993 21,83255 - 59 yrs 3,825 937 1,625 848 374 902 8,51160 - 64 yrs 2,578 797 1,308 793 357 543 6,376Total64,416 19,946 31,051 11,646 4,264 7,489 138,812FemalesAll Pers<strong>on</strong>s< 20 yrs 6,078 2,060 4,683 2,548 1 0 15,37020 - 24 yrs 27,406 11,311 16,231 8,770 3,243 2,617 69,57825 - 34 yrs 54,052 19,425 36,554 12,231 4,142 6,623 133,02735 - 44 yrs 33,446 11,836 24,389 8,925 3,350 7,108 89,05445 - 54 yrs 24,186 7,459 15,461 5,976 2,525 7,711 63,31855 - 59 yrs 8,786 2,678 5,586 2,443 1,038 3,217 23,74860 - 64 yrs 6,428 2,183 4,755 2,194 936 1,816 18,312Total 160,382 56,952 107,659 43,087 15,235 29,092 412,40767<str<strong>on</strong>g>Statistical</str<strong>on</strong>g> <str<strong>on</strong>g>Informati<strong>on</strong></str<strong>on</strong>g> <strong>on</strong> <strong>Social</strong> <strong>Welfare</strong> <strong>Services</strong> <strong>2009</strong>
jobseeker’s supportsTable F10: Number of Pers<strong>on</strong>s <strong>on</strong> the Live Register in October by Sex and Durati<strong>on</strong>,2000 to <strong>2009</strong>Year Male Female OverallTotal< 1 yr >= 1 yr Total < 1 yr >= 1 yr Total2000 45,206 35,138 80,344 40,462 18,904 59,366 139,7102001 53,472 30,061 83,533 42,628 15,342 57,970 141,5032002 64,586 29,107 93,693 50,106 13,866 63,972 157,6652003 64,449 31,489 95,938 53,354 15,283 68,637 164,5752004 59,478 30,529 90,007 49,889 14,148 64,037 154,0442005 58,473 30,301 88,774 47,829 13,239 61,068 149,8422006 57,050 31,632 88,682 46,675 13,912 60,587 149,2692007 64,272 32,638 96,910 46,340 14,136 60,476 157,3862008 122,358 40,030 162,388 68,038 16,103 84,141 246,529<strong>2009</strong> 209,580 64,015 273,595 115,413 23,399 138,813 412,407Source: Central Statistics OfficeGraph F3: Number of Pers<strong>on</strong>s <strong>on</strong> the Live Register in October <strong>2009</strong>, by Sex andDurati<strong>on</strong>68120,000100,00080,00060,00040,00020,000-< 3 mths 3 - 6 mths 6 - 12 mths 1 - 2 yrs 2 - 3 yrs > 3 yrsMalesFemales<str<strong>on</strong>g>Statistical</str<strong>on</strong>g> <str<strong>on</strong>g>Informati<strong>on</strong></str<strong>on</strong>g> <strong>on</strong> <strong>Social</strong> <strong>Welfare</strong> <strong>Services</strong> <strong>2009</strong>
jobseeker’s supportsTable F11: Categor<strong>ie</strong>s excluded from the Live Register: Number of Short-TimeWorkers, Self-Employed, Short-Term Enterprise Allowance, Work PlacementProgramme and Pers<strong>on</strong>s aged 65, in each M<strong>on</strong>th during <strong>2009</strong>M<strong>on</strong>thShort-TimeWorkersSelf-EmployedShort-TermEnterpriseAllowanceScheme (1)Work PlacementProgrammeGraduate (2)WorkPlacementProgrammeOpen (2)Pers<strong>on</strong>sAged65 yearsJanuary 9,725 3,711 0 0 0 1,560February 13,628 4,122 0 0 0 1,617March 15,884 4,557 0 0 0 1,625April 16,744 4,859 0 0 0 1,697May 18,706 5,271 19 0 0 1,715June 17,564 5,587 106 0 0 1,788July 17,694 5,929 306 0 0 1,850August 17,459 6,157 445 2 0 1,893September 17,163 6,445 613 3 5 1,947October 17,082 6,762 818 20 10 1,909November 17,067 7,054 1,033 35 17 1,935December 16,766 7,360 1,152 42 23 2,074Average 16,290 5,651 562 20 11 1,801(1) Short-Term Enterprise Allowance Scheme was introduced from the 1st May <strong>2009</strong>.(2) Work Placement Programme Graduate and Open were introduced from the 1st August <strong>2009</strong>.Table F12: Categor<strong>ie</strong>s Excluded from the Live Register: Average number of Short-TimeWorkers, Self-Employed and Pers<strong>on</strong>s aged 65, 2000 to <strong>2009</strong>69Year Short-Time Workers Self-Employed Pers<strong>on</strong>s Aged 65 years2000 2,791 1,876 7412001 2,949 1,593 6792002 3,131 1,547 8212003 2,410 1,759 9462004 1,829 1,764 9622005 1,841 1,829 9322006 1,259 1,839 9712007 1,284 1,925 1,0602008 2,962 2,547 1,283<strong>2009</strong> 16,290 5,651 1,801Table F13: Average Live Register, Total Labour Force and Seas<strong>on</strong>ally AdjustedStandardised Unemployment Rate, 2000 to <strong>2009</strong>YearAverage Total Labour Force (1) Average Seas<strong>on</strong>ally Adjusted StandardisedLive RegisterUnemployment Rate2000 155,398 1,781,000 4.2%2001 142,253 1,831,600 3.9%2002 (1) 163,361 1,862,100 4.4%2003 172,414 1,912,700 4.6%2004 166,013 1,982,100 4.4%2005 157,116 2,078,100 4.4%2006 157,398 2,162,400 4.4%2007 162,309 2,239,900 4.5%2008 227,069 2,222,700 7.7%<strong>2009</strong> 440,201 2,155,200 13.1%Source: Central Statistics Office(1) Figures from 2002 <strong>on</strong>ward revised by Central Statistics Office
jobseeker’s supports70Table F14: Number <strong>on</strong> the Live Register by County, 2000 to <strong>2009</strong>County 2000 2001 2002 2003 2004 2005 2006 2007 2008 <strong>2009</strong> ChangeCarlow 1,964 2,026 2,079 2,227 2,223 2,065 1,965 2,448 4,395 6,578 234.9%Cavan 1,736 1,834 2,002 2,128 2,072 2,211 2,287 2,628 5,073 7,189 314.1%Clare 3,003 3,473 4,058 4,219 3,851 3,945 4,073 4,696 7,503 10,404 246.5%Cork 14,538 16,698 17,456 17,200 15,920 15,533 15,208 16,696 28,064 43,637 200.2%D<strong>on</strong>egal 10,088 9,896 9,897 10,149 9,440 8,637 8,774 9,107 15,264 20,748 105.7%Dublin 33,186 35,596 41,455 43,562 39,361 39,933 38,505 40,832 67,505 101,172 204.9%Galway 8,011 8,625 9,403 9,348 8,797 8,645 9,046 9,755 16,479 22,722 183.6%Kerry 6,025 6,162 6,704 7,086 6,732 6,650 6,793 7,288 12,364 15,923 164.3%Kildare 3,268 3,697 4,362 4,752 4,350 4,662 5,187 6,061 11,533 17,229 427.2%Kilkenny 2,047 2,182 2,467 2,716 2,489 2,484 2,557 2,692 4,973 7,069 245.3%Laois 1,798 1,850 2,049 2,196 2,014 1,980 2,034 2,787 5,378 7,679 327.1%Leitrim 1,216 1,108 1,247 1,231 1,028 1,109 1,185 1,442 2,501 3,600 196.1%Limerick 6,306 6,954 8,281 8,123 7,245 7,106 7,314 8,236 14,030 21,375 239.0%L<strong>on</strong>gford 1,715 1,674 1,810 1,820 1,736 1,800 1,941 2,378 3,840 5,157 200.7%Louth 6,075 7,189 7,559 7,508 6,743 6,480 6,536 6,892 11,457 16,614 173.5%Mayo 6,140 6,094 6,342 6,106 5,420 5,141 4,710 5,089 8,792 12,736 107.4%Meath 2,085 2,855 2,844 3,218 3,137 3,001 3,038 3,557 6,977 11,071 431.0%M<strong>on</strong>aghan 2,482 2,752 2,521 2,486 2,335 2,038 2,009 2,257 4,298 6,334 155.2%Offaly 2,222 2,341 2,640 2,840 2,563 2,771 2,768 3,282 5,617 8,191 268.6%Roscomm<strong>on</strong> 1,528 1,502 1,513 1,389 1,266 1,190 1,285 1,512 2,694 3,820 150.0%Sligo 2,372 2,343 2,388 2,236 2,043 1,938 1,859 2,136 3,530 4,992 110.5%Tipperary 5,775 5,466 6,286 6,548 5,902 5,623 5,315 5,756 10,261 15,087 161.2%Waterford 5,699 7,043 6,074 6,098 7,164 6,248 6,266 6,625 10,491 14,345 151.7%Westmeath 2,618 2,960 3,305 3,628 3,658 3,599 3,800 4,102 7,284 9,996 281.8%Wexford 5,938 6,257 7,058 7,141 6,773 6,615 6,710 7,511 12,978 18,156 205.8%Wicklow 3,751 3,829 4,342 4,649 4,554 4,429 4,224 4,611 8,082 11,771 213.8%Total 141,586 152,406 166,142 170,604 158,816 155,833 155,389 170,376 291,363 423,595 199.2%Source: Central Statistics Office<str<strong>on</strong>g>Statistical</str<strong>on</strong>g> <str<strong>on</strong>g>Informati<strong>on</strong></str<strong>on</strong>g> <strong>on</strong> <strong>Social</strong> <strong>Welfare</strong> <strong>Services</strong> <strong>2009</strong>
Secti<strong>on</strong> GEmployment Supports
employment supportsSecti<strong>on</strong> G: Employment SupportsThe statistics in this secti<strong>on</strong> of the report relate to expenditure and recip<strong>ie</strong>nts of a range of Employment Supportsprovided by the Department of <strong>Social</strong> Protecti<strong>on</strong>. These include:• Family Income Supplement• Back to Work Allowance• Back to Work Enterprise Allowance• Back to Educati<strong>on</strong> Allowance• Part Time Job Incentive Scheme• Farm AssistTrendsOverall expenditure <strong>on</strong> Employment Supports increased by €39 milli<strong>on</strong> in <strong>2009</strong>, an increase of 9.3% over 2008.The total number of recip<strong>ie</strong>nts of Employment Supports rose by 6,062 an increase of 11.8%.72Expenditure <strong>on</strong> Family Income Supplement decreased by 1.9%. The number of recip<strong>ie</strong>nts of Family IncomeSupplement decreased by 1,835 a decrease of 6.6% over 2008. Expenditure <strong>on</strong> Back to Work Allowance (includingBack to Work Enterprise Allowance) increased by over €3 milli<strong>on</strong>, an increase of 4.5%. The number of recip<strong>ie</strong>ntsof Back to Work Allowance decreased by 1,546, a decrease of 43.5%. The number of recip<strong>ie</strong>nts of Back to WorkEnterprise Allowance decreased by 13, a decrease of 0.3%. The number of recip<strong>ie</strong>nts of Farm Assist increased by1,476, an increase of 19.7% from the previous year.<str<strong>on</strong>g>Statistical</str<strong>on</strong>g> <str<strong>on</strong>g>Informati<strong>on</strong></str<strong>on</strong>g> <strong>on</strong> <strong>Social</strong> <strong>Welfare</strong> <strong>Services</strong> <strong>2009</strong>
employment supportsTable G1: Expenditure <strong>on</strong> Employment Supports by Payment Type, 2008 and <strong>2009</strong>Type of Payment 2008€000<strong>2009</strong> (1)€000Change <strong>2009</strong> over2008Family Income Supplement 170,309 167,133 -1.9%Back to Work Allowance/ Back to Work Enterprise Allowance 73,169 76,434 4.5%Back to Educati<strong>on</strong> Allowance 77,136 107,316 39.1%Part-time Job Incentive Scheme 1,324 1,445 9.1%Farm Assist 84,881 93,297 9.9%Others (2) 8,902 8,693 -2.3%TOTAL 415,721 454,318 9.3%(1) Provisi<strong>on</strong>al(2) Includes Activati<strong>on</strong> and Family Programme, Technical Assistance and Training Grants,Sec<strong>on</strong>d Chance Educati<strong>on</strong> Opportunit<strong>ie</strong>s Scheme and Credit Uni<strong>on</strong> loan guarantee scheme for Back to Work participants.Graph G1: Expenditure <strong>on</strong> Employment Supports, 2000 to <strong>2009</strong>500,000450,000400,000€000350,000300,000250,000200,000150,00073100,00050,0002000 2001 2002 2003 2004 2005 2006 2007 2008 <strong>2009</strong>Other Employment SupportsFamily Income Supplement<str<strong>on</strong>g>Statistical</str<strong>on</strong>g> <str<strong>on</strong>g>Informati<strong>on</strong></str<strong>on</strong>g> <strong>on</strong> <strong>Social</strong> <strong>Welfare</strong> <strong>Services</strong> <strong>2009</strong>
employment supportsTable G2: Expenditure <strong>on</strong> Family Income Supplement and Other EmploymentSupports, 2000 to <strong>2009</strong>YearFamily IncomeSupplementOther EmploymentSupportsTotal€000 €000 €0002000 39,386 245,898 285,2842001 37,099 246,605 283,7042002 42,423 226,705 269,1282003 45,360 202,213 247,5732004 55,812 182,299 238,1112005 72,152 173,897 246,0492006 107,137 186,637 293,7742007 140,020 223,710 363,7302008 170,309 245,412 415,721<strong>2009</strong> (1) 167,133 287,185 454,318(1) Provisi<strong>on</strong>alTable G3: Number of Recip<strong>ie</strong>nts of Employment Supports by Payment Type, 2008 and<strong>2009</strong>74Type of Payment 2008 <strong>2009</strong> Change <strong>2009</strong> over 2008Back to Work Allowance 3,558 2,012 -43.5%Back to Work Enterprise Allowance 4,604 4,591 -0.3%Back to Educati<strong>on</strong> Allowance 7,886 15,877 101.3%Part-Time Job Incentive Scheme 184 173 -6.0%Family Income Supplement 27,798 25,963 -6.6%Farm Assist 7,496 8,972 19.7%Total 51,526 57,588 11.8%Table G4: Number of Famil<strong>ie</strong>s Receiving Family Income Supplement, 2000 to <strong>2009</strong>Year Number of Famil<strong>ie</strong>s Number of Child Beneficiar<strong>ie</strong>s2000 13,181 31,2742001 11,880 26,4262002 12,043 26,5312003 12,317 26,4092004 14,727 29,9912005 17,448 33,9562006 21,800 43,8612007 22,823 47,5292008 27,798 58,019<strong>2009</strong> 25,963 55,716<str<strong>on</strong>g>Statistical</str<strong>on</strong>g> <str<strong>on</strong>g>Informati<strong>on</strong></str<strong>on</strong>g> <strong>on</strong> <strong>Social</strong> <strong>Welfare</strong> <strong>Services</strong> <strong>2009</strong>
employment supportsTable G5: Recip<strong>ie</strong>nts of Family Income Supplement by Age & Sex, <strong>2009</strong>Age Males Females TotalUnder 25 years 176 806 98225 to 29 Years 1,052 2,679 3,73130 to 34 years 1,940 3,430 5,37035 to 39 years 2,336 3,588 5,92440 to 44 years 2,161 2,855 5,01645 to 49 years 1,379 1,756 3,13550 to 54 years 631 663 1,29455 to 59 years 235 176 41160 to 64 years 72 18 9065 years and over 9 1 10Total 9,991 15,972 25,963Table G6: Number of Famil<strong>ie</strong>s Receiving Family Income Supplement by Rate ofPayment and Family Size, <strong>2009</strong>WeeklyFamily Size (Number of Children)Rate e1 2 3 4 5 6 7 8+ Total20-25 1,791 600 185 51 10 2 0 0 2,63926 - 50 2,584 997 331 92 10 3 0 0 4,01751 - 75 2,648 1,562 433 117 19 6 2 0 4,78776 - 100 1,073 2,043 606 156 36 1 4 1 3,920101 - 125 549 1,271 743 205 27 6 10 1 2,812126 - 150 345 817 831 254 43 8 1 2 2,301Over 150 424 1,174 1,508 1,436 622 215 77 32 5,488Total 9,414 8,464 4,637 2,311 767 241 94 36 25,964Number ofChildren9,414 16,928 13,911 9,244 3,835 1,446 658 288 55,72475Table G7: Number of Famil<strong>ie</strong>s Receiving Family Income Supplement by Age ofRecip<strong>ie</strong>nt and Family Income Group, <strong>2009</strong>Age ofRecip<strong>ie</strong>ntFamily Income Group (Euro per week)100-200 200-300 300-400 400-500 500-600 600-700 >700 TotalUnder 25 years 10 91 275 522 13 2 0 91325 to 29 years 50 249 994 2,092 236 27 7 3,65530 to 34 years 56 306 1,263 2,794 753 148 34 5,35435 to 39 years 67 342 1,204 2,751 1,143 331 97 5,93540 to 44 years 102 353 970 2,131 1,018 362 115 5,05145 to 49 years 57 249 588 1,403 615 195 97 3,20450 to 54 years 25 135 300 598 195 48 19 1,32055 to 59 years 9 58 103 192 44 18 3 42760 to 64 years 3 13 37 33 8 2 3 9965 years or0 1 1 1 0 2 0 5moreTotal 379 1,797 5,735 12,517 4,025 1,135 375 25,963<str<strong>on</strong>g>Statistical</str<strong>on</strong>g> <str<strong>on</strong>g>Informati<strong>on</strong></str<strong>on</strong>g> <strong>on</strong> <strong>Social</strong> <strong>Welfare</strong> <strong>Services</strong> <strong>2009</strong>
employment supportsTable G8: Number of Famil<strong>ie</strong>s Receiving Family Income Supplement by Family Statusand Income Group, <strong>2009</strong>Marital Status100-200200-300Family Income Group (Euro per week)300-400400-500500-600600-700>700 TotalOne Parent Family 126 752 2,825 8,506 1,598 258 79 14,144Two Parent Family 253 1,045 2,910 4,011 2,427 877 296 11,819Total 379 1,797 5,735 12,517 4,025 1,135 375 25,963Table G9: Number of Recip<strong>ie</strong>nts of Back to Work Allowance by Employment Statusand Sex, <strong>2009</strong>Employment Status Males Females TotalEmployees 935 1,077 2,012Self-Employed 3,402 1,189 4,591Total 4,337 2,266 6,603Table G10: Number of Recip<strong>ie</strong>nts of Back To Work Enterprise Allowance, Back to WorkAllowance, Back to Educati<strong>on</strong> Allowance and Farm Assist, by Age and Sex, <strong>2009</strong>76Age of Recip<strong>ie</strong>ntBack to WorkEnterpriseAllowanceBack to WorkAllowanceBack to Educati<strong>on</strong>AllowanceFarm AssistMale Female Male Female Male Female Male FemaleUnder 25 years 110 34 44 70 2,666 1,958 38 125 to 29 years 275 113 102 162 2,541 1,432 124 330 to 34 years 524 208 137 177 1,632 953 267 2235 to 39 years 665 249 204 174 1,008 664 566 5340 to 44 years 655 235 144 165 723 530 849 10145 to 49 years 503 149 119 160 462 377 1,129 10850 to 54 years 368 111 74 92 248 303 1,400 11055 to 59 years 192 63 60 54 130 139 1,686 13860 to 64 years 94 21 45 22 55 52 1,938 13065+ years 16 6 6 1 2 2 289 20Total 3,402 1,189 935 1,077 9,467 6,410 8,286 686<str<strong>on</strong>g>Statistical</str<strong>on</strong>g> <str<strong>on</strong>g>Informati<strong>on</strong></str<strong>on</strong>g> <strong>on</strong> <strong>Social</strong> <strong>Welfare</strong> <strong>Services</strong> <strong>2009</strong>
employment supportsTable G11: Number of recip<strong>ie</strong>nts of Farm Assist, 2000 to <strong>2009</strong>YearNumber of recip<strong>ie</strong>nts2000 8,0512001 8,3802002 8,5142003 8,7072004 8,3502005 7,8242006 7,4802007 7,3762008 7,496<strong>2009</strong> 8,972Table G12: Number of People <strong>on</strong> the Live Register referred to FÁS under The Nati<strong>on</strong>alEmployment Acti<strong>on</strong> Plan (NEAP), 2000 to <strong>2009</strong>YearNumber referedto FÁSNumberInterv<strong>ie</strong>wed byFÁSFÁSNumber who leftLive Register afterFÁS Interv<strong>ie</strong>wTotal Numberwho Left the LiveRegister (1)2000 24,404 16,865 12,067 16,7052001 24,119 15,869 10,237 14,7272002 32,427 20,695 13,180 19,8112003 43,595 28,646 16,218 25,1842004 52,328 35,136 20,199 30,1332005 40,718 28,714 17,191 24,2822006 37,959 25,186 14,702 22,2802007 51,452 32,124 18,224 32,3592008 60,260 40,933 19,844 33,919<strong>2009</strong> 86,782 65,600 39,052 53,63877(1) With or without FÁS interventi<strong>on</strong> Data is obtained from FÁS in respect of referrals processed in each year, and outcomes as v<strong>ie</strong>wed at the end of Januaryof the following year.Table G13: Recip<strong>ie</strong>nts of Short Term Enterprise Allowance, Work PlacementProgramme Graduate and Work Placement Programme Open, by Age and Sex, <strong>2009</strong>Age of Recip<strong>ie</strong>ntsShort Term EnterpriseAllowance (1)Work PlacementProgramme Graduate (2)Work PlacementProgramme Open (2)Male Female Total Male Female Total Male Female TotalUnder 25 years 21 14 35 12 9 21 14 12 2625 to 29 years 79 26 105 13 11 24 21 14 3530 to 34 years 176 67 243 6 7 13 7 6 1335 to 39 years 184 59 243 1 0 1 3 3 640 to 44 years 163 43 206 2 4 6 1 0 145 to 49 years 121 34 155 1 1 2 3 0 350 to 54 years 76 17 93 1 1 2 1 0 155 to 59 years 42 12 54 0 0 0 0 0 060 to 64 years 12 3 15 1 1 2 0 0 065 years and over 3 0 3 0 0 0 0 0 0Total 877 275 1,152 37 34 71 50 35 85(1) Short Term Enterprise Allowance scheme was introduced from 1st May <strong>2009</strong>.(2) Work Placement Programme Graduate and Open were introduced from 1st August <strong>2009</strong>.<str<strong>on</strong>g>Statistical</str<strong>on</strong>g> <str<strong>on</strong>g>Informati<strong>on</strong></str<strong>on</strong>g> <strong>on</strong> <strong>Social</strong> <strong>Welfare</strong> <strong>Services</strong> <strong>2009</strong>
employment supportsTable G14: Number of Recip<strong>ie</strong>nts of Employment Supports by County, <strong>2009</strong>78CountyFamilyIncomeSupplementBack ToWorkAllowanceSelfemployedBack ToWorkAllowanceEmployeeBack toEducati<strong>on</strong>AllowanceFarm Assist Part-Time JobIncentive (1)Carlow 445 89 32 428 70 0Cavan 520 53 18 193 343 2Clare 670 87 26 379 511 1Cork 2,709 421 222 1,276 757 11D<strong>on</strong>egal 1,297 353 136 948 1,219 5Dublin 5,871 1,147 629 3,678 10 64Galway 1,196 365 101 1,214 954 8Kerry 873 220 67 593 640 9Kildare 986 156 60 468 43 1Kilkenny 386 99 38 361 135 3Laois 453 95 18 154 96 1Leitrim 177 52 14 121 260 2Limerick 1,203 144 74 860 231 7L<strong>on</strong>gford 379 72 26 230 129 0Louth 993 152 68 475 68 1Mayo 845 126 72 506 1,550 17Meath 823 83 34 318 74 0M<strong>on</strong>aghan 454 81 43 247 440 2Offaly 520 62 31 188 88 2Roscomm<strong>on</strong> 354 48 21 194 320 0Sligo 416 66 30 362 409 7Tipperary 1,194 136 57 586 262 8Waterford 916 141 40 729 49 10Westmeath 512 82 28 290 96 1Wexford 1,152 132 68 532 163 11Wicklow 568 129 59 547 55 0Others 51 0 0 0 0 0Total 25,963 4,591 2,012 15,877 8,972 173(1) Based <strong>on</strong> the number of recip<strong>ie</strong>nts at each <strong>Social</strong> <strong>Welfare</strong> Local Office<str<strong>on</strong>g>Statistical</str<strong>on</strong>g> <str<strong>on</strong>g>Informati<strong>on</strong></str<strong>on</strong>g> <strong>on</strong> <strong>Social</strong> <strong>Welfare</strong> <strong>Services</strong> <strong>2009</strong>
SECTION HSupplementary <strong>Welfare</strong> Allowance
supplementary welfare allowanceSecti<strong>on</strong> H: Supplementary <strong>Welfare</strong> AllowanceThis secti<strong>on</strong> relates to payments made under the Supplementary <strong>Welfare</strong> Allowance scheme and includes:• Basic Supplementary <strong>Welfare</strong> Allowance payments• Rent supplements and Mortgage Interest supplements• Other supplements• Excepti<strong>on</strong>al Needs Payments and Urgent Needs Payments• The Back to School Clothing and Footwear Allowance schemeExpenditure and Recip<strong>ie</strong>ntsExpenditure <strong>on</strong> Supplementary <strong>Welfare</strong> Allowance amounted to €970 milli<strong>on</strong> in <strong>2009</strong>. This represents anincrease of 20.6% <strong>on</strong> 2008. Expenditure <strong>on</strong> Rent Supplements rose by over €70 milli<strong>on</strong> in <strong>2009</strong>, an increase of15.9%. The number of recip<strong>ie</strong>nts of Rent Supplement at the end of <strong>2009</strong> was 93,030, an increase of 25.6% <strong>on</strong>2008.80Expenditure <strong>on</strong> Mortgage Interest Supplements increased by 120.0% to €60.9 milli<strong>on</strong>. The number of recip<strong>ie</strong>ntsat the end of <strong>2009</strong> increased to 14,716 an increase of 92.4%.In <strong>2009</strong>, a Back to School Clothing and Footwear Allowance was paid in respect of 277,713 children, anincrease of 77,467 <strong>on</strong> 2008. Expenditure <strong>on</strong> the scheme increased by 35.4% to €67.1 milli<strong>on</strong>.Net expenditure <strong>on</strong> Basic Supplementary <strong>Welfare</strong> Allowance payments in <strong>2009</strong> was €233.5 milli<strong>on</strong>, an increaseof 26.6% <strong>on</strong> 2008. There were 42,775 recip<strong>ie</strong>nts of Basic Supplementary <strong>Welfare</strong> Allowance payments at theend of <strong>2009</strong>, an increase of 7,229 <strong>on</strong> 2008.Table H2 and Graph H1 shows expenditure <strong>on</strong> Supplementary <strong>Welfare</strong> Allowance from 2000 to <strong>2009</strong>.<str<strong>on</strong>g>Statistical</str<strong>on</strong>g> <str<strong>on</strong>g>Informati<strong>on</strong></str<strong>on</strong>g> <strong>on</strong> <strong>Social</strong> <strong>Welfare</strong> <strong>Services</strong> <strong>2009</strong>
supplementary welfare allowanceTable H1: Expenditure <strong>on</strong> Supplementary <strong>Welfare</strong> Allowance by Scheme, 2008 and <strong>2009</strong>Type of Payment 2008 <strong>2009</strong> (1) Change <strong>2009</strong>€000 €000 over 2008SOCIAL ASSISTANCEBasic Supplemantary <strong>Welfare</strong> Allowance Payments 184,477 233,532 26.6%Rent Supplements 440,548 510,751 15.9%Mortgage Interest Supplements 27,675 60,885 120.0%Other Supplements 14,286 14,214 -0.5%Excepti<strong>on</strong>al Needs & Urgent Needs Payments 82,254 75,210 -8.6%Back to School Clothing and Footwear 49,632 67,188 35.4%Direct Provisi<strong>on</strong> Allowance 4,963 7,339 47.9%Humanitarian Aid 0 605 100.0%Total 803,835 969,724 20.6%(1) Provisi<strong>on</strong>al.Graph H1: Expenditure <strong>on</strong> Supplementary <strong>Welfare</strong> Allowance, 1999 to 20081,200,0001,000,000800,000€000600,00081400,000200,00002000 2001 2002 2003 2004 2005 2006 2007 2008 <strong>2009</strong>Table H2: Expenditure <strong>on</strong> Supplementary <strong>Welfare</strong> Allowance Scheme, 2000 to <strong>2009</strong>YearExpenditure€0002000 294,9062001 363,5762002 484,9292003 587,8132004 601,5822005 624,0292006 634,9642007 682,7062008 803,835<strong>2009</strong> (1) 969,724(1) Provisi<strong>on</strong>al.<str<strong>on</strong>g>Statistical</str<strong>on</strong>g> <str<strong>on</strong>g>Informati<strong>on</strong></str<strong>on</strong>g> <strong>on</strong> <strong>Social</strong> <strong>Welfare</strong> <strong>Services</strong> <strong>2009</strong>
supplementary welfare allowanceTable H3: Expenditure <strong>on</strong> Excepti<strong>on</strong>al Needs Payments, Other Excepti<strong>on</strong>alSupplementary <strong>Welfare</strong> Allowance Payments and Urgent Needs Payments, <strong>2009</strong>82Type of Payment Expenditure Total Expenditure€000 €000Excepti<strong>on</strong>al Needs Payments and OtherExcepti<strong>on</strong>al SWA PaymentsHousingNew Accommodati<strong>on</strong> Kit 12,559Household Appliances 6,460Rent Deposit 6,598Furniture 3,187Floor Covering 2,065Bedding 1,622Repair/maintenance 1,321 33,812ClothingAdult Clothing 7,438Child Clothing 4,534 11,971FuneralFuneral Expenses 4,646Burial Expenses 558 5,204Child RelatedPram/Buggy 1,218Cot 558 2,250BillsRent/Mortgage Interest Arrears 6,163Household 3,063 9,226IllnessC<strong>on</strong>finement Costs 1,103Hospital Requirements 355 1,459GeneralOther (1) 4,436Travel Costs 2,598Insuffic<strong>ie</strong>nt Means 2,402Heating 1,210Lost/Stolen M<strong>on</strong>ey 183Household Budget 110 10,938Urgent Needs Payments 350 350Grand Total 75,210(1) This includes €0.40m in payments in respect of homeless people made <strong>on</strong> behalf of local authorit<strong>ie</strong>s and subsequently re-imbursed.It should be noted that some of the totals are not equal to the sum of the parts. This is due to rounding.<str<strong>on</strong>g>Statistical</str<strong>on</strong>g> <str<strong>on</strong>g>Informati<strong>on</strong></str<strong>on</strong>g> <strong>on</strong> <strong>Social</strong> <strong>Welfare</strong> <strong>Services</strong> <strong>2009</strong>
supplementary welfare allowanceTable H4: Number of Recip<strong>ie</strong>nts of Supplementary <strong>Welfare</strong> Allowance by HealthService Executive Area, <strong>2009</strong>Basic Payment (1) :Eastern Midland Mid-WesternNorthEasternNorthWesternSouthEasternSouthern Western TotalRecip<strong>ie</strong>nts 14,346 2,776 2,992 4,735 1,928 4,834 5,479 5,685 42,775Qualif<strong>ie</strong>d Adults 2,733 834 604 1,135 451 1,148 1,145 1,307 9,357Qualif<strong>ie</strong>d8,432 1,942 1,491 3,258 1,111 2,749 2,871 3,580 25,434ChildrenTotal25,511 5,552 5,087 9,128 3,490 8,731 9,495 10,572 77,566Beneficiar<strong>ie</strong>sSupplements:Rent 38,121 4,342 6,604 6,394 4,799 10,417 13,001 9,352 93,030Other Mortgage 5,333 549 1,033 1,935 399 2,357 1,660 1,450 14,716Local Authority 192 17 9 5 8 73 29 52 385MortgageHeating 420 170 1,552 47 21 1,025 1,241 84 4,560D<strong>ie</strong>t 3,821 534 693 565 199 216 827 536 7,391(2)Other 1,893 108 265 69 8 492 695 282 3,812(1) Includes DPA (Direct Provisi<strong>on</strong> Allowance)(2) Includes Creche, MABS, Other etc.Table H5: Recip<strong>ie</strong>nts and Expenditure <strong>on</strong> Basic Supplementary <strong>Welfare</strong> Allowance,Rent Supplement, Mortgage Interest Supplement, Local Authority Mortgage InterestSupplement and Other Supplements, 2000 to <strong>2009</strong>83YearBasicSupplementary<strong>Welfare</strong>Allowance (1) Rent Supplement Mortgage InterestSupplementLocal AuthorityMortgage InterestSupplementOtherSupplements (2)Recip<strong>ie</strong>nts €000 Recip<strong>ie</strong>nts €000 Recip<strong>ie</strong>nts €000 Recip<strong>ie</strong>nts €000 Recip<strong>ie</strong>nts €0002000 25,094 85,546 42,683 150,590 2,726 4,250 1,507 1,628 14,530 8,4212001 29,167 113,552 45,028 179,438 2,860 4,945 1,204 1,398 17,326 10,3512002 32,073 145,125 54,213 252,203 3,296 6,426 1,063 1,232 19,599 12,5192003 31,217 160,488 59,976 331,471 3,161 6,725 772 938 22,598 15,0432004 29,748 158,572 57,874 353,762 2,763 5,705 555 628 19,844 14,5682005 28,066 162,368 60,176 368,705 2,741 5,834 479 505 18,990 13,3922006 25,330 139,189 59,861 388,339 3,023 7,377 401 496 18,495 13,5332007 27,379 155,203 59,726 391,466 3,712 11,624 399 574 17,744 13,8352008 35,546 189,440 74,038 440,548 7,647 26,866 444 809 17,043 14,286<strong>2009</strong> 42,775 240,871 93,030 510,751 14,716 60,041 385 844 15,763 14,214(1) Includes DPA (Direct Provisi<strong>on</strong> Allowance)(2) Includes D<strong>ie</strong>t, Other, Travel, etc.<str<strong>on</strong>g>Statistical</str<strong>on</strong>g> <str<strong>on</strong>g>Informati<strong>on</strong></str<strong>on</strong>g> <strong>on</strong> <strong>Social</strong> <strong>Welfare</strong> <strong>Services</strong> <strong>2009</strong>
supplementary welfare allowance84Table H6: Number of Recip<strong>ie</strong>nts of Basic Supplementary <strong>Welfare</strong> Allowance, Rent Supplement, Mortgage Interest Supplement, LocalAuthority Mortgage Interest Supplement and Other Supplements by Age and Sex, <strong>2009</strong>Other Supplements (2)Local Authority MortgageInterest SupplementBasic SupplementaryRent Supplement Mortgage Interest<strong>Welfare</strong> Allowance (1) SupplementAgeGroupMale Female Total Male Female Total Male Female Total Male Female Total Male Female TotalUnder 20 1,314 1,293 2,607 356 1,003 1,359 0 0 0 0 0 0 31 71 10220 - 24 4,414 3,007 7,421 4,516 9,513 14,029 106 43 149 2 3 5 103 340 44325 - 29 4,980 2,624 7,604 8,130 9,711 17,841 973 407 1,380 19 13 32 254 550 80430 - 34 4,594 2,167 6,761 8,901 7,218 16,119 1,935 813 2,748 32 24 56 393 693 1,08635 - 39 3,706 1,758 5,464 7,858 5,366 13,224 2,443 896 3,339 54 35 89 491 579 1,07040 - 44 2,868 1,315 4,183 6,106 3,625 9,731 2,196 793 2,989 30 17 47 502 529 1,03145 - 49 2,189 1,005 3,194 4,657 2,547 7,204 1,475 522 1,997 29 14 43 585 555 1,14050 - 54 1,690 806 2,496 3,556 1,518 5,074 867 321 1,188 28 12 40 605 521 1,12655 - 59 1,134 568 1,702 2,402 1,128 3,530 434 162 596 12 14 26 686 674 1,36060 - 64 716 277 993 1,502 678 2,180 199 78 277 14 10 24 883 858 1,74165 - 69 181 92 273 805 409 1,214 31 13 44 12 4 16 815 817 1,63270 plus 45 32 77 777 748 1,525 3 6 9 2 5 7 1,556 2,672 4,228Total 27,831 14,944 42,775 49,566 43,464 93,030 10,662 4,054 14,716 234 151 385 6,904 8,859 15,763(1) Includes DPA (Direct Provisi<strong>on</strong> Allowance)(2) Includes D<strong>ie</strong>t, Other, Travel, etc.<str<strong>on</strong>g>Statistical</str<strong>on</strong>g> <str<strong>on</strong>g>Informati<strong>on</strong></str<strong>on</strong>g> <strong>on</strong> <strong>Social</strong> <strong>Welfare</strong> <strong>Services</strong> <strong>2009</strong>
supplementary welfare allowanceTable H7: Number of Recip<strong>ie</strong>nts of Rent Supplement, Mortgage Interest Supplementand Local Authority Mortgage Interest Supplement by Primary Payment, <strong>2009</strong>Payment Type Rent Supplement Mortgage InterestSupplementLocal AuthorityMortgage InterestSupplementState Pensi<strong>on</strong>s 1,567 11 7Pre-Retirement Allowance 113 2 3Widows and Widower’s Pensi<strong>on</strong>s 442 64 7One-Parent Family Payment 16,042 672 34Invalidity Pensi<strong>on</strong> 1,039 209 18Illness Benefit 2,674 1,455 28Disability Allowance 10,085 453 31L<strong>on</strong>g-Term Jobseeker’s Allowance 16,595 1,727 37Short-Term Jobseeker’s Allowance 10,862 1,800 24Jobseeker’s Benefit 10,787 4,634 96Supplementary <strong>Welfare</strong> Allowance 13,126 2,288 47Employment Support <strong>Services</strong> (1) 3,555 399 20DSS (UK) 350 11 0Other 5,793 991 33Total 93,030 14,716 385(1) Includes Back to Work Allowance, Community Employment, Back to Educati<strong>on</strong> Allowance, VTOS and FASTable H8: Number of Recip<strong>ie</strong>nts of Rent Supplement, Mortgage Interest Supplementand Local Authority Mortgage Interest Supplement by Claim Durati<strong>on</strong>, <strong>2009</strong>85M<strong>on</strong>ths (1) Rent Supplement Mortgage InterestSupplementLocal AuthorityMortgage InterestSupplement0 to 3 12,047 1,218 163 to 6 16,010 2,281 346 to 9 14,771 2,588 389 to 12 13,454 2,942 5512 to 24 19,446 4,021 10324 to 36 6,141 799 3136 to 48 3,833 396 2148 to 60 2,473 164 1360 to 72 1,681 105 772 plus 3,174 202 67Total 93,030 14,716 385(1) Claims with durati<strong>on</strong> of precisely 3 m<strong>on</strong>ths are recorded under the 3-6 m<strong>on</strong>ths heading, claims with durati<strong>on</strong> of precisely 6 m<strong>on</strong>ths are recorded under the6-9 m<strong>on</strong>ths heading and so <strong>on</strong>.<str<strong>on</strong>g>Statistical</str<strong>on</strong>g> <str<strong>on</strong>g>Informati<strong>on</strong></str<strong>on</strong>g> <strong>on</strong> <strong>Social</strong> <strong>Welfare</strong> <strong>Services</strong> <strong>2009</strong>
supplementary welfare allowanceTable H9: Number of Recip<strong>ie</strong>nts of Back to School Clothing & Footwear Allowance byHealth Service Executive Area, <strong>2009</strong>HSE Area Age 2 to 11 Age 12 to 17 Age 18 to 22 TotalEastern 58,790 25,394 2,299 86,483Midland 12,498 5,837 790 19,125Mid-Western 14,645 7,283 884 22,812North Eastern 16,967 8,102 1,354 26,423North Western 11,240 6,269 1,170 18,679South Eastern 21,670 11,133 1,346 34,149Southern 23,593 12,101 2,348 38,042Western 19,097 10,482 2,421 32,000Total 178,500 86,601 12,612 277,713NOTE These figures were extrapolated <strong>on</strong> the basis of the limited returns from the Health Service Executive.Table H10: Expenditure <strong>on</strong> Back to School Clothing & Footwear Allowance by HealthService Executive Area, 2008 and <strong>2009</strong>86HSE Area 2008 (1) <strong>2009</strong> (1)€000 €000Eastern 15,867 21,529Midland 3,335 4,535Mid-Western 3,800 5,380North Eastern 4,303 6,287North Western 3,733 5,013South Eastern 5,775 8,273Southern 7,430 9,122Western 5,389 7,048Total Expenditure 49,632 67,188(1) It should be noted that some of the totals are not equal to the sum of the parts. This is due to rounding.<str<strong>on</strong>g>Statistical</str<strong>on</strong>g> <str<strong>on</strong>g>Informati<strong>on</strong></str<strong>on</strong>g> <strong>on</strong> <strong>Social</strong> <strong>Welfare</strong> <strong>Services</strong> <strong>2009</strong>
supplementary welfare allowanceTable: H11 Number of Recip<strong>ie</strong>nts of Basic Supplementary <strong>Welfare</strong> Allowance (1)Payments by Category, <strong>2009</strong>Interim Basic Supplementary <strong>Welfare</strong> AllowanceNo of PaymentsPaymentsPending Jobseeker’s Allowance 18,016Pending Jobseeker’s Allowance Appeal 1,263Pending Jobseeker’s Benefit 1,792Pending Jobseeker’s Benefit Appeal 35Pending Disability Allowance 4,352Pending Illness Benefit 1,703Pending Illness Benefit Appeal 188Pending State Pensi<strong>on</strong> 217Pending Widows and Widower’s Pensi<strong>on</strong> 72Pending Carer’s Allowance 281Pending Occupati<strong>on</strong>al Injur<strong>ie</strong>s Benefit 57Pending One-Parent Family Payment 3,461Pending Other <strong>Social</strong> <strong>Welfare</strong> Payments 410Sub-Total 31,847Other Basic Supplementary <strong>Welfare</strong> Allowance PaymentsSick No Benefit 3,426Other Increment to Scale 507Other (2) 6,984Sub-Total 10,917Total 42,764(1) Includes DPA (Direct Provisi<strong>on</strong> Allowance)(2) This category includes payments to pers<strong>on</strong>s who do not qualify for other <strong>Social</strong> <strong>Welfare</strong> payments and whose means are below the appropriateSupplementary <strong>Welfare</strong> Allowance rates87<str<strong>on</strong>g>Statistical</str<strong>on</strong>g> <str<strong>on</strong>g>Informati<strong>on</strong></str<strong>on</strong>g> <strong>on</strong> <strong>Social</strong> <strong>Welfare</strong> <strong>Services</strong> <strong>2009</strong>
supplementary welfare allowance88Table H12: Number of Recip<strong>ie</strong>nts of Rent Supplement by Durati<strong>on</strong> (1) and by Primary Payment, <strong>2009</strong>Durati<strong>on</strong> in M<strong>on</strong>ths 0 to 3 (2) 3 to 6 6 to 9 9 to 12 12 to 18 18 to 24 24 to 30 30 to 36 36 to 48 48 to 60 60 to 72 72 plus TOTALPayment Type (3)State Pensi<strong>on</strong>s 85 138 149 127 170 151 101 85 113 85 71 292 1,567Pre-Retirement Allowance 2 3 2 2 6 7 3 3 8 4 8 65 113Widows and Widower’s Pensi<strong>on</strong>s 43 67 47 28 49 36 30 23 31 23 17 48 442One-Parent Family Payment 1,571 2,394 2,293 2,144 2,398 1,427 848 537 942 574 416 498 16,042Invalidity Pensi<strong>on</strong> 72 95 85 76 125 79 67 51 93 61 58 177 1,039Illness Benefit 360 467 415 352 409 237 110 78 106 61 29 50 2,674Disability Allowance 1,014 1,300 1,224 1,082 1,295 913 593 423 683 504 340 714 10,085L<strong>on</strong>g-Term Jobseeker’s Allowance 2,433 3,129 2,609 2,226 2,268 1,136 656 378 642 382 237 499 16,595Short-Term Jobseeker’s Allowance 1,427 1,926 1,936 1,816 1,622 671 368 178 363 209 137 209 10,862Jobseeker’s Benefit 1,787 2,256 2,308 2,203 1,390 425 159 72 73 47 28 39 10,787Supplementary <strong>Welfare</strong> Allowance 2,106 2,672 2,343 2,063 1,629 715 391 179 321 224 181 302 13,126Employment Support <strong>Services</strong> (4) 439 576 438 426 566 294 181 136 201 121 54 123 3,555DSS (UK) 30 28 25 34 47 41 30 13 31 22 9 40 350Other 678 959 897 875 850 490 276 172 226 156 96 118 5,793TOTAL 12,047 16,010 14,771 13,454 12,824 6,622 3,813 2,328 3,833 2,473 1,681 3,174 93,030(1) This represents unbroken c<strong>on</strong>tinuous claims <strong>on</strong>ly. Where recip<strong>ie</strong>nts change address, the claim at the new address may be recorded as a new claim and the durati<strong>on</strong> spent at the previous address may not be taken into account in these statistics(2) Claims with durati<strong>on</strong> of precisely 3 m<strong>on</strong>ths are recorded under the 3-6 m<strong>on</strong>ths heading, claims with durati<strong>on</strong> of precisely 6 m<strong>on</strong>ths are recorded under the 6-9 m<strong>on</strong>ths heading and so <strong>on</strong>.(3) The recip<strong>ie</strong>nt may not necessarily have been in receipt of the same Primary Payment for the durati<strong>on</strong> of the Rent Supplement claim(4) Includes Back to Work Allowance, Community Employment, Back to Educati<strong>on</strong> Allowance, VTOS and FAS<str<strong>on</strong>g>Statistical</str<strong>on</strong>g> <str<strong>on</strong>g>Informati<strong>on</strong></str<strong>on</strong>g> <strong>on</strong> <strong>Social</strong> <strong>Welfare</strong> <strong>Services</strong> <strong>2009</strong>
supplementary welfare allowanceTable H13: Number of Recip<strong>ie</strong>nts of Rent Supplement by Age and by Durati<strong>on</strong> (1) , <strong>2009</strong>Durati<strong>on</strong> in M<strong>on</strong>ths 0 to 3 (2) 3 to 6 6 to 9 9 to 12 12 to 18 18 to 24 24 to 30 30 to 36 36 to 48 48 to 60 60 to 72 72 plus TOTALAge GroupUnder 20 309 403 312 213 93 24 3 2 0 0 0 0 1,35920 - 24 2,220 3,089 2,877 2,260 1,860 842 357 177 226 88 29 4 14,02925 - 29 2,636 3,545 3,210 2,783 2,382 1,117 632 363 564 309 168 132 17,84130 - 34 2,197 2,859 2,628 2,556 2,297 1,096 615 359 609 383 236 284 16,11935 - 39 1,668 2,148 1,863 1,871 1,986 982 586 349 641 431 296 403 13,22440 - 44 1,144 1,467 1,339 1,356 1,402 817 445 301 489 325 241 405 9,73145 - 49 781 1,016 999 916 1,071 593 365 251 388 266 200 358 7,20450 - 54 504 633 665 699 731 412 278 159 289 204 153 347 5,07455 - 59 288 428 448 407 472 284 199 119 237 166 135 347 3,53060 - 64 154 205 208 207 251 186 151 108 180 126 88 316 2,18065 - 69 77 104 114 88 134 126 71 55 92 73 51 229 1,21470 plus 69 113 108 98 145 143 111 85 118 102 84 349 1,525TOTAL 12,047 16,010 14,771 13,454 12,824 6,622 3,813 2,328 3,833 2,473 1,681 3,174 93,030(1) This represents unbroken c<strong>on</strong>tinuous claims <strong>on</strong>ly. Where recip<strong>ie</strong>nts change address, the claim at the new address may be recorded as a new claim and the durati<strong>on</strong> spent at the previous address may not be taken into account in these statistics(2) Claims with durati<strong>on</strong> of precisely 3 m<strong>on</strong>ths are recorded under the 3-6 m<strong>on</strong>ths heading, claims with durati<strong>on</strong> of precisely 6 m<strong>on</strong>ths are recorded under the 6-9 m<strong>on</strong>ths heading and so <strong>on</strong>.89<str<strong>on</strong>g>Statistical</str<strong>on</strong>g> <str<strong>on</strong>g>Informati<strong>on</strong></str<strong>on</strong>g> <strong>on</strong> <strong>Social</strong> <strong>Welfare</strong> <strong>Services</strong> <strong>2009</strong>
supplementary welfare allowance90Table H14: Short Term and L<strong>on</strong>g Term recip<strong>ie</strong>nts of Rent Supplement by Primary Payment, <strong>2009</strong>All Cases Short Term 18 M<strong>on</strong>thsPayment TypeState Pensi<strong>on</strong>s 1,567 1.7% 545 0.9% 1,022 2.9%Pre-Retirement Allowance 113 0.1% 12 0.0% 101 0.3%Widows and Widower’s Pensi<strong>on</strong>s 442 0.5% 194 0.3% 248 0.7%One-Parent Family Payment 16,042 17.2% 7,015 12.1% 9,027 25.7%Invalidity Pensi<strong>on</strong> 1,039 1.1% 336 0.6% 703 2.0%Illness Benefit 2,674 2.9% 1,860 3.2% 814 2.3%Disability Allowance 10,085 10.8% 4,262 7.4% 5,823 16.6%L<strong>on</strong>g-Term Jobseeker’s Allowance 16,595 17.8% 10,177 17.6% 6,418 18.3%Short-Term Jobseeker’s Allowance 10,862 11.7% 7,879 13.6% 2,983 8.5%Jobseeker’s Benefit 10,787 11.6% 9,803 16.9% 984 2.8%Supplementary <strong>Welfare</strong> Allowance 13,126 14.1% 10,178 17.6% 2,948 8.4%Employment Support <strong>Services</strong> (1) 3,555 3.8% 1,949 3.4% 1,606 4.6%DSS (UK) 350 0.4% 150 0.3% 200 0.6%Other 5,793 6.2% 3,537 6.1% 2,256 6.4%Total 93,030 100.0% 57,897 100.0% 35,133 100.0%(1) Includes Back to Work Allowance, Community Employment, Back to Educati<strong>on</strong> Allowance, VTOS and FAS At December <strong>2009</strong> there were 93,030 households in receipt of a Rent Supplement payment, of which 34,924 are the Target group for theRental Accommodati<strong>on</strong> Scheme that have been in receipt of a payment for 18 m<strong>on</strong>ths or l<strong>on</strong>ger. This group of 34,924 is derived from an analysis of those in receipt of a Rent Supplement payment in June 2008 and in receipt of a Rent Supplementpayment at every three m<strong>on</strong>thly interval thereafter.Note: The 35,133 L<strong>on</strong>g Term cases includes Asylum Seekers that are not included in the Target group of 34,924 for transfer to the Rental Accommodati<strong>on</strong> Scheme.<str<strong>on</strong>g>Statistical</str<strong>on</strong>g> <str<strong>on</strong>g>Informati<strong>on</strong></str<strong>on</strong>g> <strong>on</strong> <strong>Social</strong> <strong>Welfare</strong> <strong>Services</strong> <strong>2009</strong>
supplementary welfare allowanceTable H15: Short Term and L<strong>on</strong>g Term recip<strong>ie</strong>nts of Rent Supplement by County, <strong>2009</strong>All CasesShort TermCasesShort Term as% All CasesL<strong>on</strong>g TermCasesCounty Recip<strong>ie</strong>nts Recip<strong>ie</strong>nts Recip<strong>ie</strong>ntsL<strong>on</strong>g Term as% All CasesCarlow 1,498 969 64.7% 529 35.3%Cavan 1,115 852 76.4% 263 23.6%Clare 1,780 1,156 64.9% 624 35.1%Cork 10,603 6,719 63.4% 3,884 36.6%D<strong>on</strong>egal 3,470 1,996 57.5% 1,474 42.5%Dublin 31,261 17,861 57.1% 13,400 42.9%Galway 4,989 3,174 63.6% 1,815 36.4%Kerry 2,398 1,450 60.5% 948 39.5%Kildare 4,161 2,463 59.2% 1,698 40.8%Kilkenny 1,472 1,069 72.6% 403 27.4%Laois 979 791 80.8% 188 19.2%Leitrim 507 347 68.4% 160 31.6%Limerick 3,669 2,427 66.1% 1,242 33.9%L<strong>on</strong>gford 789 604 76.6% 185 23.4%Louth 2,426 1,613 66.5% 813 33.5%Mayo 3,077 1,827 59.4% 1,250 40.6%Meath 2,213 1,619 73.2% 594 26.8%M<strong>on</strong>aghan 640 467 73.0% 173 27.0%Offaly 1,053 752 71.4% 301 28.6%Roscomm<strong>on</strong> 1,286 842 65.5% 444 34.5%Sligo 822 598 72.7% 224 27.3%Tipperary 2,572 1,825 71.0% 747 29.0%Waterford 2,267 1,458 64.3% 809 35.7%Westmeath 1,521 1,042 68.5% 479 31.5%Wexford 3,763 2,396 63.7% 1,367 36.3%Wicklow 2,699 1,580 58.5% 1,119 41.5%Total 93,030 57,897 62.2% 35,133 37.8%At December <strong>2009</strong> there were 93,030 households in receipt of a Rent Supplement payment, of which 34,924 are the Target group for the RentalAccommodati<strong>on</strong> Scheme that have been in receipt of a payment for 18 m<strong>on</strong>ths or l<strong>on</strong>ger. This group of 34,924 is derived from an analysis of those in receiptof a Rent Supplement payment in June 2008 and in receipt of a Rent Supplement payment at every three m<strong>on</strong>thly interval thereafter.Note: The 35,133 L<strong>on</strong>g Term cases includes Asylum Seekers that are not included in the Target group of 34,924 for transfer to the Rental Assistance Scheme.91<str<strong>on</strong>g>Statistical</str<strong>on</strong>g> <str<strong>on</strong>g>Informati<strong>on</strong></str<strong>on</strong>g> <strong>on</strong> <strong>Social</strong> <strong>Welfare</strong> <strong>Services</strong> <strong>2009</strong>
supplementary welfare allowanceTable H16: Number of Recip<strong>ie</strong>nts of Basic Supplementary <strong>Welfare</strong> Allowance, RentSupplement, Mortgage Interest Supplement and Local Authority Mortgage InterestSupplement and Other Supplements by County, <strong>2009</strong>92CountyBasicSupplementary<strong>Welfare</strong>Allowance (2)RentSupplementMortgageInterestSupplementLocalAuthorityMortgageInterestSupplementOtherSupplements (1)Carlow 616 1,498 344 8 199Cavan 595 1,115 452 1 184Clare 663 1,780 274 2 327Cork 4,570 10,603 1,471 26 2,317D<strong>on</strong>egal 1,120 3,470 303 6 149Dublin 11,578 31,261 3,684 171 5,393Galway 3,037 4,989 615 30 371Kerry 908 2,398 189 3 446Kildare 1,969 4,161 1,096 19 398Kilkenny 737 1,472 367 18 198Laois 735 979 137 13 268Leitrim 157 507 50 0 33Limerick 1,966 3,669 544 7 1,795L<strong>on</strong>gford 528 789 80 2 125Louth 1,206 2,426 345 1 200Mayo 1,475 3,077 575 19 312Meath 2,521 2,213 998 0 181M<strong>on</strong>aghan 413 640 140 3 116Offaly 535 1,053 145 0 252Roscomm<strong>on</strong> 1,173 1,286 260 3 219Sligo 651 822 46 2 46Tipperary 1,064 2,572 478 6 942Waterford 1,238 2,267 421 17 393Westmeath 978 1,521 187 2 167Wexford 1,542 3,763 962 24 389Wicklow 800 2,699 553 2 343Total 42,775 93,030 14,716 385 15,763(1) Includes D<strong>ie</strong>t, Other, Travel, etc.(2) Includes DPA (Direct Provisi<strong>on</strong> Allowance)<str<strong>on</strong>g>Statistical</str<strong>on</strong>g> <str<strong>on</strong>g>Informati<strong>on</strong></str<strong>on</strong>g> <strong>on</strong> <strong>Social</strong> <strong>Welfare</strong> <strong>Services</strong> <strong>2009</strong>
Secti<strong>on</strong> JMiscellaneous Payments and Grants
miscellaneous payments and grantsSecti<strong>on</strong> J: Miscellaneous Payments and GrantsThis programme group c<strong>on</strong>tains details of a range of payments and services provided by the Department of<strong>Social</strong> Protecti<strong>on</strong>, including:• Treatment Benefits• Household Benefits and Free Travel• Bereavement Grants• Redundancy and Insolvency Payments• Citizens <str<strong>on</strong>g>Informati<strong>on</strong></str<strong>on</strong>g> Board (formerly Comhairle)• School Meals• M<strong>on</strong>ey Advice and Budgeting ServiceAlso included in this Secti<strong>on</strong> are details of methods of payments for benefits and allowances which areprocessed by the Department of <strong>Social</strong> Protecti<strong>on</strong> <strong>on</strong> a day to day basis and details of Pers<strong>on</strong>al Public Service(PPS) Numbers issued for the last ten years by nati<strong>on</strong>ality.Graph J1: Expenditure <strong>on</strong> Household Benefits, Free Travel and Fuel Allowance, <strong>2009</strong>94Fuel Allowance 30.9%Electricity Allowance 26.4%Teleph<strong>on</strong>e Allowance 19.2%Bottled Gas Refill/Natural Gas Allowance 2.8%Televisi<strong>on</strong> Licence 8.9%Free Travel 11.7%<str<strong>on</strong>g>Statistical</str<strong>on</strong>g> <str<strong>on</strong>g>Informati<strong>on</strong></str<strong>on</strong>g> <strong>on</strong> <strong>Social</strong> <strong>Welfare</strong> <strong>Services</strong> <strong>2009</strong>
miscellaneous payments and grantsTable J1: Expenditure <strong>on</strong> Miscellaneous Payments and Grants by Payment type, 2008and <strong>2009</strong>Type of Payment 2008 <strong>2009</strong> (1) Change <strong>2009</strong> over 2008€000 €000Household Benefits, Free Travel, and578,688 626,219 8.2%Fuel AllowanceTreatment Benefit 97,124 100,179 3.1%Bereavement Grants 17,851 18,471 3.5%Rent Allowance 732 725 -1.0%Combat Poverty Agency 4,114 1,564 -62.0%School Meals 32,422 34,848 7.5%Citizens <str<strong>on</strong>g>Informati<strong>on</strong></str<strong>on</strong>g> Board (formerly29,468 28,005 -5.0%Comhairle)M<strong>on</strong>ey Advice and Budgeting Service 16,217 17,041 5.1%Other Grants/Payments 6,869 2,695 -60.8%Total 783,485 829,747 5.9%(1) Provisi<strong>on</strong>alTable J2: Total Expenditure <strong>on</strong> Household Benefits, Free Travel and Fuel Allowance,2000 to <strong>2009</strong>ElectricityAllowanceTelevisi<strong>on</strong>LicenceAllowanceTeleph<strong>on</strong>eAllowanceBottledGasAllowanceNaturalGasAllowanceFreeTravelFuelAllowanceTotal€000 €000 €000 €000 €000 €000 €000 €0002000 40,185 20,199 41,660 88 1,918 44,817 55,487 204,3542001 51,275 24,773 55,335 99 2,517 45,860 61,136 240,9952002 62,648 30,967 72,887 108 3,276 45,625 80,532 296,0432003 75,402 43,801 83,258 120 4,905 49,820 83,208 340,5142004 87,992 47,859 85,697 116 5,498 52,400 84,710 364,2722005 103,919 46,224 89,143 108 6,316 55,333 82,386 383,4292006 108,323 48,966 90,333 116 8,399 58,042 130,250 444,4292007 147,225 51,672 98,855 116 15,243 64,125 158,289 535,5252008 156,738 55,698 112,190 95 15,531 68,428 170,008 578,688<strong>2009</strong> (1) 165,515 55,712 120,180 742 16,957 73,489 193,624 626,219(1) Provisi<strong>on</strong>al.95Table J3: Miscellaneous Benefits and Allowances: Number of Claims Awarded, 2008and <strong>2009</strong>Type of Payment 2008 <strong>2009</strong> Change <strong>2009</strong> over 2008Bereavement Grants 22,827 18,719 -18.0%Treatment Benefit:Dental 675,578 733,562 8.6%Optical 220,379 240,817 9.3%Medical and Surgical 6,505 7,506 15.4%Rent Allowance 8 6 -25.0%Fuel Allowance (1) 300,000 318,000 6.0%(1) Refers to the number of recip<strong>ie</strong>nts of Fuel Allowance during 2008 and <strong>2009</strong>. There was an average of 120,000 recip<strong>ie</strong>nts of Smokeless Fuel Allowance in2008 and an average of 123,000 recip<strong>ie</strong>nts in <strong>2009</strong><str<strong>on</strong>g>Statistical</str<strong>on</strong>g> <str<strong>on</strong>g>Informati<strong>on</strong></str<strong>on</strong>g> <strong>on</strong> <strong>Social</strong> <strong>Welfare</strong> <strong>Services</strong> <strong>2009</strong>
miscellaneous payments and grantsTable J4: Number of Recip<strong>ie</strong>nts of Household Benefits by Type of Payment Received,<strong>2009</strong>Type of PaymentFreeElectricityAllowanceFreeTelevisi<strong>on</strong>LicenceFreeTeleph<strong>on</strong>eRentalFreeBottledGasFreeNaturalGasFreeTravelState Pensi<strong>on</strong> (C<strong>on</strong>tributory) 127,683 147,180 141,410 145 18,115 219,647State Pensi<strong>on</strong>(N<strong>on</strong>-C<strong>on</strong>tributory)55,792 58,996 55,711 147 2,048 96,580State Pensi<strong>on</strong> (Transiti<strong>on</strong>) 170 196 189 0 24 634Widow/er’s (C<strong>on</strong>tributory)Pensi<strong>on</strong>Widow/er’s (N<strong>on</strong>-C<strong>on</strong>tributory)Pensi<strong>on</strong>55,719 64,049 62,333 41 7,691 74,981229 244 240 1 13 218Invalidity Pensi<strong>on</strong> 18,414 21,006 19,359 64 2,359 48,022Deserted Wife’s Allowance 23 24 23 0 1 33Deserted Wife’s Benefit 940 1,191 1,143 5 236 1,643One Parent Family Payment 0 0 8 0 0 30Occupati<strong>on</strong>al Injury Benefit 266 316 307 0 48 337Free Fuel 1,067 1,083 1,061 1 12 1,045Blind Pensi<strong>on</strong> 521 571 426 0 39 1,36996Carer’s Allowance 21,006 24,079 23,484 219 2,615 42,953Disability Allowance 31,996 35,741 31,531 364 2,620 95,813Others 23,298 26,466 25,386 43 2,359 95,172Total 337,124 381,142 362,611 1,030 38,180 678,477<str<strong>on</strong>g>Statistical</str<strong>on</strong>g> <str<strong>on</strong>g>Informati<strong>on</strong></str<strong>on</strong>g> <strong>on</strong> <strong>Social</strong> <strong>Welfare</strong> <strong>Services</strong> <strong>2009</strong>
miscellaneous payments and grantsGraph J2: Recip<strong>ie</strong>nts of <strong>Social</strong> <strong>Welfare</strong> Payments by Method of Payment, <strong>2009</strong>Pers<strong>on</strong>alised Payable Order 0.0%Cheque 6.5%Electr<strong>on</strong>ic Fund Transfer 44.4%Post Draft 49.1%Graph J3 Pers<strong>on</strong>al Public Service Numbers Issued, 2000 to <strong>2009</strong>160,000140,000120,000100,00080,0009760,00040,00020,0000200020012002200320042005200620072008<strong>2009</strong>EU Accessi<strong>on</strong> 12 Countr<strong>ie</strong>sOther EU Countr<strong>ie</strong>sIrelandN<strong>on</strong>-EU Countr<strong>ie</strong>s<str<strong>on</strong>g>Statistical</str<strong>on</strong>g> <str<strong>on</strong>g>Informati<strong>on</strong></str<strong>on</strong>g> <strong>on</strong> <strong>Social</strong> <strong>Welfare</strong> <strong>Services</strong> <strong>2009</strong>
miscellaneous payments and grantsTable J5: Number of Recip<strong>ie</strong>nts of <strong>Social</strong> <strong>Welfare</strong> Payments by Payment Type andMethod of Payment, <strong>2009</strong>Type of PaymentPers<strong>on</strong>alisedPayableOrderChequeElectr<strong>on</strong>icFund TransferPost DraftState Pensi<strong>on</strong>(C<strong>on</strong>tributory) 4 781 144,486 119,831 265,102State Pensi<strong>on</strong>(Transiti<strong>on</strong>) 0 2 5,847 2,529 8,378State Pensi<strong>on</strong>(N<strong>on</strong>-C<strong>on</strong>tributory) 0 20 23,417 74,361 97,798Pre-Retirement Allowance 0 118 2,519 4,831 7,468TotalWidow/er’s (C<strong>on</strong>tributory) Pensi<strong>on</strong> 0 589 44,785 67,734 113,108Widow’s (N<strong>on</strong>-C<strong>on</strong>tributory) Pensi<strong>on</strong> 0 0 545 1,453 1,998Deserted Wife’s Benefit 0 0 2,142 6,595 8,737Deserted Wife’s Allowance 0 0 106 444 550One-Parent Family Payment 0 46 44,370 46,068 90,484Maternity Benefit 0 1,540 21,754 0 23,294Health and Safety Benefit 0 3 46 0 49Adoptive Benefit 0 6 58 0 64Guardian’s Payment(C<strong>on</strong>tributory) 0 1 370 489 860Guardian’s Payment(N<strong>on</strong>-C<strong>on</strong>tributory) 0 0 155 265 420Child Benefit (Famil<strong>ie</strong>s) 0 0 361,973 240,959 602,93298Illness Benefit 0 33,383 44,006 276 77,665Invalidity Pensi<strong>on</strong> 0 17 24,490 28,415 52,922Injury Benefit 0 386 340 0 726Interim Illness Benefit 0 165 153 0 318Disablement Pensi<strong>on</strong> 0 3,877 9,643 0 13,520Death Benefit 0 5 157 475 637Disability Allowance 0 2 38,852 60,722 99,576Carer’s Benefit 0 0 1,726 191 1,917Carer’s Allowance 0 0 18,818 29,405 48,223Blind Pensi<strong>on</strong> 0 0 610 857 1,467Jobseeker’s Benefit 0 59,603 4,035 96,483 160,121Jobseeker’s Allowance 0 16,730 34,961 151,557 203,248Back to Work Allowance Employee 0 4 1,988 20 2,012Back to Work Enterprise Allowance 0 3 4,554 34 4,591Back to Educati<strong>on</strong> Allowance 0 33 14,317 1,527 15,877Part-Time Job Incentive Scheme 0 173 0 0 173Family Income Supplement 0 1,644 24,240 79 25,963Farm Assist 0 70 3,832 5,070 8,972Supplementary <strong>Welfare</strong> Allowance 0 8,991 1,672 32,112 42,775Rent Allowance 0 192 0 0 192Total 4 128,384 880,967 972,782 1,982,137
miscellaneous payments and grantsTable J6: Pers<strong>on</strong>al Public Service Numbers Issued by Country, 2000 to <strong>2009</strong>Country of origin/ 2000 (1) 2001 2002 2003 2004 2005 2006 2007 2008 <strong>2009</strong> Totaldeclared nati<strong>on</strong>alityEU Countr<strong>ie</strong>sAustria 638 919 545 519 851 655 769 814 670 338 6,718Belgium 221 443 424 478 383 415 506 523 466 288 4,147Bulgaria (2) 160 512 427 374 104 98 267 1,008 772 277 3,999Cyprus (3) 6 12 8 6 27 23 33 43 19 26 203Czech Republic (3) 641 1,428 1,144 831 3,298 4,505 4,458 3,838 2,762 901 23,806Denmark 245 367 279 285 267 314 286 338 349 209 2,939Est<strong>on</strong>ia (3) 212 858 463 546 1,788 2,011 1,407 648 572 428 8,933Finland 381 568 441 384 346 469 508 473 372 153 4,095France 3,058 4,491 3,772 4,333 4,683 4,973 6,880 7,673 7,066 3,109 50,038Germany 1,621 2,695 2,547 2,877 3,147 3,839 4,605 4,534 3,823 2,090 31,778Greece 139 134 117 116 158 169 207 167 168 100 1,475Hungary (3) 167 511 259 185 1,839 3,086 4,330 5,046 4,562 1,794 21,779Ireland (4) 59,592 127,111 127,067 109,064 95,386 85,616 84,740 90,238 92,999 86,748 958,561Italy 1,672 2,544 2,507 2,763 2,927 3,692 4,222 4,715 4,428 2,237 31,707Latvia (3) 1,046 3,023 1,538 1,230 6,266 9,328 7,954 4,674 3,727 3,916 42,702Lithuania (3) 642 2,735 2,782 2,379 12,817 18,717 16,039 10,728 6,443 3,768 77,050Luxembourg 28 28 45 36 12 21 18 10 19 15 232Malta (3) 137 237 209 191 205 124 143 161 132 69 1,608Netherlands 471 861 776 757 924 970 1,104 1,051 904 647 8,465Poland (3) 570 2,259 2,649 3,828 27,295 64,731 93,787 79,816 42,554 13,794 331,283Portugal 554 788 419 725 680 791 935 1,517 2,125 1,125 9,659Romania (3) 920 2,416 2,667 1,387 591 813 3,336 14,525 6,762 2,624 36,041Slovakia (3) 111 328 252 248 5,187 9,258 10,687 8,375 4,994 1,784 41,224Slovenia (3) 3 1 2 7 64 76 101 63 87 40 444Spain 3,796 5,800 5,687 4,920 4,456 4,670 4,433 4,691 4,618 2,595 45,666Sweden 872 1,451 949 1,017 943 1,102 1,103 932 757 481 9,607United Kingdom 11,446 20,391 18,915 18,474 18,545 20,655 22,283 22,040 19,707 13,996 186,452Total EU 89,349 182,911 176,890 157,960 193,189 241,121 275,141 268,641 211,857 143,552 1,940,611N<strong>on</strong>-EU Countr<strong>ie</strong>sUnited States ofAmerica1,222 2,645 2,736 3,010 3,195 3,811 4,079 3,841 3,504 2,544 28,043India 394 1,522 1,591 1,422 1,887 3,407 5,580 4,778 4,332 2,249 24,913China 1,468 5,748 4,839 3,762 3,471 1,756 1,418 1,519 1,685 1,266 25,666Nigeria 1,890 3,813 5,417 3,795 1,973 2,168 1,623 1,610 1,545 888 23,834Brazil 384 660 759 725 864 2,225 3,460 4,805 5,632 2,741 19,514Australia 1,027 2,874 2,656 2,421 1,713 2,128 2,105 1,966 1,857 1,013 18,747Philippinnes 682 3,526 2,540 2,064 1,227 1,499 1,884 1,624 1,440 695 16,486South Africa 762 3,075 2,195 1,869 1,013 1,060 1,126 1,046 1,105 678 13,251Pakistan 297 1,146 1,091 1,350 1,114 1,024 1,425 1,439 812 868 9,698New Zealand 572 1,462 1,408 1,016 896 923 1,010 886 819 413 8,992Canada 737 1,019 733 754 866 970 1,161 1,071 1,213 841 8,524Mauritius 4 32 46 125 158 473 1,938 1,989 1,431 887 6,196Russia 677 1,649 1,167 658 559 473 464 398 358 258 6,403Ukraine 241 1,267 1,421 1,282 489 378 405 394 467 302 6,344Malaysia 246 527 341 349 301 523 636 744 656 436 4,323Republic of Korea 6 60 134 148 272 461 491 948 1,147 431 3,667Moldova 160 600 651 563 214 194 294 409 300 252 3,385Bangladesh 66 454 486 655 347 209 456 405 240 167 3,318Other 2,572 6,966 8,435 7,637 6,206 6,399 7,154 7,097 6,925 5,414 64,805Total N<strong>on</strong>-EU 13,407 39,045 38,646 33,605 26,765 30,081 36,709 36,969 35,468 22,343 296,109Total 102,756 221,956 215,536 191,565 219,954 271,202 311,850 305,610 247,325 165,895 2,236,720(1) Data for 2000 from 19 June 2000 when DSFA assumed resp<strong>on</strong>sibility for issuing PPS numbers. (2) Joined the EU <strong>on</strong> 1 January 2007.(3) Joined the EU <strong>on</strong> 1 May 2004 (4) Also c<strong>on</strong>tains those classif<strong>ie</strong>d as other and unknown.Note: EU Countr<strong>ie</strong>s are shown in alphabetical order while N<strong>on</strong>-EU Countr<strong>ie</strong>s are shown in order of total PPS numbers issued.99<str<strong>on</strong>g>Statistical</str<strong>on</strong>g> <str<strong>on</strong>g>Informati<strong>on</strong></str<strong>on</strong>g> <strong>on</strong> <strong>Social</strong> <strong>Welfare</strong> <strong>Services</strong> <strong>2009</strong>
100APPENDICES<str<strong>on</strong>g>Statistical</str<strong>on</strong>g> <str<strong>on</strong>g>Informati<strong>on</strong></str<strong>on</strong>g> <strong>on</strong> <strong>Social</strong> <strong>Welfare</strong> <strong>Services</strong> <strong>2009</strong>
appendices101APPENDICES<str<strong>on</strong>g>Statistical</str<strong>on</strong>g> <str<strong>on</strong>g>Informati<strong>on</strong></str<strong>on</strong>g> <strong>on</strong> <strong>Social</strong> <strong>Welfare</strong> <strong>Services</strong> <strong>2009</strong>
appendix 1Appendix 1: <strong>Social</strong> Insurance and <strong>Social</strong> AssistanceThe Department of <strong>Social</strong> Protecti<strong>on</strong> provides a range of payments which can be classif<strong>ie</strong>d as follows.<strong>Social</strong> InsurancePayments made under the social insurance system are funded, in part, by c<strong>on</strong>tributi<strong>on</strong>s from employers, employees andthe self-employed. Any deficit in the fund is met by Exchequer subventi<strong>on</strong>. Entitlement to social insurance benefits isc<strong>on</strong>diti<strong>on</strong>al up<strong>on</strong> the claimants having a certain number of c<strong>on</strong>tributi<strong>on</strong>s paid or credited in a specific period of time.The c<strong>on</strong>tributi<strong>on</strong>s c<strong>on</strong>diti<strong>on</strong>s vary according to the different insurance schemes.<strong>Social</strong> Insurance schemes comprise State Pensi<strong>on</strong> (C<strong>on</strong>tributory), State Pensi<strong>on</strong> (Transiti<strong>on</strong>), Widow/er’s (C<strong>on</strong>tributory)Pensi<strong>on</strong>, Guardian’s Payment (C<strong>on</strong>tributory), Deserted Wife’s Benefit, Invalidity Pensi<strong>on</strong>, Illness Benefit, DisablementPensi<strong>on</strong>, Carer’s Benefit, Jobseeker’s Benefit, Maternity Benefit, Health and Safety Benefit, Adoptive Benefit, TreatmentBenefit, Widowed Parent Grant, Bereavement Grants and Household Benefits and Free Travel.<strong>Social</strong> Assistance102<strong>Social</strong> Assistance schemes are financed entirely by the Exchequer. One of the basic requirements to qualify for paymentunder the social assistance schemes is that the claimant must satisfy a means test.<strong>Social</strong> Assistance schemes comprise State Pensi<strong>on</strong> (N<strong>on</strong>-C<strong>on</strong>tributory), Widow’s (N<strong>on</strong>-C<strong>on</strong>tributory) Pensi<strong>on</strong>, Guardian’sPayment (N<strong>on</strong>-C<strong>on</strong>tributory), Deserted Wife’s Allowance, Pris<strong>on</strong>er’s Wife’s Allowance, One Parent Family Payment,Jobseeker’s Allowance, Farm Assist, Pre-Retirement Allowance, Supplementary <strong>Welfare</strong> Allowance, Family IncomeSupplement, Disability Allowance, Carer’s Allowance, Blind Pensi<strong>on</strong>, Rent Allowance and Household Benefits and FreeTravel.Child BenefitChild Benefit is funded entirely by the Exchequer; it is payable in respect of all children regardless of family means.<str<strong>on</strong>g>Statistical</str<strong>on</strong>g> <str<strong>on</strong>g>Informati<strong>on</strong></str<strong>on</strong>g> <strong>on</strong> <strong>Social</strong> <strong>Welfare</strong> <strong>Services</strong> <strong>2009</strong>
appendix 2Appendix 2: Classificati<strong>on</strong> of <strong>Social</strong> <strong>Welfare</strong>Schemes1. Older People5. Jobseeker’s SupportsState Pensi<strong>on</strong> (C<strong>on</strong>tributory)State Pensi<strong>on</strong> (Transiti<strong>on</strong>)State Pensi<strong>on</strong> (N<strong>on</strong>-C<strong>on</strong>tributory)Pre-Retirement Allowance2. Widows, Widowers andOne-Parent Famil<strong>ie</strong>sWidow/er’s (C<strong>on</strong>tributory) Pensi<strong>on</strong>Deserted Wife’s BenefitWidow/er’s (N<strong>on</strong>-C<strong>on</strong>tributory) Pensi<strong>on</strong>Deserted Wife’s AllowancePris<strong>on</strong>er’s Wife’s AllowanceOne Parent Family PaymentWidowed Parent Grant3. Child Related PaymentsMaternity BenefitAdoptive BenefitHealth and Safety BenefitGuardian’s Payment (C<strong>on</strong>tributory)Guardian’s Payment (N<strong>on</strong>-C<strong>on</strong>tributory)Child BenefitDomiciliary Care AllowanceJobseeker’s BenefitJobseeker’s Allowance6. Employment SupportsFamily Income SupplementBack to Work AllowanceBack to Work Enterprise AllowanceBack to Educati<strong>on</strong> AllowancePart-Time Job Incentive SchemeFarm Assist7. Supplementary <strong>Welfare</strong> AllowanceBasic PaymentsRent and Mortgage Interest SupplementsHeating and D<strong>ie</strong>t SupplementsExcepti<strong>on</strong>al and Urgent Needs PaymentsThe Back to School Clothing and FootwearScheme8. Miscellaneous Payments AndGrants1034. Illness, Disability And CaringIllness BenefitInvalidity Pensi<strong>on</strong>Disability AllowanceBlind Pensi<strong>on</strong>Carer’s BenefitCarer’s AllowanceInjury BenefitDisablement BenefitDeath BenefitMedical Care<str<strong>on</strong>g>Statistical</str<strong>on</strong>g> <str<strong>on</strong>g>Informati<strong>on</strong></str<strong>on</strong>g> <strong>on</strong> <strong>Social</strong> <strong>Welfare</strong> <strong>Services</strong> <strong>2009</strong>Treatment BenefitsHousehold Benefits and Free TravelBereavement GrantsM<strong>on</strong>ey Advice and Budgeting Service
appendix 3Appendix 3: GlossaryRecip<strong>ie</strong>nt:Pers<strong>on</strong> actually receiving a social welfare payment.Qualif<strong>ie</strong>d adult:Pers<strong>on</strong> in respect of whom a Qualif<strong>ie</strong>d Adult Increase is paid to therecip<strong>ie</strong>nt.Qualif<strong>ie</strong>d child:Child in respect of whom an Increase for a Qualif<strong>ie</strong>d Child is paid to therecip<strong>ie</strong>nt. This allowance is payable at half the rate where a spouse/partner, living with the recip<strong>ie</strong>nt, is not a Qualif<strong>ie</strong>d Adult. Eachspouse/partner may receive half the Increase for a Qualif<strong>ie</strong>d Childwhere both are in receipt of a social welfare payment.Beneficiar<strong>ie</strong>s:Total number of recip<strong>ie</strong>nts, qualif<strong>ie</strong>d adults and qualif<strong>ie</strong>d children.Claim/claimant:An applicati<strong>on</strong>/applicant for a social welfare payment.104<strong>Social</strong> Insurance Payments:<strong>Social</strong> Assistance Payments:These comprise State Pensi<strong>on</strong> (C<strong>on</strong>tributory), State Pensi<strong>on</strong> (Transiti<strong>on</strong>),Widow/er’s (C<strong>on</strong>tributory) Pensi<strong>on</strong>, Guardian’s Payment (C<strong>on</strong>tributory),Deserted Wife’s Benefit, Invalidity Pensi<strong>on</strong>, Illness Benefit, Carer’sBenefit, Jobseeker’s Benefit, Maternity Benefit, Health and Safety Benefit,Adoptive Benefit, Treatment Benefit, Widowed Parent Grant, BereavementGrants and Household Benefits and Free Travel.These comprise State Pensi<strong>on</strong> (N<strong>on</strong>-C<strong>on</strong>tributory), Widow/er’s (N<strong>on</strong>-C<strong>on</strong>tributory) Pensi<strong>on</strong>, Guardian’s Payment (N<strong>on</strong>-C<strong>on</strong>tributory), DesertedWife’s Allowance, Pris<strong>on</strong>er’s Wife’s Allowance, One Parent Family Payment,Jobseeker’s Allowance, Farm Assist, Pre-Retirement Allowance,Supplementary <strong>Welfare</strong> Allowance, Family Income Supplement, DisabilityAllowance, Carer’s Allowance, Blind Pensi<strong>on</strong>, Rent Allowance andHousehold Benefits and Free Travel.<str<strong>on</strong>g>Statistical</str<strong>on</strong>g> <str<strong>on</strong>g>Informati<strong>on</strong></str<strong>on</strong>g> <strong>on</strong> <strong>Social</strong> <strong>Welfare</strong> <strong>Services</strong> <strong>2009</strong>
appendix 4Appendix 4: Details of Scheme ChangesThe new State Pensi<strong>on</strong> (N<strong>on</strong>-C<strong>on</strong>tributory) was introduced in September 2006 replacing the Old Age (N<strong>on</strong>-C<strong>on</strong>tributory) Pensi<strong>on</strong> and, for recip<strong>ie</strong>nts aged 66 and over, Blind Pensi<strong>on</strong>, Widow/er’s Pensi<strong>on</strong>, One ParentFamily Payment, Deserted Wife’s Allowance and Pris<strong>on</strong>er’s Wife’s Allowance. Qualif<strong>ie</strong>d Adults of a State Pensi<strong>on</strong>(N<strong>on</strong>-C<strong>on</strong>tributory) aged over 66 also qualif<strong>ie</strong>d for a pensi<strong>on</strong> in their own right.Also effective from September 2006 recip<strong>ie</strong>nts of Invalidity Pensi<strong>on</strong> aged 66 years or over were automaticallytransferred to State Pensi<strong>on</strong> (C<strong>on</strong>tributory).These changes will affect the comparability of different year’s figures in Secti<strong>on</strong> B, Older People, Secti<strong>on</strong> C,Widows, Widowers and One Parent Famil<strong>ie</strong>s and Secti<strong>on</strong> E, Illness, Disability and Caring.Scheme Name ChangesEffective from September 2006 scheme names were changed as follows:Previous Name of SchemeNew Name of SchemeOld Age (C<strong>on</strong>tributory) Pensi<strong>on</strong>State Pensi<strong>on</strong> (C<strong>on</strong>tributory)Old Age (N<strong>on</strong>-C<strong>on</strong>tributory) Pensi<strong>on</strong>State Pensi<strong>on</strong> (N<strong>on</strong>-C<strong>on</strong>tributory)Retirement Pensi<strong>on</strong>State Pensi<strong>on</strong> (Transiti<strong>on</strong>)Unemployment BenefitJobseeker’s BenefitUnemployment AssistanceJobseeker’s AllowanceUnemployability SupplementIncapacity SupplementDisability BenefitIllness BenefitOrphan’s (C<strong>on</strong>tributory) Allowance Guardian’s Payment (C<strong>on</strong>tributory) (1)Orphan’s (N<strong>on</strong>-C<strong>on</strong>tributory) Allowance Guardian’s Payment (N<strong>on</strong>-C<strong>on</strong>tributory) (1)105(1) Scheme name changed effective from July 2006<str<strong>on</strong>g>Statistical</str<strong>on</strong>g> <str<strong>on</strong>g>Informati<strong>on</strong></str<strong>on</strong>g> <strong>on</strong> <strong>Social</strong> <strong>Welfare</strong> <strong>Services</strong> <strong>2009</strong>
older summary people and financial106www.welfare.<strong>ie</strong><str<strong>on</strong>g>Statistical</str<strong>on</strong>g> <str<strong>on</strong>g>Informati<strong>on</strong></str<strong>on</strong>g> <strong>on</strong> <strong>Social</strong> <strong>Welfare</strong> <strong>Services</strong> <strong>2009</strong>