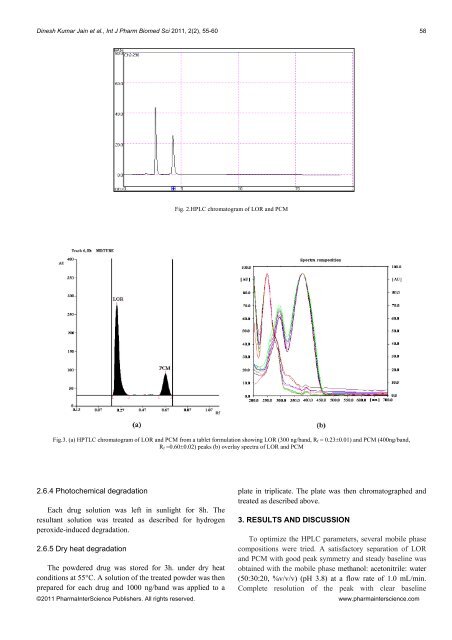
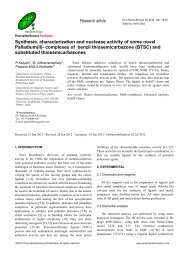
Dinesh Kumar Jain et al., Int J Pharm Biomed Sci 2011, 2(2), 55-6058Fig. 2.HPLC chromatogram <strong>of</strong> LOR <strong>and</strong> PCMFig.3. (a) <strong>HPTLC</strong> chromatogram <strong>of</strong> LOR <strong>and</strong> PCM from a tablet formulation showing LOR (300 ng/b<strong>and</strong>, R f = 0.23±0.01) <strong>and</strong> PCM (400ng/b<strong>and</strong>,R f =0.60±0.02) peaks (b) overlay spectra <strong>of</strong> LOR <strong>and</strong> PCM2.6.4 Photochemical degradationEach drug solution was left in sunlight for 8h. Theresultant solution was treated as described for hydrogenperoxide-induced degradation.2.6.5 Dry heat degradationThe powdered drug was stored for 3h. under dry heatconditions at 55°C. A solution <strong>of</strong> the treated powder was thenprepared for each drug <strong>and</strong> 1000 ng/b<strong>and</strong> was applied to aplate in triplicate. The plate was then chromatographed <strong>and</strong>treated as described above.3. RESULTS AND DISCUSSIONTo optimize the HPLC parameters, several mobile phasecompositions were tried. A satisfactory separation <strong>of</strong> LOR<strong>and</strong> PCM with good peak symmetry <strong>and</strong> steady baseline wasobtained with the mobile phase methanol: acetonitrile: water(50:30:20, %v/v/v) (pH 3.8) at a flow rate <strong>of</strong> 1.0 mL/min.Complete resolution <strong>of</strong> the peak with clear baseline©2011 PharmaInterScience Publishers. All rights reserved. www.pharmainterscience.com
Dinesh Kumar Jain et al., Int J Pharm Biomed Sci 2011, 2(2), 55-6059Table 3Assay result <strong>of</strong> marketed formulationS. No. Actual concentration (mg) Concentration found (mg) % ContentLOR PCM LOR PCM LOR PCM1 300 400 302.43±4.22 400.31±1.64 101.02±1.34 100.08±1.92Table 4Forced degradation studiesSample exposure conditions LOR PCMNumber <strong>of</strong> degradation products % Recovery (n=3) Number <strong>of</strong> degradation products % Recovery (n=3)(R f value)(R f value)1 M HCl,8h, RT 3 (0.28,0.72, 0.88) 89.23 ±2.17 2 (0.75,0.88) 96.02 ±3.541 M NaOH, 8h, RT 4 (0.01,0.04, 0.72,0.88) 79.0 ±2.94 1(0.4) 76.05 ±1.3710%,H 2 O 2 , 8h, RT 2 (0.71,0.87) 74.34 ±7.15 2(0.40,0.64) 75.14 ±0.82Sunlight, 8h 1(0.76) 45.2 ±1.91 1 (0.79) 13.53 ±1.31Heat, 3h, 55°C 2 (0.31,0.75) 99.67 ±2.43 2 (0.76,0.96) 93.75 ±0.84a) b)Fig.4. <strong>HPTLC</strong> chromatogram obtained from forced degradation studies (a) acid degradation (1 M HCl, 8h, RT) showing 3 degradants at R f values 0.28, 0.72,0.88 for LOR <strong>and</strong> 2 degradants at R f values 0.75, 0.88 for PCM <strong>and</strong> (b) base degradation (1 M NaOH, 8h, RT) showing 4 degradants at R f values 0.01, 0.04,0.72, 0.88 for LOR <strong>and</strong> 1 degradant at R f value 0.4 for PCMseparation was obtained at 290 nm (Fig.2). The systemsuitability test parameters are shown in Table 1.In the development <strong>of</strong> <strong>HPTLC</strong> <strong>method</strong>, the mixture <strong>of</strong>chlor<strong>of</strong>orm:methanol:ethyl acetate:ammonia (20:15:55:10, %v/v/v/v) was selected as a mobile phase as it could resolveLOR <strong>and</strong> PCM spots with a better peak shape <strong>and</strong> <strong>of</strong>fered anoptimum separation at R f 0.23 ± 0.01 <strong>and</strong> 0.60 ± 0.02 (n=6)for LOR <strong>and</strong> PCM respectively (Fig.3a).Linear correlation was obtained in the range <strong>of</strong> 2-10μg/mL <strong>and</strong> 5-100 μg/mL for the HPLC <strong>method</strong> <strong>and</strong> 300-550ng/b<strong>and</strong> <strong>and</strong> 100-500 ng/b<strong>and</strong> for <strong>HPTLC</strong> <strong>method</strong> for LOR<strong>and</strong> PCM, respectively. The average linear regressionequation was represented as Y = 10.348X + 1226.7 for LOR,<strong>and</strong> Y = 4.665X + 137.04 for PCM, where X is theconcentration <strong>of</strong> drug <strong>and</strong> Y is the peak area. The overlayspectra <strong>of</strong> LOR, PCM are shown in Fig.3b. The repeatability<strong>of</strong> the <strong>method</strong> was checked by spotting 4 μL <strong>of</strong> a combinedst<strong>and</strong>ard solution six times on the plate (n= 6); the RSD forthe peak area was found to be 0.72 <strong>and</strong> 1.2 for LOR <strong>and</strong>PCM using HPLC <strong>and</strong> 1.24 <strong>and</strong> 1.02 for LOR <strong>and</strong> PCM for<strong>HPTLC</strong>. The intra-day <strong>and</strong> inter-day The RSD values werefound to be