Development and validation of a stability-indicating HPTLC method ...
Development and validation of a stability-indicating HPTLC method ...
Development and validation of a stability-indicating HPTLC method ...

Create successful ePaper yourself
Turn your PDF publications into a flip-book with our unique Google optimized e-Paper software.
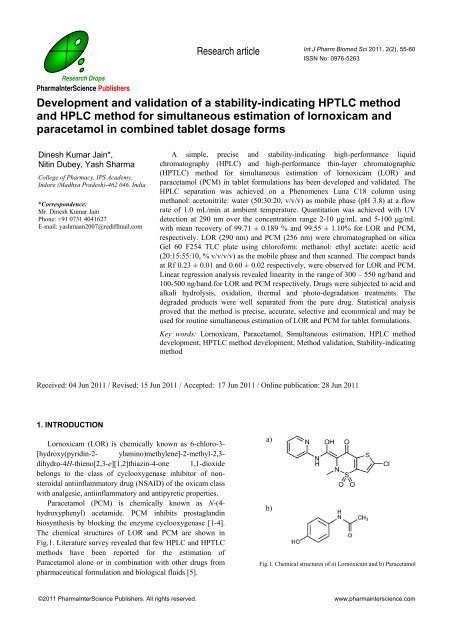
Research articleInt J Pharm Biomed Sci 2011, 2(2), 55-60ISSN No: 0976-5263Research DropsPharmaInterScience Publishers<strong>Development</strong> <strong>and</strong> <strong>validation</strong> <strong>of</strong> a <strong>stability</strong>-<strong>indicating</strong> <strong>HPTLC</strong> <strong>method</strong><strong>and</strong> HPLC <strong>method</strong> for simultaneous estimation <strong>of</strong> lornoxicam <strong>and</strong>paracetamol in combined tablet dosage formsDinesh Kumar Jain*,Nitin Dubey, Yash SharmaCollege <strong>of</strong> Pharmacy, IPS Academy,Indore (Madhya Pradesh)-462 046, India*Correspondence:Mr. Dinesh Kumar JainPhone: +91 0731 4041627E-mail: yashmaan2007@rediffmail.comA simple, precise <strong>and</strong> <strong>stability</strong>-<strong>indicating</strong> high-performance liquidchromatography (HPLC) <strong>and</strong> high-performance thin-layer chromatographic(<strong>HPTLC</strong>) <strong>method</strong> for simultaneous estimation <strong>of</strong> lornoxicam (LOR) <strong>and</strong>paracetamol (PCM) in tablet formulations has been developed <strong>and</strong> validated. TheHPLC separation was achieved on a Phenomenex Luna C18 column usingmethanol: acetonitrile: water (50:30:20, v/v/v) as mobile phase (pH 3.8) at a flowrate <strong>of</strong> 1.0 mL/min at ambient temperature. Quantitation was achieved with UVdetection at 290 nm over the concentration range 2-10 μg/mL <strong>and</strong> 5-100 μg/mLwith mean recovery <strong>of</strong> 99.71 ± 0.189 % <strong>and</strong> 99.55 ± 1.10% for LOR <strong>and</strong> PCM,respectively. LOR (290 nm) <strong>and</strong> PCM (256 nm) were chromatographed on silicaGel 60 F254 TLC plate using chlor<strong>of</strong>orm: methanol: ethyl acetate: acetic acid(20:15:55:10, % v/v/v/v) as the mobile phase <strong>and</strong> then scanned. The compact b<strong>and</strong>sat Rf 0.23 ± 0.01 <strong>and</strong> 0.60 ± 0.02 respectively, were observed for LOR <strong>and</strong> PCM.Linear regression analysis revealed linearity in the range <strong>of</strong> 300 – 550 ng/b<strong>and</strong> <strong>and</strong>100-500 ng/b<strong>and</strong> for LOR <strong>and</strong> PCM respectively. Drugs were subjected to acid <strong>and</strong>alkali hydrolysis, oxidation, thermal <strong>and</strong> photo-degradation treatments. Thedegraded products were well separated from the pure drug. Statistical analysisproved that the <strong>method</strong> is precise, accurate, selective <strong>and</strong> economical <strong>and</strong> may beused for routine simultaneous estimation <strong>of</strong> LOR <strong>and</strong> PCM for tablet formulations.Key words: Lornoxicam, Paracetamol, Simultaneous estimation, HPLC <strong>method</strong>development, <strong>HPTLC</strong> <strong>method</strong> development, Method <strong>validation</strong>, Stability-<strong>indicating</strong><strong>method</strong>Received: 04 Jun 2011 / Revised: 15 Jun 2011 / Accepted: 17 Jun 2011 / Online publication: 28 Jun 20111. INTRODUCTIONLornoxicam (LOR) is chemically known as 6-chloro-3-[hydroxy(pyridin-2- ylamino)methylene]-2-methyl-2,3-dihydro-4H-thieno[2,3-e][1,2]thiazin-4-one 1,1-dioxidebelongs to the class <strong>of</strong> cyclooxygenase inhibitor <strong>of</strong> nonsteroidalantiinflammatory drug (NSAID) <strong>of</strong> the oxicam classwith analgesic, antiinflammatory <strong>and</strong> antipyretic properties.Paracetamol (PCM) is chemically known as N-(4-hydroxyphenyl) acetamide. PCM inhibits prostagl<strong>and</strong>inbiosynthesis by blocking the enzyme cyclooxygenase [1-4].The chemical structures <strong>of</strong> LOR <strong>and</strong> PCM are shown inFig.1. Literature survey revealed that few HPLC <strong>and</strong> <strong>HPTLC</strong><strong>method</strong>s have been reported for the estimation <strong>of</strong>Paracetamol alone or in combination with other drugs frompharmaceutical formulation <strong>and</strong> biological fluids [5].a)b)Fig.1. Chemical structures <strong>of</strong> a) Lornoxicam <strong>and</strong> b) Paracetamol©2011 PharmaInterScience Publishers. All rights reserved. www.pharmainterscience.com
Dinesh Kumar Jain et al., Int J Pharm Biomed Sci 2011, 2(2), 55-6056Several HPLC, UV spectrophotometric <strong>and</strong> otherchromatographic <strong>method</strong>s have been reported fordetermination <strong>of</strong> Lornoxicam from pharmaceuticalformulation <strong>and</strong> biological fluids [6]. But none <strong>of</strong> these<strong>method</strong>s demonstrate the simultaneous determination <strong>of</strong> thesetwo drugs in tablets dosage from.This paper describes simple, accurate, precise, <strong>and</strong>sensitive reversed-phase RP-HPLC <strong>and</strong> <strong>HPTLC</strong> <strong>method</strong>s forthe simultaneous estimation <strong>of</strong> LOR <strong>and</strong> PCM in a combinedtablet dosage form.2. MATERIALS AND METHODS2.1 MaterialsLornoxicam <strong>and</strong> paracetamol were obtained fromGlenmark pharmaceutical ltd., Mumbai, as a gratis sample,respectively. HPLC grade chemicals (acetonitrile, methanol<strong>and</strong> water) were obtained from E. Merck (Mumbai, India)The tablet dosage form (Label claim: 8 mg Lornoxicam, <strong>and</strong>500 mg Paracetamol) was procured from the local market <strong>and</strong>other reagents such as chlor<strong>of</strong>orm, acetonitrile, methanol,ethyl acetate <strong>and</strong> ammonia were obtained from E. Merck(Mumbai, India) which were <strong>of</strong> analytical grade.2.2 Apparatus <strong>and</strong> chromatographic conditions2.2.1 HPLC <strong>method</strong>The mobile phase consist <strong>of</strong> acetonitrile: methanol: water(50:30:20, %v/v/v) at a flow rate <strong>of</strong> 1.0 mL/min. Before use,the mobile phase was degassed by an ultrasonic bath <strong>and</strong>filtered using 0.4 μm membrane filter before use. Separationwas performed at room temperature on HPLC system havinga pump (Shimadzu LC 10ATVP ) with 20 µL Rheodyneinjector , Phenomenex Luna C18 (5 µm x 25cm x 4.6mm i.d)column <strong>and</strong> SPD-10 AVP photodiode array (PDA) UV-Visible detector set at 290 nm <strong>and</strong> equipped with CLASS-VPs<strong>of</strong>tware (Shimadzu. Kyoto, Japan).2.2.2 <strong>HPTLC</strong> <strong>method</strong>Chromatography was performed over precoated silica gelaluminum plates 60 F254 (20 × 10 cm, 200 μm thickness; E.Merck, Germany) as stationary phase. Samples were spottedin the form <strong>of</strong> distinct b<strong>and</strong>s (6 millimeter; 10 mm apart) witha CAMAG 100 μL syringe using a Linomat V (CAMAG,Switzerl<strong>and</strong>) sample applicator. Equipment parameters wereoptimized for smooth working (scanning speed 100 nm/sec;slit dimension 6.00 x 0.45 mm). Linear ascendingdevelopment was carried out in a 20 cm × 10 cm twin troughglass chamber (CAMAG, Switzerl<strong>and</strong>) previously saturatedwith optimized mobile phase for 20 min at room temperature(30ºC) <strong>and</strong> relative humidity (RH) <strong>of</strong> 55 ± 5%. The plateswere developed to the distance <strong>of</strong> 10 cm <strong>and</strong> dried using hairdryer. The mobile phase was chlor<strong>of</strong>orm: methanol:ethylacetate: ammonia (2.0:1.5:5.5:1, %v/vv/v) withdensitometric analysis at 290 nm in absorbance mode withCAMAG TLC scanner III <strong>and</strong> winCATS s<strong>of</strong>tware (Ver.1.2.0).2.3 Method <strong>validation</strong>2.3.1 LinearityFor HPLC analysis, the calibration graph was plotted over6 different concentrations in the range <strong>of</strong> 2–10 μg/mL <strong>and</strong> 5-100 μg/mL for LOR <strong>and</strong> PCM. Accurately measured workingst<strong>and</strong>ard solution aliquots <strong>of</strong> LOR <strong>and</strong> PCM were transferredto a series <strong>of</strong> 10 mL volumetric flasks <strong>and</strong> diluted to the markwith mobile phase. Aliquots (20 μL) <strong>of</strong> each solution wereinjected chromatographed in six replicates.For <strong>HPTLC</strong> analysis, a stock solution containing 1000ng/μL each for LOR <strong>and</strong> PCM were prepared in methanol.Different volumes <strong>of</strong> this solution were applied to the plateresulting in application <strong>of</strong> 300-550 ng/b<strong>and</strong> for LOR <strong>and</strong>100-500 ng/b<strong>and</strong> for PCM, respectively (n=6). Peak areaswere plotted against corresponding concentrations to furnishthe calibration plot.2.3.2 PrecisionRepeatability <strong>of</strong> sample application <strong>and</strong> measurement <strong>of</strong>peak areas were assessed by chromatography <strong>of</strong> six replicates<strong>of</strong> the same concentration (300 ng/b<strong>and</strong> for LOR <strong>and</strong> 100ng/b<strong>and</strong> for PCM). Intra-day <strong>and</strong> inter-day precision fordetermination <strong>of</strong> LOR <strong>and</strong> PCM were measured at threedifferent concentration (300, 350, 400ng/b<strong>and</strong>) <strong>and</strong> (100,200, 300ng/b<strong>and</strong>). The intraday <strong>and</strong> Interday precisions <strong>of</strong> theproposed <strong>method</strong>s were determined by analyzing st<strong>and</strong>ardsolution <strong>of</strong> LOR <strong>and</strong> PCM at three different concentrations(4.0, 8.0, <strong>and</strong> 12.0 μg/mL for the HPLC <strong>method</strong> <strong>and</strong> 200,300, <strong>and</strong> 500 ng/b<strong>and</strong> for the <strong>HPTLC</strong> <strong>method</strong>) three times onthe same day <strong>and</strong> on three different days.2.3.3 RobustnessThe robustness <strong>of</strong> the <strong>method</strong> was determined byintroducing small changes in certain chromatographicparameters, such as changing the composition <strong>and</strong> the pH <strong>of</strong>mobile phase in the range ±5%.2.3.4 SpecificityThe specificity <strong>of</strong> the <strong>method</strong> was determined by analysis<strong>of</strong> drug st<strong>and</strong>ards <strong>and</strong> samples. The b<strong>and</strong> for LOR <strong>and</strong> PCMin the sample was identified by comparing the RF value <strong>and</strong>spectrum <strong>of</strong> the b<strong>and</strong> with those <strong>of</strong> the b<strong>and</strong> from a st<strong>and</strong>ard.The peak purity <strong>of</strong> LOR <strong>and</strong> PCM were assessed bycomparing spectra acquired at three different positions on thepeak, i.e. the peak start, peak apex, <strong>and</strong> peak end positions <strong>of</strong>the b<strong>and</strong> [7, 8].©2011 PharmaInterScience Publishers. All rights reserved. www.pharmainterscience.com
Dinesh Kumar Jain et al., Int J Pharm Biomed Sci 2011, 2(2), 55-60Table 1System suitability parameter for HPLC <strong>method</strong>Parameters LOR PCMCalibration range (µg/mL) 2-40 8-150Theoretical plate number 4009 2311HETP a 0.0073 0.004Tailing factor 1.52 1.86Capacity factor (k’) 0 1.78Resolution - 6.58a HETP = Height equivalent to theoretical plate, cmTable 2Summary <strong>of</strong> <strong>validation</strong> dataS. No. Validation parameters Observation <strong>of</strong> <strong>HPTLC</strong> <strong>method</strong>LORPCM1 Linearity range300-550 100-500(ng/b<strong>and</strong>)2 Slope 10.48 4.663 Intercept 1226.7 -137.044 Wavelength (nm) 249 3705 Correlation coefficient 0.993 0.9966 Accuracy (n=5) 100.39±1.42 100.56±1.27 Intraday Precision (n=3) 1971.7±24.85 1356.6±23.378 Interday Precision (n=3) 5376.6±88.37 1361.6±35.549 Repeatability (n=6) 3814.8±66.61 313.88±6.3410 Recovery (n=3) 98.91±1.39 98.84±0.5711 LOD (ng/b<strong>and</strong>) 0.62±0.02 0.92±0.0312 LOQ (ng/b<strong>and</strong>) 1.26±0.01 2.17±0.0213 Robustness Robust Robust14 Specificity Specific Specific2.3.5 Limit <strong>of</strong> detection (LOD) <strong>and</strong> Limit <strong>of</strong> quantitation(LOQ)The LOD with signal-to-noise (S/N) ratio <strong>of</strong> 3:1 <strong>and</strong> theLOQ with S/N ratio <strong>of</strong> 10:1 were calculated for LOR <strong>and</strong>PCM using the following equations LOD = 3.3 σ/S, LOQ =10 σ/S where σ is the st<strong>and</strong>ard deviation <strong>of</strong> the response <strong>and</strong>S is the st<strong>and</strong>ard deviation <strong>of</strong> the y-intercept <strong>of</strong> the regressionline for HPLC analysis. For <strong>HPTLC</strong> analysis the limit <strong>of</strong>detection (LOD) <strong>and</strong> the limit <strong>of</strong> quantification (LOQ) wasdetermined by diluting known concentration <strong>of</strong> st<strong>and</strong>ardstock solution until the average responses wereapproximately 3 or 10 times the responses <strong>of</strong> the blank.2.3.6 RecoveryTo check the recovery <strong>of</strong> the drug at different levels informulations, samples were spiked with 50, 100, <strong>and</strong> 150 %<strong>of</strong> LOR <strong>and</strong> PCM st<strong>and</strong>ards <strong>and</strong> the mixtures were analyzedin triplicate by the proposed <strong>method</strong>.2.4 Stability <strong>of</strong> Sample SolutionsSolutions at two different concentrations (300 <strong>and</strong>350ng/b<strong>and</strong> for LOR <strong>and</strong> 200 <strong>and</strong> 300ng/b<strong>and</strong> for PCM)were prepared from stock solution <strong>and</strong> stored at roomtemperature for 24, 4.0, 2.0 1.0, 0.5 <strong>and</strong> 0.2h. They were thenchromatographed on the same plate. The chromatogramswere evaluated for additional spots if any.2.5 Assay <strong>of</strong> the marketed formulationTwenty tablets were weighed <strong>and</strong> crushed. An amount <strong>of</strong>powder equivalent to 100 mg PCM was transferred to a 100mL volumetric flask <strong>and</strong> extracted with methanol for 30 minby shaking mechanically <strong>and</strong> volume was adjusted to markwith the same solvent. 1mL <strong>of</strong> this solution was diluted to 10mL with methanol. An appropriate volume <strong>of</strong> 5 μL wasassayed by the chromatographic procedure described above.No interferences were observed from the excipientscommonly present in the tablets.2.6 Forced degradation studiesA stock solution containing 10 mg for each (LOR <strong>and</strong>PCM) in 10 mL methanol was prepared. This solution wasused for forced degradation to provide an indication <strong>of</strong> the<strong>stability</strong>-<strong>indicating</strong> property <strong>and</strong> specificity <strong>of</strong> the <strong>method</strong>.The average peak area <strong>of</strong> sex replicates <strong>of</strong> LOR <strong>and</strong> PCM(1000 ng/b<strong>and</strong>) was used for analysis.2.6.1 Acid degradationMethanolic solution <strong>of</strong> each drug (10 mg) was separatelydissolved in 10 mL <strong>of</strong> 1M HCl <strong>and</strong> these solutions were keptfor 8 h at room temperature in dark in order to exclude thepossible degradative effect <strong>of</strong> light. The solutions (1 mL)were taken <strong>and</strong> neutralized <strong>and</strong> then diluted up to 10 mL withmethanol. The resultant solutions were applied on TLC platein triplicate (10 μL each, i.e. 1000 ng/b<strong>and</strong>). The plate waschromatographed as described above.2.6.2 Base degradationMethanolic solution <strong>of</strong> each drug (10 mg) was separatelydissolved in 10 mL <strong>of</strong> 1 M NaOH solution. These solutionswere kept for 8 h at room temperature in dark in order toexclude the possible degradative effect <strong>of</strong> light. The solutions(1 mL) were taken <strong>and</strong> neutralized <strong>and</strong> then diluted up to 10mL with methanol. The resultant solutions were applied onTLC plate in triplicate (10 μL each, i.e. 1000 ng/b<strong>and</strong>). Theplate was chromatographed as described above.2.6.3 Oxidative degradationEach drug (10 mg) was dissolved in 10 mL <strong>of</strong> methanolicsolution <strong>of</strong> hydrogen peroxide (10% v/v) <strong>and</strong> kept for 8 h atroom temperature in the dark, to exclude the possibledegradative effect <strong>of</strong> light. The solution (1 mL) was thendiluted to 10 mL with methanol <strong>and</strong> treated as described foracid <strong>and</strong> base-induced degradation.57©2011 PharmaInterScience Publishers. All rights reserved. www.pharmainterscience.com
Dinesh Kumar Jain et al., Int J Pharm Biomed Sci 2011, 2(2), 55-6058Fig. 2.HPLC chromatogram <strong>of</strong> LOR <strong>and</strong> PCMFig.3. (a) <strong>HPTLC</strong> chromatogram <strong>of</strong> LOR <strong>and</strong> PCM from a tablet formulation showing LOR (300 ng/b<strong>and</strong>, R f = 0.23±0.01) <strong>and</strong> PCM (400ng/b<strong>and</strong>,R f =0.60±0.02) peaks (b) overlay spectra <strong>of</strong> LOR <strong>and</strong> PCM2.6.4 Photochemical degradationEach drug solution was left in sunlight for 8h. Theresultant solution was treated as described for hydrogenperoxide-induced degradation.2.6.5 Dry heat degradationThe powdered drug was stored for 3h. under dry heatconditions at 55°C. A solution <strong>of</strong> the treated powder was thenprepared for each drug <strong>and</strong> 1000 ng/b<strong>and</strong> was applied to aplate in triplicate. The plate was then chromatographed <strong>and</strong>treated as described above.3. RESULTS AND DISCUSSIONTo optimize the HPLC parameters, several mobile phasecompositions were tried. A satisfactory separation <strong>of</strong> LOR<strong>and</strong> PCM with good peak symmetry <strong>and</strong> steady baseline wasobtained with the mobile phase methanol: acetonitrile: water(50:30:20, %v/v/v) (pH 3.8) at a flow rate <strong>of</strong> 1.0 mL/min.Complete resolution <strong>of</strong> the peak with clear baseline©2011 PharmaInterScience Publishers. All rights reserved. www.pharmainterscience.com
Dinesh Kumar Jain et al., Int J Pharm Biomed Sci 2011, 2(2), 55-6059Table 3Assay result <strong>of</strong> marketed formulationS. No. Actual concentration (mg) Concentration found (mg) % ContentLOR PCM LOR PCM LOR PCM1 300 400 302.43±4.22 400.31±1.64 101.02±1.34 100.08±1.92Table 4Forced degradation studiesSample exposure conditions LOR PCMNumber <strong>of</strong> degradation products % Recovery (n=3) Number <strong>of</strong> degradation products % Recovery (n=3)(R f value)(R f value)1 M HCl,8h, RT 3 (0.28,0.72, 0.88) 89.23 ±2.17 2 (0.75,0.88) 96.02 ±3.541 M NaOH, 8h, RT 4 (0.01,0.04, 0.72,0.88) 79.0 ±2.94 1(0.4) 76.05 ±1.3710%,H 2 O 2 , 8h, RT 2 (0.71,0.87) 74.34 ±7.15 2(0.40,0.64) 75.14 ±0.82Sunlight, 8h 1(0.76) 45.2 ±1.91 1 (0.79) 13.53 ±1.31Heat, 3h, 55°C 2 (0.31,0.75) 99.67 ±2.43 2 (0.76,0.96) 93.75 ±0.84a) b)Fig.4. <strong>HPTLC</strong> chromatogram obtained from forced degradation studies (a) acid degradation (1 M HCl, 8h, RT) showing 3 degradants at R f values 0.28, 0.72,0.88 for LOR <strong>and</strong> 2 degradants at R f values 0.75, 0.88 for PCM <strong>and</strong> (b) base degradation (1 M NaOH, 8h, RT) showing 4 degradants at R f values 0.01, 0.04,0.72, 0.88 for LOR <strong>and</strong> 1 degradant at R f value 0.4 for PCMseparation was obtained at 290 nm (Fig.2). The systemsuitability test parameters are shown in Table 1.In the development <strong>of</strong> <strong>HPTLC</strong> <strong>method</strong>, the mixture <strong>of</strong>chlor<strong>of</strong>orm:methanol:ethyl acetate:ammonia (20:15:55:10, %v/v/v/v) was selected as a mobile phase as it could resolveLOR <strong>and</strong> PCM spots with a better peak shape <strong>and</strong> <strong>of</strong>fered anoptimum separation at R f 0.23 ± 0.01 <strong>and</strong> 0.60 ± 0.02 (n=6)for LOR <strong>and</strong> PCM respectively (Fig.3a).Linear correlation was obtained in the range <strong>of</strong> 2-10μg/mL <strong>and</strong> 5-100 μg/mL for the HPLC <strong>method</strong> <strong>and</strong> 300-550ng/b<strong>and</strong> <strong>and</strong> 100-500 ng/b<strong>and</strong> for <strong>HPTLC</strong> <strong>method</strong> for LOR<strong>and</strong> PCM, respectively. The average linear regressionequation was represented as Y = 10.348X + 1226.7 for LOR,<strong>and</strong> Y = 4.665X + 137.04 for PCM, where X is theconcentration <strong>of</strong> drug <strong>and</strong> Y is the peak area. The overlayspectra <strong>of</strong> LOR, PCM are shown in Fig.3b. The repeatability<strong>of</strong> the <strong>method</strong> was checked by spotting 4 μL <strong>of</strong> a combinedst<strong>and</strong>ard solution six times on the plate (n= 6); the RSD forthe peak area was found to be 0.72 <strong>and</strong> 1.2 for LOR <strong>and</strong>PCM using HPLC <strong>and</strong> 1.24 <strong>and</strong> 1.02 for LOR <strong>and</strong> PCM for<strong>HPTLC</strong>. The intra-day <strong>and</strong> inter-day The RSD values werefound to be
Dinesh Kumar Jain et al., Int J Pharm Biomed Sci 2011, 2(2), 55-60ng /b<strong>and</strong> for LOR <strong>and</strong> PCM respectively. Different <strong>validation</strong>parameters for the proposed <strong>HPTLC</strong> <strong>method</strong> are summarizedin Table 2.There were no indications <strong>of</strong> compound in<strong>stability</strong> insample solutions containing concentrations 400 <strong>and</strong> 600ng/b<strong>and</strong> for LOR <strong>and</strong> 100 <strong>and</strong> 200 ng/b<strong>and</strong> for PCM storedfor up to 24 h.Six replicate determinations were performed on thecommercially available tablet. For LOR <strong>and</strong> PCM recoverywas found to be 99.75±0.0642% <strong>and</strong> 99.71±0.189%,respectively for HPLC <strong>and</strong> for <strong>HPTLC</strong> the spots <strong>of</strong> Rf 0.23<strong>and</strong> 0.60 were observed in chromatograms obtained fromdrug samples extracted from tablets. There was Nointerference was observed from the excipients commonlypresent in the tablets. It may, therefore, be inferred thatdegradation <strong>of</strong> LOR <strong>and</strong> PCM had not occurred in themarketed formulations analysed by this <strong>method</strong>. The lowRSD indicated that the <strong>method</strong> is suitable for routinesimultaneous estimation <strong>of</strong> LOR <strong>and</strong> PCM in pharmaceuticaldosage forms. The content <strong>and</strong> percentage <strong>of</strong> LOR <strong>and</strong> PCMin market samples are presented in Table 3.Drug recovery at the level <strong>of</strong> 89.23 % <strong>and</strong> 96.02 % forLOR <strong>and</strong> PCM respectively, from the acid-stressed samples(Fig.4), indicated significant degradation in acidic condition(Table 4). Drug recovery from base- stressed sample 79.0 %<strong>and</strong> 76.05 % for LOR <strong>and</strong> PCM respectively (Table 4). Thedifferent R f value obtained from acid <strong>and</strong> base induceddegradation product indicates that the acid degradationproducts are different from alkaline degradation product. Thechromatogram treated with 10 % (v/v) H 2 O 2 revealed peaksfor LOR <strong>and</strong> PCM (Table 4). Drug recoveries were found tobe 74.34 % <strong>and</strong> 75.14 % for LOR <strong>and</strong> PCM respectively.Drug recovery was found to be 45.2 % <strong>and</strong> 13.53 % for LOR<strong>and</strong> PCM respectively, from samples <strong>of</strong> the photochemicaldegradation study, suggestion significant degradation(Table4). Significant degradation was also evident in dry heatsamples. Drug recovery was found to be at the level <strong>of</strong> 99.67% <strong>and</strong> 93.75 % for LOR <strong>and</strong> PCM respectively [9, 11].4. CONCLUSIONSThe proposed <strong>HPTLC</strong> <strong>and</strong> HPLC <strong>method</strong>s were found tobe simple, fast, accurate, precise, <strong>and</strong> sensitive. Thus, it maybe used for routine analysis <strong>of</strong> LOR <strong>and</strong> PCM in combinedtablet dosage form.ACKNOWLEDGMENTSThe authors wish to express their gratitude to Glen markpharmaceutical ltd., Mumbai <strong>and</strong> for gratis samples <strong>of</strong>Lornoxicam <strong>and</strong> Paracetamol. The authors are thankful toDirector, SICART, Vallabh Vidyanagar, Gujarat foranalytical facilities.REFERENCES[1] Altun ML. HPLC <strong>method</strong> for the analysis <strong>of</strong> paracetamol, caffeine <strong>and</strong>dipyrone. Turk J Chem 2002, 26, 521-528.[2] Akay C, Degim T, Sayal A, Aydin A, Ozakan Y, Gul H. Rapid <strong>and</strong>simultaneous determination <strong>of</strong> acetylsalicylic acid, paracetamol <strong>and</strong>their degradation <strong>and</strong> toxic impurity products by hplc in pharmaceuticaldosage forms. Turk J Med Sci 2008, 38, 167–173.[3] Shirkhedkar AA, Shaikh AM, Surana SJ. Simultaneous determination <strong>of</strong>paracetamol <strong>and</strong> piroxicam in tablets by thin layer chromatographycombined with densitometry. Eurasian J Anal Chem 2008, 2, 258-267.[4] Kwiecien A, Krzek J, Biniek L. TLC determination <strong>of</strong> azithromycin inpharmaceutical preparations. J Planar Chromatogr 2008, 21, 177-181.[5] Bhavsar SM, Patel DM, Kh<strong>and</strong>har AP, Patel CN. Validated RP-HPLC<strong>method</strong> for simultaneous estimation <strong>of</strong> lornoxicam <strong>and</strong> thiocolchicosidein solid dosage form. J Chem Pharm Res 2010, 2, 563-572.[6] Cetin, I., Kocak, N., Aycan, S., C.B.U. J Sci 2009, 11, 18-23.[7] Bipin HM, Sachin BM. <strong>HPTLC</strong> densitometric analysis <strong>of</strong> c<strong>and</strong>esartancilexetil <strong>and</strong> hydrochlorthiazide in tablets. J Planar Chrom Mod TLC2008, 21, 173-176.[8] Dubey, N., Dubey, N., Mehta, R.S., Saluja, A.K., J AOAC Int 2009,92(6), 1617.[9] Dubey, N., Dubey, N., Mehta, R.S., Saluja, A.K., J AOAC Int 2009,92(4), 1021.[10] Dubey N, Dubey N, Mehta RS, Saluja AK. J AOAC Int 2009, 92, 779.[11] Shethi PD. <strong>HPTLC</strong> High Performance Thin Layer Chromatography,CBS Publishers, New Delhi 1996.[12] Beckett AH. Practical pharmaceutical chemistry, CBS Publication 1997.[13] Reynolds JEF, Parfitt K, Partons AV, Sweetman SC. The ExtraPharmacopoeia 1996, Martindale, London, 82.60©2011 PharmaInterScience Publishers. All rights reserved. www.pharmainterscience.com