Geophysical data acquisition - OGS
Geophysical data acquisition - OGS
Geophysical data acquisition - OGS

You also want an ePaper? Increase the reach of your titles
YUMPU automatically turns print PDFs into web optimized ePapers that Google loves.
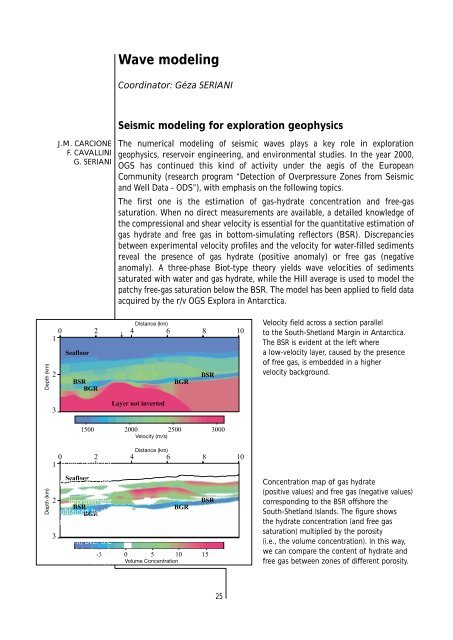
Wave modelingCoordinator: Géza SERIANISeismic modeling for exploration geophysicsJ.M. CARCIONEF. CAVALLINIG. SERIANIThe numerical modeling of seismic waves plays a key role in explorationgeophysics, reservoir engineering, and environmental studies. In the year 2000,<strong>OGS</strong> has continued this kind of activity under the aegis of the EuropeanCommunity (research program “Detection of Overpressure Zones from Seismicand Well Data - ODS”), with emphasis on the following topics.The first one is the estimation of gas-hydrate concentration and free-gassaturation. When no direct measurements are available, a detailed knowledge ofthe compressional and shear velocity is essential for the quantitative estimation ofgas hydrate and free gas in bottom-simulating reflectors (BSR). Discrepanciesbetween experimental velocity profiles and the velocity for water-filled sedimentsreveal the presence of gas hydrate (positive anomaly) or free gas (negativeanomaly). A three-phase Biot-type theory yields wave velocities of sedimentssaturated with water and gas hydrate, while the Hill average is used to model thepatchy free-gas saturation below the BSR. The model has been applied to field <strong>data</strong>acquired by the r/v <strong>OGS</strong> Explora in Antarctica.Velocity field across a section parallelto the South-Shetland Margin in Antarctica.The BSR is evident at the left wherea low-velocity layer, caused by the presenceof free gas, is embedded in a highervelocity background.A line extractedfrom the Micaproject 3D cubeshowing theimprovementobtained by theapplication of 3Dresidual statics(bottom) over theoriginal stack<strong>data</strong> (top).Concentration map of gas hydrate(positive values) and free gas (negative values)corresponding to the BSR offshore theSouth-Shetland Islands. The figure showsthe hydrate concentration (and free gassaturation) multiplied by the porosity(i.e., the volume concentration). In this way,we can compare the content of hydrate andfree gas between zones of different porosity.25