Keystone Species in an Ecosystem Using Connection Circles to Tell ...
Keystone Species in an Ecosystem Using Connection Circles to Tell ...
Keystone Species in an Ecosystem Using Connection Circles to Tell ...

Create successful ePaper yourself
Turn your PDF publications into a flip-book with our unique Google optimized e-Paper software.
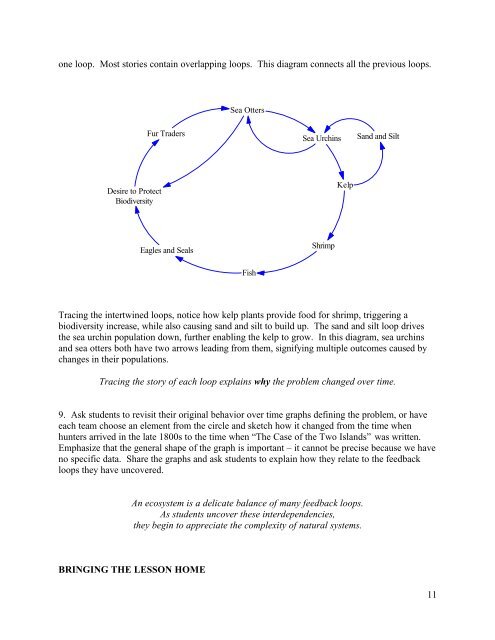
one loop. Most s<strong>to</strong>ries conta<strong>in</strong> overlapp<strong>in</strong>g loops. This diagram connects all the previous loops.Sea OttersFur TradersSea Urch<strong>in</strong>sS<strong>an</strong>d <strong>an</strong>d SiltDesire <strong>to</strong> ProtectBiodiversityKelpEagles <strong>an</strong>d SealsShrimpFishTrac<strong>in</strong>g the <strong>in</strong>tertw<strong>in</strong>ed loops, notice how kelp pl<strong>an</strong>ts provide food for shrimp, trigger<strong>in</strong>g abiodiversity <strong>in</strong>crease, while also caus<strong>in</strong>g s<strong>an</strong>d <strong>an</strong>d silt <strong>to</strong> build up. The s<strong>an</strong>d <strong>an</strong>d silt loop drivesthe sea urch<strong>in</strong> population down, further enabl<strong>in</strong>g the kelp <strong>to</strong> grow. In this diagram, sea urch<strong>in</strong>s<strong>an</strong>d sea otters both have two arrows lead<strong>in</strong>g from them, signify<strong>in</strong>g multiple outcomes caused bych<strong>an</strong>ges <strong>in</strong> their populations.Trac<strong>in</strong>g the s<strong>to</strong>ry of each loop expla<strong>in</strong>s why the problem ch<strong>an</strong>ged over time.9. Ask students <strong>to</strong> revisit their orig<strong>in</strong>al behavior over time graphs def<strong>in</strong><strong>in</strong>g the problem, or haveeach team choose <strong>an</strong> element from the circle <strong>an</strong>d sketch how it ch<strong>an</strong>ged from the time whenhunters arrived <strong>in</strong> the late 1800s <strong>to</strong> the time when “The Case of the Two Isl<strong>an</strong>ds” was written.Emphasize that the general shape of the graph is import<strong>an</strong>t – it c<strong>an</strong>not be precise because we haveno specific data. Share the graphs <strong>an</strong>d ask students <strong>to</strong> expla<strong>in</strong> how they relate <strong>to</strong> the feedbackloops they have uncovered.An ecosystem is a delicate bal<strong>an</strong>ce of m<strong>an</strong>y feedback loops.As students uncover these <strong>in</strong>terdependencies,they beg<strong>in</strong> <strong>to</strong> appreciate the complexity of natural systems.BRINGING THE LESSON HOME11