Keystone Species in an Ecosystem Using Connection Circles to Tell ...
Keystone Species in an Ecosystem Using Connection Circles to Tell ...
Keystone Species in an Ecosystem Using Connection Circles to Tell ...

Create successful ePaper yourself
Turn your PDF publications into a flip-book with our unique Google optimized e-Paper software.
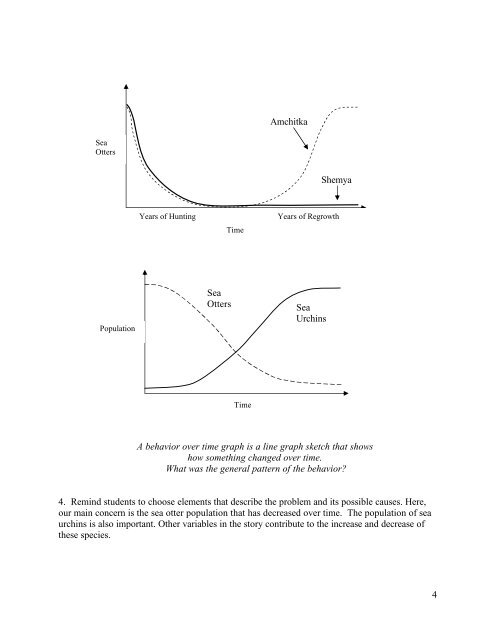
AmchitkaSeaOttersShemyaYears of Hunt<strong>in</strong>gTimeYears of RegrowthPopulationSeaOttersSeaUrch<strong>in</strong>sTimeA behavior over time graph is a l<strong>in</strong>e graph sketch that showshow someth<strong>in</strong>g ch<strong>an</strong>ged over time.What was the general pattern of the behavior?4. Rem<strong>in</strong>d students <strong>to</strong> choose elements that describe the problem <strong>an</strong>d its possible causes. Here,our ma<strong>in</strong> concern is the sea otter population that has decreased over time. The population of seaurch<strong>in</strong>s is also import<strong>an</strong>t. Other variables <strong>in</strong> the s<strong>to</strong>ry contribute <strong>to</strong> the <strong>in</strong>crease <strong>an</strong>d decrease ofthese species.4