and Low-Level Visual Aftereffects by Perceptual Grouping
and Low-Level Visual Aftereffects by Perceptual Grouping
and Low-Level Visual Aftereffects by Perceptual Grouping

You also want an ePaper? Increase the reach of your titles
YUMPU automatically turns print PDFs into web optimized ePapers that Google loves.
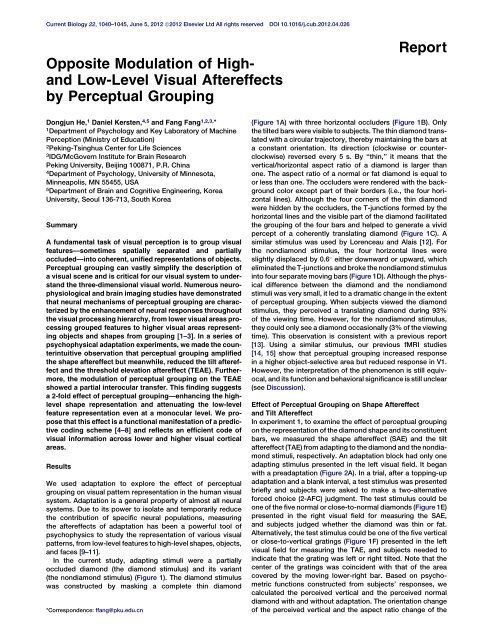
Current Biology 22, 1040–1045, June 5, 2012 ª2012 Elsevier Ltd All rights reservedDOI 10.1016/j.cub.2012.04.026Opposite Modulation of High<strong>and</strong><strong>Low</strong>-<strong>Level</strong> <strong>Visual</strong> <strong>Aftereffects</strong><strong>by</strong> <strong>Perceptual</strong> <strong>Grouping</strong>ReportDongjun He, 1 Daniel Kersten, 4,5 <strong>and</strong> Fang Fang 1,2,3, *1Department of Psychology <strong>and</strong> Key Laboratory of MachinePerception (Ministry of Education)2Peking-Tsinghua Center for Life Sciences3IDG/McGovern Institute for Brain ResearchPeking University, Beijing 100871, P.R. China4Department of Psychology, University of Minnesota,Minneapolis, MN 55455, USA5Department of Brain <strong>and</strong> Cognitive Engineering, KoreaUniversity, Seoul 136-713, South KoreaSummaryA fundamental task of visual perception is to group visualfeatures—sometimes spatially separated <strong>and</strong> partiallyoccluded—into coherent, unified representations of objects.<strong>Perceptual</strong> grouping can vastly simplify the description ofa visual scene <strong>and</strong> is critical for our visual system to underst<strong>and</strong>the three-dimensional visual world. Numerous neurophysiological<strong>and</strong> brain imaging studies have demonstratedthat neural mechanisms of perceptual grouping are characterized<strong>by</strong> the enhancement of neural responses throughoutthe visual processing hierarchy, from lower visual areas processinggrouped features to higher visual areas representingobjects <strong>and</strong> shapes from grouping [1–3]. In a series ofpsychophysical adaptation experiments, we made the counterintuitiveobservation that perceptual grouping amplifiedthe shape aftereffect but meanwhile, reduced the tilt aftereffect<strong>and</strong> the threshold elevation aftereffect (TEAE). Furthermore,the modulation of perceptual grouping on the TEAEshowed a partial interocular transfer. This finding suggestsa 2-fold effect of perceptual grouping—enhancing the highlevelshape representation <strong>and</strong> attenuating the low-levelfeature representation even at a monocular level. We proposethat this effect is a functional manifestation of a predictivecoding scheme [4–8] <strong>and</strong> reflects an efficient code ofvisual information across lower <strong>and</strong> higher visual corticalareas.ResultsWe used adaptation to explore the effect of perceptualgrouping on visual pattern representation in the human visualsystem. Adaptation is a general property of almost all neuralsystems. Due to its power to isolate <strong>and</strong> temporarily reducethe contribution of specific neural populations, measuringthe aftereffects of adaptation has been a powerful tool ofpsychophysics to study the representation of various visualpatterns, from low-level features to high-level shapes, objects,<strong>and</strong> faces [9–11].In the current study, adapting stimuli were a partiallyoccluded diamond (the diamond stimulus) <strong>and</strong> its variant(the nondiamond stimulus) (Figure 1). The diamond stimuluswas constructed <strong>by</strong> masking a complete thin diamond*Correspondence: ffang@pku.edu.cn(Figure 1A) with three horizontal occluders (Figure 1B). Onlythe tilted bars were visible to subjects. The thin diamond translatedwith a circular trajectory, there<strong>by</strong> maintaining the bars ata constant orientation. Its direction (clockwise or counterclockwise)reversed every 5 s. By ‘‘thin,’’ it means that thevertical/horizontal aspect ratio of a diamond is larger thanone. The aspect ratio of a normal or fat diamond is equal toor less than one. The occluders were rendered with the backgroundcolor except part of their borders (i.e., the four horizontallines). Although the four corners of the thin diamondwere hidden <strong>by</strong> the occluders, the T-junctions formed <strong>by</strong> thehorizontal lines <strong>and</strong> the visible part of the diamond facilitatedthe grouping of the four bars <strong>and</strong> helped to generate a vividpercept of a coherently translating diamond (Figure 1C). Asimilar stimulus was used <strong>by</strong> Lorenceau <strong>and</strong> Alais [12]. Forthe nondiamond stimulus, the four horizontal lines wereslightly displaced <strong>by</strong> 0.6 either downward or upward, whicheliminated the T-junctions <strong>and</strong> broke the nondiamond stimulusinto four separate moving bars (Figure 1D). Although the physicaldifference between the diamond <strong>and</strong> the nondiamondstimuli was very small, it led to a dramatic change in the extentof perceptual grouping. When subjects viewed the diamondstimulus, they perceived a translating diamond during 93%of the viewing time. However, for the nondiamond stimulus,they could only see a diamond occasionally (3% of the viewingtime). This observation is consistent with a previous report[13]. Using a similar stimulus, our previous fMRI studies[14, 15] show that perceptual grouping increased responsein a higher object-selective area but reduced response in V1.However, the interpretation of the phenomenon is still equivocal,<strong>and</strong> its function <strong>and</strong> behavioral significance is still unclear(see Discussion).Effect of <strong>Perceptual</strong> <strong>Grouping</strong> on Shape Aftereffect<strong>and</strong> Tilt AftereffectIn experiment 1, to examine the effect of perceptual groupingon the representation of the diamond shape <strong>and</strong> its constituentbars, we measured the shape aftereffect (SAE) <strong>and</strong> the tiltaftereffect (TAE) from adapting to the diamond <strong>and</strong> the nondiamondstimuli, respectively. An adaptation block had only oneadapting stimulus presented in the left visual field. It beganwith a preadaptation (Figure 2A). In a trial, after a topping-upadaptation <strong>and</strong> a blank interval, a test stimulus was presentedbriefly <strong>and</strong> subjects were asked to make a two-alternativeforced choice (2-AFC) judgment. The test stimulus could beone of the five normal or close-to-normal diamonds (Figure 1E)presented in the right visual field for measuring the SAE,<strong>and</strong> subjects judged whether the diamond was thin or fat.Alternatively, the test stimulus could be one of the five verticalor close-to-vertical gratings (Figure 1F) presented in the leftvisual field for measuring the TAE, <strong>and</strong> subjects needed toindicate that the grating was left or right tilted. Note that thecenter of the gratings was coincident with that of the areacovered <strong>by</strong> the moving lower-right bar. Based on psychometricfunctions constructed from subjects’ responses, wecalculated the perceived vertical <strong>and</strong> the perceived normaldiamond with <strong>and</strong> without adaptation. The orientation changeof the perceived vertical <strong>and</strong> the aspect ratio change of the
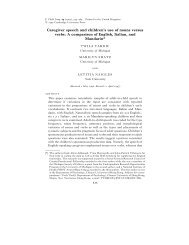
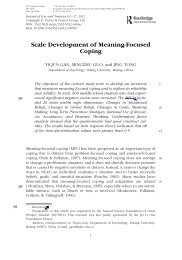
<strong>Perceptual</strong> <strong>Grouping</strong> Modulates <strong>Visual</strong> <strong>Aftereffects</strong>1041A B C DAPreadaptation25s22.60°Topping-upadaptation 5s10.99°CompletediamondOccluderDiamondNonDiamondBlank 0.2sEorTest 0.1sF0.92 0.96 1 1.04 1.08GWait for response2°4°-8° -4° 0° +4° +8°+25°Figure 1. <strong>Visual</strong> Stimuli(A) A complete thin diamond translated with a circular trajectory. Its direction(clockwise or counterclockwise) reversed every 5 s.(B) Three horizontal occluders were rendered with the background colorexcept part of their borders—the four horizontal lines.(C) The diamond stimulus as adaptor was generated <strong>by</strong> masking thecomplete diamond with the occluders. T-junctions formed <strong>by</strong> the horizontallines, <strong>and</strong> the visible parts of the complete diamond made subjects seea coherently translating diamond.(D) The nondiamond stimulus as a second adaptor was generated <strong>by</strong> displacingthe horizontal lines vertically. The absence of the T-junctions brokethe stimulus into four separate moving bars.(E) Diamond test stimuli for measuring shape aftereffect.(F) High-contrast grating test stimuli for measuring tilt aftereffect.(G) A sample low-contrast grating test stimulus for measuring thresholdelevation aftereffect.perceived normal diamond caused <strong>by</strong> adaption were taken asthe magnitude of the TAE <strong>and</strong> the SAE respectively. If adaptationcould generate a significant TAE <strong>and</strong>/or SAE, a verticalgrating would be perceived to be left tilted <strong>and</strong>/or a normal diamondto be fat.For three experimental conditions—adapting to the diamondstimulus, adapting to the nondiamond stimulus <strong>and</strong> baseline(without adaptation)—the perceived verticals (mean 6SEM) were 1.84 6 0.76 , 3.31 6 0.90 , <strong>and</strong> 0.29 6 0.72 ,respectively. TAEs were significant after adapting to both thenondiamond stimulus (t = 4.90, p < 0.01) <strong>and</strong> the diamond stimulus(t = 3.31, p < 0.05). The TAE from the nondiamond stimuluswas significantly larger than that from the diamond stimulus(t = 6.85, p < 0.01) (Figure 2B). However, SAE measurementshad a distinctive pattern. The aspect ratios of the perceivednormal diamonds were 0.9937 6 0.009, 0.9752 6 0.01, <strong>and</strong>0.9743 6 0.01 for the three conditions. A significant SAE wasfound after adapting to the diamond stimulus (t = 8.21, p 0.05).The difference between the two adapting stimuli was significant(t = 5.07, p < 0.01) (Figure 2C). These results demonstratethat perceptual grouping could enhance the representation ofthe diamond shape but attenuate the representation of theBTAE (°)4.003.002.001.000.00NonDiamondDiamond-0.01NonDiamondDiamondbar orientation. The shape adaptation should take place inhigh-level visual areas because the SAE was evident evenwhen the adapting <strong>and</strong> test stimuli were presented in theleft <strong>and</strong> right visual fields, respectively. A possible area is thelateral occipital area (LO) because the LO in either hemisphereis responsive to shape images presented in both the left <strong>and</strong>right visual fields [16], although it still has a contralateralpreference [17].Effect of <strong>Perceptual</strong> <strong>Grouping</strong> on Threshold ElevationAftereffectIt could be argued that, in experiment 1, the TAE reduction<strong>by</strong> perceptual grouping is due to different spatial distributionsof attention when subjects viewed the diamond <strong>and</strong> theCSAE0.030.020.010.00Figure 2. Procedure <strong>and</strong> Results of Experiment 1(A) Experimental procedure. An adaptation block had only one adaptingstimulus (the diamond stimulus or the nondiamond stimulus) presented inthe left visual field. It began with a 25 s preadaptation. In a trial, after a 5 stopping-up adaptation <strong>and</strong> a 0.2 s blank interval, a test stimulus waspresented for 0.1 s <strong>and</strong> subjects were asked to make a 2-AFC judgment.The test stimulus could be one of the five grating test stimuli presented inthe left visual field for measuring TAE, <strong>and</strong> subjects needed to indicatethat the grating was left or right tilted. Alternatively, the test stimulus couldbe one of the five diamond test stimuli presented in the right visual field formeasuring SAE, <strong>and</strong> subjects judged whether the diamond was thin or fat.(B) TAE magnitudes from adapting to the diamond <strong>and</strong> the nondiamondstimuli.(C) SAE magnitudes from adapting to the diamond <strong>and</strong> the nondiamondstimuli. Asterisks indicate a statistically significant difference betweentwo stimulus conditions (*p < 0.05; **p < 0.01). Error bars denote 1 SEMcalculated across subjects for each condition.
Current Biology Vol 22 No 111042ATEAE3.002.001.000.00NonDiamondDiamondC3.00TEAE2.001.00nondiamond stimuli. For the nondiamond stimulus, subjects’spatial attention might be more focused on the four movingbars. For the diamond stimulus, attention might even spreadto the occluders, the hidden corners, <strong>and</strong> the area bound<strong>by</strong> the four bars because they are intrinsically related toeach other <strong>and</strong> construct a representational entity [18]. Toconfirm that the representation attenuation of the bar orientationis due to perceptual grouping rather than a pure attentionaleffect, we performed experiment 2 with five othersubjects to measure the effect of perceptual grouping oncontrast threshold elevation aftereffect (TEAE). AlthoughTAE could be modulated <strong>by</strong> attention, threshold elevationaftereffect (TEAE) has been demonstrated to be independentof attention, especially when adapting stimuli have a highcontrast [19–21].Experiment 2 measured the TEAE <strong>and</strong> the SAE from adaptingto the diamond <strong>and</strong> the nondiamond stimulus. For theTEAE measurement, we used a temporal 2-AFC QUEST staircaseprocedure (82% correct) [22] to measure subjects’contrast detection thresholds with <strong>and</strong> without adaptation.The ratio of the threshold with adaption to that without adaptationwas taken as the TEAE magnitude. The orientation oftest stimuli was identical to that of the adapting stimulus(i.e., the lower right bar) (Figure 1G). We found a significantTEAE after adapting to both the nondiamond stimulus (t =9.31, p < 0.01) <strong>and</strong> the diamond stimulus (t = 11.21, p < 0.01).The TEAE from the nondiamond stimulus was significantlylarger than that from the diamond stimulus (t = 5.02, p
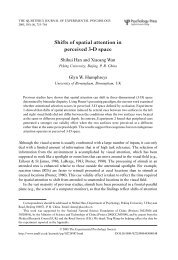
groupingperceptualofEffect<strong>Perceptual</strong> <strong>Grouping</strong> Modulates <strong>Visual</strong> <strong>Aftereffects</strong>1043ALeft eye Right eye Left eye Right eyeB Left eye Right eyeFigure 4. Stimuli <strong>and</strong> Results of Experiment 3(A) Adapting stimuli were presented in either the left orthe right eye.(B) Test stimuli were always presented in the left eye formeasuring TEAE.(C) TEAE magnitudes from adapting to the diamond <strong>and</strong>the nondiamond stimuli when adapting <strong>and</strong> test stimuliwere presented in the same eye.(D) TEAE magnitudes from adapting to the diamond <strong>and</strong>the nondiamond stimuli when adapting <strong>and</strong> test stimuliwere presented in different eyes.(E) Effects of perceptual grouping on TEAE when adapting<strong>and</strong> test stimuli were presented in the same ordifferent eyes. Asterisks indicate a statistically significantdifference between two stimulus or eye conditions (*p
Current Biology Vol 22 No 111044in inverse activity patterns. Predictive coding models [4–8], forexample, are one class of models that suggest that feedbackmay operate to reduce activity in lower areas. These modelsposit that higher areas are actively attempting to ‘‘explain’’activity patterns in lower areas via feedback projections.Because most predictive coding models include a subtractivecomparison between the hypotheses formed in higher areas<strong>and</strong> the incoming sensory input represented in lower areas,the overall effect of feedback may be to reduce activity in lowerareas. Specifically, reduced activity in lower visual areas wouldoccur whenever the predictions of higher level areas matchincoming sensory information. In the case of our stimuli,when high visual areas (e.g., LO) maintain a representation ofa grouped shape, this ‘‘expectation’’ or ‘‘underst<strong>and</strong>ing’’ ofthe image features is sent back to lower visual areas (e.g.,V1) <strong>and</strong> removed, resulting in less activity. When higher areasare unable to form such an underst<strong>and</strong>ing (i.e., when the barsare perceived as ungrouped), these feedback processes arenot occurring <strong>and</strong> there is consequently more activity inlower areas. Predictive coding models have strong intuitiveappeal— why bother signaling what you already know [32]?The reduced activity that would result from such a processwould also have substantial biological benefits. There are clearefficiency constraints placed on the visual system—bothbecause of inherent capacity limitations in neural pathways<strong>and</strong> because spikes are metabolically expensive [33]. Thevisual system would do well to use a representational strategythat maximizes biological efficiency <strong>by</strong> utilizing a code thatminimizes spike rate.Recent fMRI <strong>and</strong> magnetoencephalography (MEG) studieshave provided evidence for predictive coding models[34–37]. We also performed fMRI experiments to test themodels. We observed a BOLD signal increase in the LO <strong>and</strong>a concurrent signal decrease in V1 when visual elementswere assembled into a coherent shape [14, 15]. However, itshould be pointed out that, due to the complicated nature ofBOLD signal <strong>and</strong> the limit of its spatial resolution [38], BOLDsignal reductions in lower areas cannot be unequivocallyexplained as a decrease in neural activity representing lowlevelelements [32]. The reductions may be a manifestationof representation sharpening or noise removal [39]. They couldalso be attributed to other factors, including changes in visualstimulus, perceived context, <strong>and</strong> attentional state. More critically,behavioral significance of predictive coding has rarelybeen verified. By showing that shape perception from perceptualgrouping affects not only high-level vision, but also lowlevelvision, the current adaptation study provides the firstpiece of behavioral evidence for a predictive coding scheme.Our study suggests that feedback from higher visual areasserves to reduce activity in lower visual areas during perceptualgrouping. The feedback could even penetrate back tomonocular neurons in V1. It should be noted that a majorchallenge for the predictive coding view is how a higher visualarea predicts the precise metrics of a stimulus. A dominantfunctional interpretation of the feedforward ventral pathwayis increased selectivity at the expense of insensitivity tovariables such as translation, illumination, <strong>and</strong> scale; but ifinformation about position <strong>and</strong> size is gradually lost, thenhow could a feedback signal be spatially precise? One possibilityis that transformation information might be retained inthe visual processing hierarchy, as suggested <strong>by</strong> a recentstudy [40]. The predictive coding view is an alternative proposalto the conventional wisdom that favors enhancement<strong>and</strong> attention in the conceptualization of the role of feedbackin visual processing. Underst<strong>and</strong>ing how the feedback isimplemented in the visual cortex will be a scientific challengein the future.Supplemental InformationSupplemental Information includes Supplemental Experimental Procedures<strong>and</strong> can be found with this article online at doi:10.1016/j.cub.2012.04.026.AcknowledgmentsThis work was supported <strong>by</strong> the Ministry of Science <strong>and</strong> Technology ofChina (2011CBA00405 <strong>and</strong> 2010CB833903), the National Natural ScienceFoundation of China (Project 30925014, 30870762, <strong>and</strong> 90920012), <strong>and</strong> theFundamental Research Funds for the Central Universities. D.K. was partiallysupported <strong>by</strong> the World Class University program funded <strong>by</strong> the Ministry ofEducation, Science <strong>and</strong> Technology through the National Research Foundationof Korea (R31-10008) <strong>and</strong> <strong>by</strong> the National Institutes of Health grantR01 EY015261.Received: February 11, 2012Revised: March 28, 2012Accepted: April 13, 2012Published online: May 10, 2012References1. Kourtzi, Z., Tolias, A.S., Altmann, C.F., Augath, M., <strong>and</strong> Logothetis, N.K.(2003). Integration of local features into global shapes: monkey <strong>and</strong>human FMRI studies. Neuron 37, 333–346.2. Roelfsema, P.R. (2006). Cortical algorithms for perceptual grouping.Annu. Rev. Neurosci. 29, 203–227.3. Gilbert, C.D., <strong>and</strong> Sigman, M. (2007). Brain states: top-down influencesin sensory processing. Neuron 54, 677–696.4. Mumford, D. (1992). On the computational architecture of the neocortex.II. The role of cortico-cortical loops. Biol. Cybern. 66, 241–251.5. Barlow, H.B. (1994). What is the computational goal of the neocortex? InLarge-Scale Neuronal Theories of the Brain, C. Koch <strong>and</strong> J.L. Davis, eds.(Cambridge, MA: MIT), pp. 1–22.6. Rao, R.P., <strong>and</strong> Ballard, D.H. (1999). Predictive coding in the visualcortex: a functional interpretation of some extra-classical receptivefieldeffects. Nat. Neurosci. 2, 79–87.7. Kersten, D., Mamassian, P., <strong>and</strong> Yuille, A. (2004). Object perception asBayesian inference. Annu. Rev. Psychol. 55, 271–304.8. Friston, K. (2010). The free-energy principle: a unified brain theory? Nat.Rev. Neurosci. 11, 127–138.9. Blakemore, C., <strong>and</strong> Campbell, F.W. (1969). On the existence of neuronesin the human visual system selectively sensitive to the orientation <strong>and</strong>size of retinal images. J. Physiol. 203, 237–260.10. Webster, M.A., Kaping, D., Mizokami, Y., <strong>and</strong> Duhamel, P. (2004).Adaptation to natural facial categories. Nature 428, 557–561.11. Fang, F., <strong>and</strong> He, S. (2005). Viewer-centered object representation in thehuman visual system revealed <strong>by</strong> viewpoint aftereffects. Neuron 45,793–800.12. Lorenceau, J., <strong>and</strong> Alais, D. (2001). Form constraints in motion binding.Nat. Neurosci. 4, 745–751.13. McDermott, J., Weiss, Y., <strong>and</strong> Adelson, E.H. (2001). Beyond junctions:nonlocal form constraints on motion interpretation. Perception 30,905–923.14. Murray, S.O., Kersten, D., Olshausen, B.A., Schrater, P., <strong>and</strong> Woods,D.L. (2002). Shape perception reduces activity in human primary visualcortex. Proc. Natl. Acad. Sci. USA 99, 15164–15169.15. Fang, F., Kersten, D., <strong>and</strong> Murray, S.O. (2008). <strong>Perceptual</strong> grouping <strong>and</strong>inverse fMRI activity patterns in human visual cortex. J. Vis. 8, 1–9.16. Grill-Spector, K., Kourtzi, Z., <strong>and</strong> Kanwisher, N. (2001). The lateral occipitalcomplex <strong>and</strong> its role in object recognition. Vision Res. 41, 1409–1422.17. Niemeier, M., Goltz, H.C., Kuchinad, A., Tweed, D.B., <strong>and</strong> Vilis, T. (2005).A contralateral preference in the lateral occipital area: sensory <strong>and</strong>attentional mechanisms. Cereb. Cortex 15, 325–331.18. Naber, M., Carlson, T.A., Verstraten, F.A.J., <strong>and</strong> Einhauser, W. (2011).<strong>Perceptual</strong> benefit of objecthood. J. Vis. 11, 1–9.
<strong>Perceptual</strong> <strong>Grouping</strong> Modulates <strong>Visual</strong> <strong>Aftereffects</strong>104519. Festman, Y., <strong>and</strong> Ahissar, M. (2004). Attentional states <strong>and</strong> the degree ofvisual adaptation to gratings. Neural Netw. 17, 849–860.20. Blake, R., Tadin, D., Sobel, K.V., Raissian, T.A., <strong>and</strong> Chong, S.C. (2006).Strength of early visual adaptation depends on visual awareness. Proc.Natl. Acad. Sci. USA 103, 4783–4788.21. Bi, T., Cai, P., Zhou, T., <strong>and</strong> Fang, F. (2009). The effect of crowding onorientation-selective adaptation in human early visual cortex. J. Vis. 9,1–10.22. Watson, A.B., <strong>and</strong> Pelli, D.G. (1983). QUEST: a Bayesian adaptivepsychometric method. Percept. Psychophys. 33, 113–120.23. Movshon, J.A., <strong>and</strong> Lennie, P. (1979). Pattern-selective adaptation invisual cortical neurones. Nature 278, 850–852.24. Blake, R., Overton, R., <strong>and</strong> Lema-Stern, S. (1981). Interocular transfer ofvisual aftereffects. J. Exp. Psychol. Hum. Percept. Perform. 7, 367–381.25. Howarth, C.M., Voro<strong>by</strong>ov, V., <strong>and</strong> Sengpiel, F. (2009). Interoculartransfer of adaptation in the primary visual cortex. Cereb. Cortex 19,1835–1843.26. Altmann, C.F., Bülthoff, H.H., <strong>and</strong> Kourtzi, Z. (2003). <strong>Perceptual</strong> organizationof local elements into global shapes in the human visual cortex.Curr. Biol. 13, 342–349.27. Li, W., Piëch, V., <strong>and</strong> Gilbert, C.D. (2008). Learning to link visualcontours. Neuron 57, 442–451.28. Wannig, A., Stanisor, L., <strong>and</strong> Roelfsema, P.R. (2011). Automatic spreadof attentional response modulation along Gestalt criteria in primaryvisual cortex. Nat. Neurosci. 14, 1243–1244.29. Sekuler, A.B., <strong>and</strong> Palmer, S.E. (1992). Perception of partly occludedobjects: A microgenetic analysis. J. Exp. Psychol. Gen. 121, 95–111.30. Verghese, P., <strong>and</strong> Stone, L.S. (1996). Perceived visual speed constrained<strong>by</strong> image segmentation. Nature 381, 161–163.31. Suzuki, S., <strong>and</strong> Cavanagh, P. (1995). Facial organization blocks accessto low-level features: An object inferiority effect. J. Exp. Psychol. Hum.Percept. Perform. 21, 901–913.32. Murray, S.O., Schrater, P., <strong>and</strong> Kersten, D. (2004). <strong>Perceptual</strong> grouping<strong>and</strong> the interactions between visual cortical areas. Neural Netw. 17,695–705.33. Lennie, P. (2003). The cost of cortical computation. Curr. Biol. 13,493–497.34. Summerfield, C., Egner, T., Greene, M., Koechlin, E., Mangels, J., <strong>and</strong>Hirsch, J. (2006). Predictive codes for forthcoming perception in thefrontal cortex. Science 314, 1311–1314.35. Furl, N., van Rijsbergen, N.J., Treves, A., Friston, K.J., <strong>and</strong> Dolan, R.J.(2007). Experience-dependent coding of facial expression in superiortemporal sulcus. Proc. Natl. Acad. Sci. USA 104, 13485–13489.36. Harrison, L.M., Stephan, K.E., Rees, G., <strong>and</strong> Friston, K.J. (2007). Extraclassicalreceptive field effects measured in striate cortex with fMRI.Neuroimage 34, 1199–1208.37. Summerfield, C., Trittschuh, E.H., Monti, J.M., Mesulam, M.M., <strong>and</strong>Egner, T. (2008). Neural repetition suppression reflects fulfilled perceptualexpectations. Nat. Neurosci. 11, 1004–1006.38. Logothetis, N.K., <strong>and</strong> W<strong>and</strong>ell, B.A. (2004). Interpreting the BOLD signal.Annu. Rev. Physiol. 66, 735–769.39. Vinje, W.E., <strong>and</strong> Gallant, J.L. (2002). Natural stimulation of the nonclassicalreceptive field increases information transmission efficiency in V1.J. Neurosci. 22, 2904–2915.40. Cox, D.D., Meier, P., Oertelt, N., <strong>and</strong> DiCarlo, J.J. (2005). ‘Breaking’ position-invariantobject recognition. Nat. Neurosci. 8, 1145–1147.