PDF ( B) - APAMED Central
PDF ( B) - APAMED Central
PDF ( B) - APAMED Central

You also want an ePaper? Increase the reach of your titles
YUMPU automatically turns print PDFs into web optimized ePapers that Google loves.
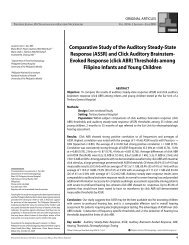
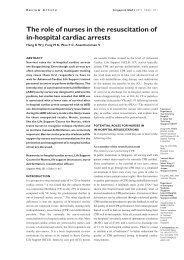
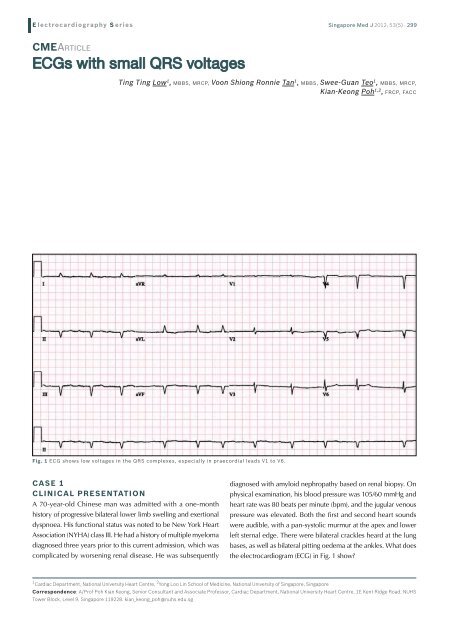
E lectrocardiography S eriesSingapore Med J 2012; 53(5) : 299CMEArticleECGs with small QRS voltagesTing Ting Low 1 , MBBS, MRCP, Voon Shiong Ronnie Tan 1 , MBBS, Swee-Guan Teo 1 , MBBS, MRCP,Kian-Keong Poh 1,2 , FRCP, FACCFig. 1 ECG shows low voltages in the QRS complexes, especially in praecordial leads V1 to V6.CASE 1CLINICAL PRESENTATIONA 70-year-old Chinese man was admitted with a one-monthhistory of progressive bilateral lower limb swelling and exertionaldyspnoea. His functional status was noted to be New York HeartAssociation (NYHA) class III. He had a history of multiple myelomadiagnosed three years prior to this current admission, which wascomplicated by worsening renal disease. He was subsequentlydiagnosed with amyloid nephropathy based on renal biopsy. Onphysical examination, his blood pressure was 105/60 mmHg andheart rate was 80 beats per minute (bpm), and the jugular venouspressure was elevated. Both the first and second heart soundswere audible, with a pan-systolic murmur at the apex and lowerleft sternal edge. There were bilateral crackles heard at the lungbases, as well as bilateral pitting oedema at the ankles. What doesthe electrocardiogram (ECG) in Fig. 1 show?1 Cardiac Department, National University Heart Centre,2 Yong Loo Lin School of Medicine, National University of Singapore, SingaporeCorrespondence: A/Prof Poh Kian Keong, Senior Consultant and Associate Professor, Cardiac Department, National University Heart Centre, 1E Kent Ridge Road, NUHSTower Block, Level 9, Singapore 119228. kian_keong_poh@nuhs.edu.sg
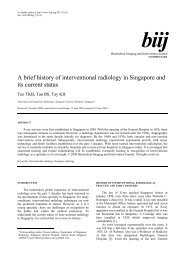
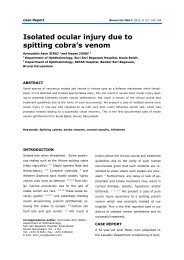
E lectrocardiography S eriesECG INTERPRETATIONThe ECG in Fig. 1 shows atrial fibrillation. The voltages of theQRS complexes are globally small, especially those in leads V1to V6, where all the complexes are less than 1 millivolt (10 mm).Prominent Q waves are seen in leads V4–V5.CLINICAL COURSETransthoracic echocardiogram performed revealed an increasein left ventricular wall thickness (Fig. 2). There was severe leftventricular systolic dysfunction. The left ventricular ejectionfraction was only 25% (normal range is usually above 55%). Boththe atria were dilated. The mitral and aortic valves were thickened,and there was moderately severe mitral and tricuspid regurgitation.The mitral in-flow Doppler signals showed a restrictive pattern.The pulmonary artery systolic pressure was quantitated to be46 mmHg. The echocardiographic findings were consistent withthose of amyloid heart disease. Magnetic resonance (MR) imagingof the heart was subsequently performed. There was globalgadolinium enhancement of the myocardium, with difficulty innulling the myocardium and rapid clearance of contrast fromthe blood pool, consistent with cardiac amyloidosis. The optionof an implantable cardioverter-defibrillator device was offeredfor primary prophylaxis against sudden cardiac death, but thepatient declined. His medications for heart failure were optimised,including the use of an angiotensin-converting enzyme inhibitor,spironolactone, digoxin and a diuretic (bumetanide).2a 2b 2cFig. 2 Echocardiogram in (a) parasternal long axis view shows increased left ventricular wall thickness and high myocardial echogenicity, commonlydescribed as “granular sparkling” (arrows), with the mitral valve appearing thickened; (b) parasternal short axis view shows a uniformincrease in LV wall thickness, with a small pericardial effusion but a larger pleural effusion; (c) apical 4-chamber view shows the dilated rightand left atria. The arrows demonstrate increased ventricular wall thickness and “granular sparkling”. (LV: left ventricle; RV: right ventricle; Ao:aorta; LA: left atrium; Pl Eff: pleural effusion; RA: right atrium)Fig. 3 ECG shows low voltage QRS complexes globally, suggesting pericardial effusion in the clinical context.CASE 2CLINICAL PRESENTATIONA 48-year-old female patient was admitted for progressive shortnessof breath associated with intermittent chest discomfortover the last three months. On physical examination, sinustachycardia at 105 bpm and a blood pressure reading of 100/60mmHg were noted. Both the first and second heart sounds wereheard but muffled. There was no pericardial rub. The jugularvenous pressure was markedly elevated. What does the ECG inFig. 3 show?Singapore Med J 2012; 53(5) : 300
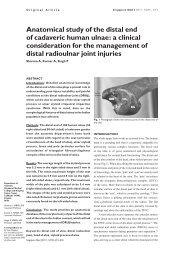
E lectrocardiography S eriesFig. 4 ECG after pericardiocentesis shows a marked increase in voltages of the QRS complexes, the T waves and P waves inall the I2 leads.ECG INTERPRETATIONThe ECG in Fig. 3 shows sinus rhythm (heart rate = 107 bpm)and small QRS complexes globally. The QRS complexes in thelimb leads averaged 3−4 mm, and those in the precordial leadsaveraged 6−7 mm. In addition, the voltages of both the T andP waves are also globally reduced. In the clinical context, theseECG findings are highly suggestive of the presence of a largepericardial effusion. There is no evidence of electrical alternanspresent in this ECG. After pericardiocentesis (Fig. 4), there isa marked increase in the voltages of the QRS complexes, theT waves and P waves in all the 12 leads.CLINICAL COURSETransthoracic echocardiogram revealed the presence of a largepericardial effusion (Fig. 5). The ejection fraction was normal at68%. Echocardiographic features of increased intra-pericardialpressures were observed. There was collapse of the right atriumand right ventricle during diastole, as well as dilatation andless than 50% reduction in the diameter of the inferior venacava during inspiration. A pericardiocentesis was performedemergently. Analysis of the pericardial fluid revealed the presenceof abnormal blast cells (80%), and flow cytometry confirmedthe diagnosis of acute myeloid leukaemia. The patient wascommenced on chemotherapy and underwent allogenic stemcell transplantation as part of curative treatment. Follow-upechocardiography 72 hours later showed marked intervalreduction in the size of the pericardial effusion. ECG repeatedpost pericardiocentesis also showed that all QRS voltages hadbecome considerably larger (Fig. 4).DISCUSSIONThe American College of Cardiology/American HeartAssociation (ACC/AHA) Committee defined the criteria for lowvoltage QRS complexes on the ECG as amplitude of the QRSFig. 5 Echocardiogram in apical 4-chamber window shows largepericardial effusion (PE) surrounding the heart.complexes less than 5 mm in each standard limb lead, or less than10 mm in the precordial leads. (1) The differential diagnoses aremany, and may include myocardial disease, pericardial diseaseand metabolic abnormalities (Table I). The ECG complexes mayalso be attenuated by any condition that increases the distancebetween the heart and the ECG leads, such as in anasarca, (2)lung disease and morbid obesity. Inappropriate calibrationis another common pitfall. (3) The standard ECG shouldbe calibrated to a voltage sensitivity of 10 mm/mV on thevertical axis.In our first case, the patient has low voltage QRS complexessecondary to cardiac amyloidosis. This is a manifestation of agroup of diseases of amyloid production, which is characterisedby extracellular amyloid infiltration throughout the heart.Pathologically, the amlyoid deposits occur in the atria, ventricles,valves, as well as perivascularly and in the conduction system,resulting in biventricular wall thickening, atrial dilatation andpericardial effusion. Consequently, clinical manifestations maySingapore Med J 2012; 53(5) : 301
E lectrocardiography S eriesREFERENCES1. Kadish AH, Buxton AE, Kennedy HL, et al. ACC/AHA clinical competencestatement on electrocardiography and ambulatory electrocardiography.A report of the ACC/AHA/ACP-ASIM Task Force on Clinical Competence(ACC/AHA Committee to Develop a Clinical Competence Statement onElectrocardiography and Ambulatory Electrocardiography). J Am CollCardiol 2001; 38:2091-100.2. Madias JE, Bazaz R, Agarwal H, Win M, Medepalli L. Anasarca-mediatedattenuation of the amplitude of electrocardiogram complexes: adescription of a heretofore unrecognized phenomenon. J Am Coll Cardiol2001; 38:756-64.3. Yeo WT, Teo SG, Loh PYJ, Poh KK. Misleading ECG recordings. SingaporeMed J 2011; 52:772-6.4. Falk RH. Diagnosis and management of the cardiac amyloidoses.Circulation 2005; 112:2047-60.5. Rahman JE, Helou EF, Gelzer-Bell R, et al. Noninvasive diagnosis of biopsyprovencardiac amyloidosis. J Am Coll Cardiol 2004; 43:410-5.6. Hamer JP, Janssen S, van Rijswijk MH, Lie KI. Amyloid cardiomyopathyin systemic non-hereditary amyloidosis. Clinical, echocardiographic andelectrocardiographic findings in 30 patients with AA and 24 patients withAL amyloidosis. Eur Heart J 1992; 13:623-7.7. Murtagh B, Hammill SC, Gertz MA, et al. Electrocardiographic findingsin primary systemic amyloidosis and biopsy-proven cardiac involvement.Am J Cardiol 2005; 95:535-7.8. Carroll JD, Gaasch WH, McAdam KP. Amyloid cardiomyopathy:characterization by a distinctive voltage/mass relation. Am J Cardiol 1982;49:9-13.9. Poh KK, Teo SG, Tay ELW, Yip JWL. ECGs of structural heart disease: Part1. Singapore Med J 2011; 52:855-9.10. Meyers DG, Bagin RG, Levene JF. Electrocardiographic changes inpericardial effusion. Chest 1993; 104:1422-6.11. Eisenberg MJ, de Romeral LM, Heidenreich PA, Schiller NB,Evans GT Jr. The diagnosis of pericardial effusion and cardiactamponade by 12-lead ECG. A technology assessment. Chest 1996;110:318-24.12. Kudo Y, Yamasaki F, Doi T, Doi Y, Sugiura T. Clinical significance of lowvoltage in asymptomatic patients with pericardial effusion free of heartdisease. Chest 2003; 124: 2064-7.Singapore Med J 2012; 53(5) : 303