Measuring gravity using Electromagnetic Induction
Measuring gravity using Electromagnetic Induction
Measuring gravity using Electromagnetic Induction
- No tags were found...

Create successful ePaper yourself
Turn your PDF publications into a flip-book with our unique Google optimized e-Paper software.
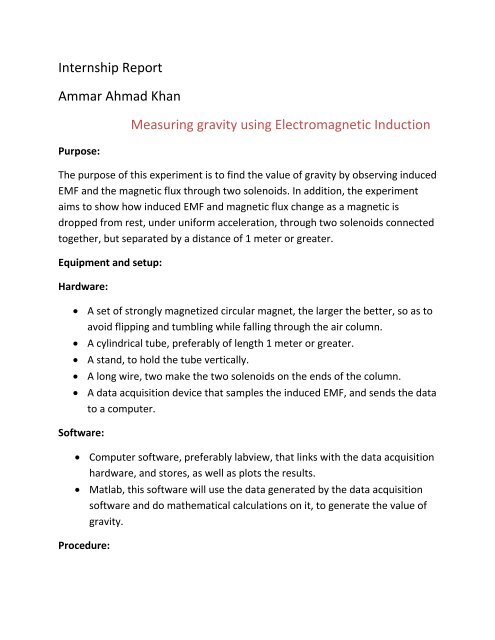
Internship ReportAmmar Ahmad KhanPurpose:<strong>Measuring</strong> <strong>gravity</strong> <strong>using</strong> <strong>Electromagnetic</strong> <strong>Induction</strong>The purpose of this experiment is to find the value of <strong>gravity</strong> by observing inducedEMF and the magnetic flux through two solenoids. In addition, the experimentaims to show how induced EMF and magnetic flux change as a magnetic isdropped from rest, under uniform acceleration, through two solenoids connectedtogether, but separated by a distance of 1 meter or greater.Equipment and setup:Hardware: A set of strongly magnetized circular magnet, the larger the better, so as toavoid flipping and tumbling while falling through the air column. A cylindrical tube, preferably of length 1 meter or greater. A stand, to hold the tube vertically. A long wire, two make the two solenoids on the ends of the column. A data acquisition device that samples the induced EMF, and sends the datato a computer.Software: Computer software, preferably labview, that links with the data acquisitionhardware, and stores, as well as plots the results. Matlab, this software will use the data generated by the data acquisitionsoftware and do mathematical calculations on it, to generate the value of<strong>gravity</strong>.Procedure:
Make two solenoids on the ends of the vertical column, with a minimum of tenturns each. The two coils should have one side connected to each other.Set the column on the stand; connect one coil to the positive terminal of the dataacquisition device and the other to the ground of the device. You should now beready to conduct the experiment. Run the simulation on the software, place themagnet at eh top of the column and drop it. Once the reading has been made,you can view the graphs generated and calculate the value of <strong>gravity</strong> manually, oruse the program on Matlab to do the work for you. The principle formula beingused here is:S= u*t + 0.5 * G*t 2S: the distance between the top of the first coil, and the middle of the second coil.t : time between the rise of the first waveform, and the middle of the secondwaveformu : initial velocity, this is set to zero, as the magnet is dropped from rest.G : the value of <strong>gravity</strong>, that is being measuredEither the value of G can be found by applying this formula directly, and <strong>using</strong> theplots of the waveforms to find the time intervals between the two magnets, or aprogram made on Matlab can be used, it is suggested to do both, as it will aid inthe understanding of the experiment.Interesting observations:It is interesting to note that as can be seen from a graph of the magnetic flux, andthat of the induced EMF, the magnetic flux has a maximum value at the sametime at which the EMF is zero. This can be explained by observing that themagnetic flux must be maximum in the middle of the coil, and at this point therate of change of magnetic flux is zero, hence we see a minima in the inducedEMF curve.
In an experiment performed with a single solenoid only, we can see from thegraphs, that at the time t=4 s the magnetic flux is maximum, where as the inducedEMF is zero, the graph is shown below:
Note: The graphs shown above are generated from an experiment conductedfrom a single solenoid, hence only one peak is seen for both the induced EMF andthe magnetic flux, this was illustrative purposes only, and the actual experimentshould be performed with two solenoids on a long column, as instructed above.Sample graphs of induced EMF and magnetic flux are shown below, from aparticular experiment:Emf:A close-up of the peaks is shown below:
Graphs of magnetic flux:
A close up of the graph:Results of an experiment consisting of 10 trials are shown below:Trial no. Gravity m/s 21 9.97162 9.87393 9.97554 9.88315 9.83966 9.90147 9.74088 9.91149 9.754310 9.8815Mean <strong>gravity</strong> = 9.89m/s 2Standard Deviation =0.07
A different setup:A different setup, to calculate the value of <strong>gravity</strong>, and to learn about inducedEMF and magnetic flux, is to use five solenoids wound on a column rather thanthe two used earlier. The five solenoids should be connected together, and theresults should be seen on the computer <strong>using</strong> the software and methods statedpreviously.This experiment allows for the calculation of 4 values of <strong>gravity</strong> in each trial,adding accuracy to the results, as an average can also be taken. The time is alwaystaken from the start of the first waveform, to the middle of the other waveform.The distances between the coils is measured, and the value of <strong>gravity</strong> iscalculated.The apparatus:The five solenoids should be wound on a column. The solenoids are be separatedfrom each other by at least 30cm. All the solenoids have the same number ofturns, ideally more than 15 turns.Results of a sample experiment:This experiment allows for the calculation of 4 values of <strong>gravity</strong> in each trial,adding accuracy to the results, as an average can also be taken.The waveforms of EMF:
Results:Trial Distance cm Velocity m/s Gravity m/s 2Between coil 1-2 30 2.35 9.23Between coil 1-3 62 3.44 9.54Between coil 1-4 108 4.53 9.5Between coil 1-5 124 5.2 9.43