Noise Reduction by Signal Accumulation - Experimental Physics
Noise Reduction by Signal Accumulation - Experimental Physics
Noise Reduction by Signal Accumulation - Experimental Physics

Create successful ePaper yourself
Turn your PDF publications into a flip-book with our unique Google optimized e-Paper software.
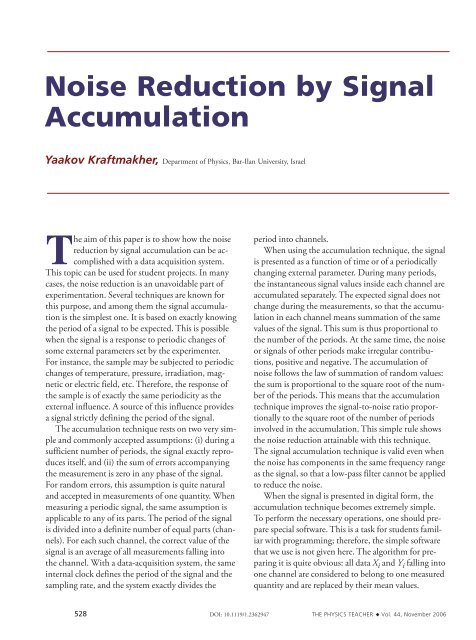
<strong>Noise</strong> <strong>Reduction</strong> <strong>by</strong> <strong>Signal</strong><strong>Accumulation</strong>Yaakov Kraftmakher, Department of <strong>Physics</strong>, Bar-Ilan University, IsraelThe aim of this paper is to show how the noisereduction <strong>by</strong> signal accumulation can be accomplishedwith a data acquisition system.This topic can be used for student projects. In manycases, the noise reduction is an unavoidable part ofexperimentation. Several techniques are known forthis purpose, and among them the signal accumulationis the simplest one. It is based on exactly knowingthe period of a signal to be expected. This is possiblewhen the signal is a response to periodic changes ofsome external parameters set <strong>by</strong> the experimenter.For instance, the sample may be subjected to periodicchanges of temperature, pressure, irradiation, magneticor electric field, etc. Therefore, the response ofthe sample is of exactly the same periodicity as theexternal influence. A source of this influence providesa signal strictly defining the period of the signal.The accumulation technique rests on two very simpleand commonly accepted assumptions: (i) during asufficient number of periods, the signal exactly reproducesitself, and (ii) the sum of errors accompanyingthe measurement is zero in any phase of the signal.For random errors, this assumption is quite naturaland accepted in measurements of one quantity. Whenmeasuring a periodic signal, the same assumption isapplicable to any of its parts. The period of the signalis divided into a definite number of equal parts (channels).For each such channel, the correct value of thesignal is an average of all measurements falling intothe channel. With a data-acquisition system, the sameinternal clock defines the period of the signal and thesampling rate, and the system exactly divides theperiod into channels.When using the accumulation technique, the signalis presented as a function of time or of a periodicallychanging external parameter. During many periods,the instantaneous signal values inside each channel areaccumulated separately. The expected signal does notchange during the measurements, so that the accumulationin each channel means summation of the samevalues of the signal. This sum is thus proportional tothe number of the periods. At the same time, the noiseor signals of other periods make irregular contributions,positive and negative. The accumulation ofnoise follows the law of summation of random values:the sum is proportional to the square root of the numberof the periods. This means that the accumulationtechnique improves the signal-to-noise ratio proportionallyto the square root of the number of periodsinvolved in the accumulation. This simple rule showsthe noise reduction attainable with this technique.The signal accumulation technique is valid even whenthe noise has components in the same frequency rangeas the signal, so that a low-pass filter cannot be appliedto reduce the noise.When the signal is presented in digital form, theaccumulation technique becomes extremely simple.To perform the necessary operations, one should preparespecial software. This is a task for students familiarwith programming; therefore, the simple softwarethat we use is not given here. The algorithm for preparingit is quite obvious: all data X i and Y i falling intoone channel are considered to belong to one measuredquantity and are replaced <strong>by</strong> their mean values.528 DOI: 10.1119/1.2362947 THE PHYSICS TEACHER ◆ Vol. 44, November 2006
Fig. 1. Diagram of setup to demonstrate the accumulationtechnique.The data stored <strong>by</strong> the data-acquisition systemrepresent a set of instantaneous values of X (time oran external parameter) and of periodically repeatedY (the signal + noise). When the data are obtained asa function of time, the software puts all X values intoone signal period set <strong>by</strong> the experimenter accordingto the period of the external influence. The softwaredivides the period into a definite number of channels,which is also set <strong>by</strong> the experimenter. Then meanvalues of all X i belonging to each channel are storedas X k values. The mean values of corresponding Y i arestored as Y k values. Here i is the number of a point insidea channel, and k is the channel number.Now it remains to plot a graph of Y k versus X k . Tomaintain good resolution, the number of the channelsshould be sufficiently large, but this requirementcontradicts the necessity to have many data pointsinside each channel for the averaging operation. Acompromise should thus be found between the tworequirements.To demonstrate the accumulation technique, weuse the ScienceWorkshop data acquisition systemwith DataStudio software from PASCO scientific(Fig. 1). A light emitting diode (LED) is fed <strong>by</strong> theSquare wave voltage from the <strong>Signal</strong> generator incorporatedinto the ScienceWorkshop 750 Interface. Thefrequency of this voltage is 200 Hz. The <strong>Signal</strong> generatoroperates in the Auto regime: it starts to producethe output voltage after starting the measurements. A50-Ω resistor limits the current through the LED. TheFig. 2. Data accumulated during 200 periods(10,000 experimental points) and signal recovered<strong>by</strong> the accumulation technique, with 50 and 25subdivisions of the period. Before amplification,the signal was of the order of 0.1 mV.rectangular light pulses illuminate a light dependentresistor (LDR). The LDR is connected in series witha dc source and a 1-kΩ load resistor (the resistance ofthe load is much smaller than that of the LED). Thevoltage on the load is amplified (G = 100) and thenmeasured <strong>by</strong> the Voltage sensor (PASCO, CI-6503).The data are displayed on the screen of a computer.In our case, random errors are added to the signal<strong>by</strong> the measuring system, and this case is typical formany real measurements. Therefore, the signal-tonoiseratio depends on the signal level. It is easy toincrease the latter <strong>by</strong> increasing the dc voltage appliedTHE PHYSICS TEACHER ◆ Vol. 44, November 2006 529