Noise Reduction by Signal Accumulation - Experimental Physics
Noise Reduction by Signal Accumulation - Experimental Physics
Noise Reduction by Signal Accumulation - Experimental Physics

You also want an ePaper? Increase the reach of your titles
YUMPU automatically turns print PDFs into web optimized ePapers that Google loves.
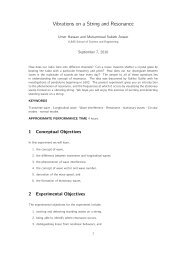
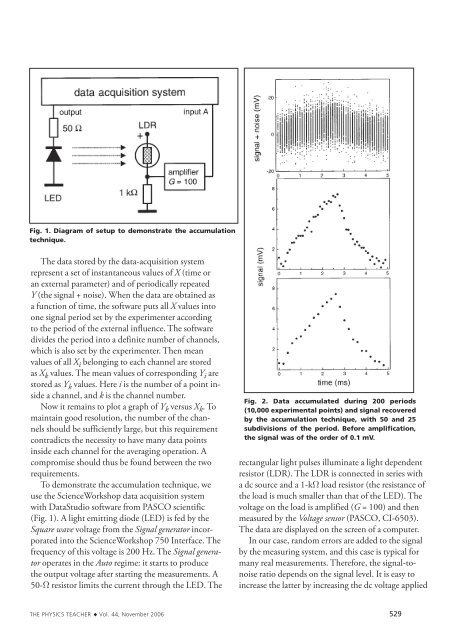
Fig. 1. Diagram of setup to demonstrate the accumulationtechnique.The data stored <strong>by</strong> the data-acquisition systemrepresent a set of instantaneous values of X (time oran external parameter) and of periodically repeatedY (the signal + noise). When the data are obtained asa function of time, the software puts all X values intoone signal period set <strong>by</strong> the experimenter accordingto the period of the external influence. The softwaredivides the period into a definite number of channels,which is also set <strong>by</strong> the experimenter. Then meanvalues of all X i belonging to each channel are storedas X k values. The mean values of corresponding Y i arestored as Y k values. Here i is the number of a point insidea channel, and k is the channel number.Now it remains to plot a graph of Y k versus X k . Tomaintain good resolution, the number of the channelsshould be sufficiently large, but this requirementcontradicts the necessity to have many data pointsinside each channel for the averaging operation. Acompromise should thus be found between the tworequirements.To demonstrate the accumulation technique, weuse the ScienceWorkshop data acquisition systemwith DataStudio software from PASCO scientific(Fig. 1). A light emitting diode (LED) is fed <strong>by</strong> theSquare wave voltage from the <strong>Signal</strong> generator incorporatedinto the ScienceWorkshop 750 Interface. Thefrequency of this voltage is 200 Hz. The <strong>Signal</strong> generatoroperates in the Auto regime: it starts to producethe output voltage after starting the measurements. A50-Ω resistor limits the current through the LED. TheFig. 2. Data accumulated during 200 periods(10,000 experimental points) and signal recovered<strong>by</strong> the accumulation technique, with 50 and 25subdivisions of the period. Before amplification,the signal was of the order of 0.1 mV.rectangular light pulses illuminate a light dependentresistor (LDR). The LDR is connected in series witha dc source and a 1-kΩ load resistor (the resistance ofthe load is much smaller than that of the LED). Thevoltage on the load is amplified (G = 100) and thenmeasured <strong>by</strong> the Voltage sensor (PASCO, CI-6503).The data are displayed on the screen of a computer.In our case, random errors are added to the signal<strong>by</strong> the measuring system, and this case is typical formany real measurements. Therefore, the signal-tonoiseratio depends on the signal level. It is easy toincrease the latter <strong>by</strong> increasing the dc voltage appliedTHE PHYSICS TEACHER ◆ Vol. 44, November 2006 529