A GIS-based flow model for groundwater resources management in ...
A GIS-based flow model for groundwater resources management in ...
A GIS-based flow model for groundwater resources management in ...

You also want an ePaper? Increase the reach of your titles
YUMPU automatically turns print PDFs into web optimized ePapers that Google loves.
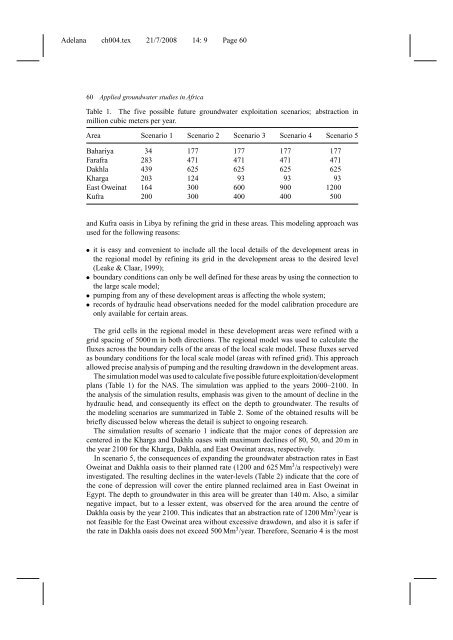
Adelana ch004.tex 21/7/2008 14: 9 Page 6060 Applied <strong>groundwater</strong> studies <strong>in</strong> AfricaTable 1. The five possible future <strong>groundwater</strong> exploitation scenarios; abstraction <strong>in</strong>million cubic meters per year.Area Scenario 1 Scenario 2 Scenario 3 Scenario 4 Scenario 5Bahariya 34 177 177 177 177Farafra 283 471 471 471 471Dakhla 439 625 625 625 625Kharga 203 124 93 93 93East Owe<strong>in</strong>at 164 300 600 900 1200Kufra 200 300 400 400 500and Kufra oasis <strong>in</strong> Libya by ref<strong>in</strong><strong>in</strong>g the grid <strong>in</strong> these areas. This <strong>model</strong><strong>in</strong>g approach wasused <strong>for</strong> the follow<strong>in</strong>g reasons:• it is easy and convenient to <strong>in</strong>clude all the local details of the development areas <strong>in</strong>the regional <strong>model</strong> by ref<strong>in</strong><strong>in</strong>g its grid <strong>in</strong> the development areas to the desired level(Leake & Claar, 1999);• boundary conditions can only be well def<strong>in</strong>ed <strong>for</strong> these areas by us<strong>in</strong>g the connection tothe large scale <strong>model</strong>;• pump<strong>in</strong>g from any of these development areas is affect<strong>in</strong>g the whole system;• records of hydraulic head observations needed <strong>for</strong> the <strong>model</strong> calibration procedure areonly available <strong>for</strong> certa<strong>in</strong> areas.The grid cells <strong>in</strong> the regional <strong>model</strong> <strong>in</strong> these development areas were ref<strong>in</strong>ed with agrid spac<strong>in</strong>g of 5000 m <strong>in</strong> both directions. The regional <strong>model</strong> was used to calculate thefluxes across the boundary cells of the areas of the local scale <strong>model</strong>. These fluxes servedas boundary conditions <strong>for</strong> the local scale <strong>model</strong> (areas with ref<strong>in</strong>ed grid). This approachallowed precise analysis of pump<strong>in</strong>g and the result<strong>in</strong>g drawdown <strong>in</strong> the development areas.The simulation <strong>model</strong> was used to calculate five possible future exploitation/developmentplans (Table 1) <strong>for</strong> the NAS. The simulation was applied to the years 2000–2100. Inthe analysis of the simulation results, emphasis was given to the amount of decl<strong>in</strong>e <strong>in</strong> thehydraulic head, and consequently its effect on the depth to <strong>groundwater</strong>. The results ofthe <strong>model</strong><strong>in</strong>g scenarios are summarized <strong>in</strong> Table 2. Some of the obta<strong>in</strong>ed results will bebriefly discussed below whereas the detail is subject to ongo<strong>in</strong>g research.The simulation results of scenario 1 <strong>in</strong>dicate that the major cones of depression arecentered <strong>in</strong> the Kharga and Dakhla oases with maximum decl<strong>in</strong>es of 80, 50, and 20 m <strong>in</strong>the year 2100 <strong>for</strong> the Kharga, Dakhla, and East Owe<strong>in</strong>at areas, respectively.In scenario 5, the consequences of expand<strong>in</strong>g the <strong>groundwater</strong> abstraction rates <strong>in</strong> EastOwe<strong>in</strong>at and Dakhla oasis to their planned rate (1200 and 625 Mm 3 /a respectively) were<strong>in</strong>vestigated. The result<strong>in</strong>g decl<strong>in</strong>es <strong>in</strong> the water-levels (Table 2) <strong>in</strong>dicate that the core ofthe cone of depression will cover the entire planned reclaimed area <strong>in</strong> East Owe<strong>in</strong>at <strong>in</strong>Egypt. The depth to <strong>groundwater</strong> <strong>in</strong> this area will be greater than 140 m. Also, a similarnegative impact, but to a lesser extent, was observed <strong>for</strong> the area around the centre ofDakhla oasis by the year 2100. This <strong>in</strong>dicates that an abstraction rate of 1200 Mm 3 /year isnot feasible <strong>for</strong> the East Owe<strong>in</strong>at area without excessive drawdown, and also it is safer ifthe rate <strong>in</strong> Dakhla oasis does not exceed 500 Mm 3 /year. There<strong>for</strong>e, Scenario 4 is the most