design and simulation of a solar pv system - BRAC University ...
design and simulation of a solar pv system - BRAC University ...
design and simulation of a solar pv system - BRAC University ...

You also want an ePaper? Increase the reach of your titles
YUMPU automatically turns print PDFs into web optimized ePapers that Google loves.
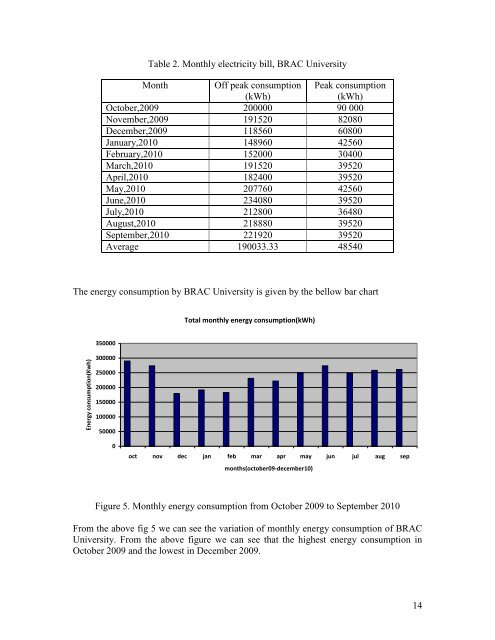
Table 2. Monthly electricity bill, <strong>BRAC</strong> <strong>University</strong><br />
Month Off peak consumption Peak consumption<br />
(kWh)<br />
(kWh)<br />
October,2009 200000 90 000<br />
November,2009 191520 82080<br />
December,2009 118560 60800<br />
January,2010 148960 42560<br />
February,2010 152000 30400<br />
March,2010 191520 39520<br />
April,2010 182400 39520<br />
May,2010 207760 42560<br />
June,2010 234080 39520<br />
July,2010 212800 36480<br />
August,2010 218880 39520<br />
September,2010 221920 39520<br />
Average 190033.33 48540<br />
The energy consumption by <strong>BRAC</strong> <strong>University</strong> is given by the bellow bar chart<br />
Energy consumption(Kwh)<br />
350000<br />
300000<br />
250000<br />
200000<br />
150000<br />
100000<br />
50000<br />
0<br />
Total monthly energy consumption(kWh)<br />
oct nov dec jan feb mar apr may jun jul aug sep<br />
months(october09-december10)<br />
Figure 5. Monthly energy consumption from October 2009 to September 2010<br />
From the above fig 5 we can see the variation <strong>of</strong> monthly energy consumption <strong>of</strong> <strong>BRAC</strong><br />
<strong>University</strong>. From the above figure we can see that the highest energy consumption in<br />
October 2009 <strong>and</strong> the lowest in December 2009.<br />
14