(CASAC) Peer Review of EPA's Integrated Science Assessment
(CASAC) Peer Review of EPA's Integrated Science Assessment
(CASAC) Peer Review of EPA's Integrated Science Assessment

Create successful ePaper yourself
Turn your PDF publications into a flip-book with our unique Google optimized e-Paper software.
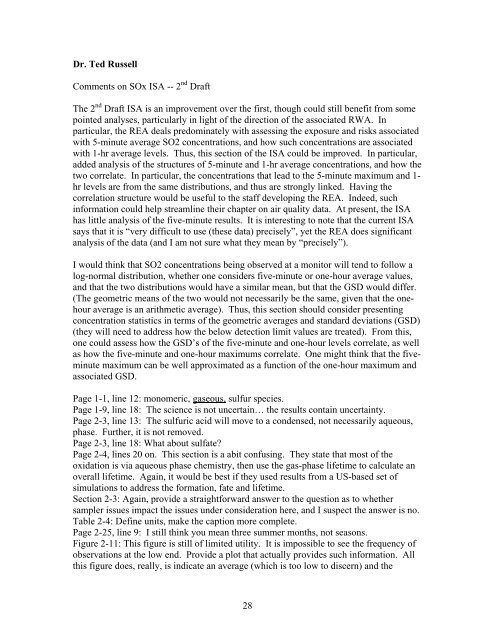
Dr. Ted RussellComments on SOx ISA -- 2 nd DraftThe 2 nd Draft ISA is an improvement over the first, though could still benefit from somepointed analyses, particularly in light <strong>of</strong> the direction <strong>of</strong> the associated RWA. Inparticular, the REA deals predominately with assessing the exposure and risks associatedwith 5-minute average SO2 concentrations, and how such concentrations are associatedwith 1-hr average levels. Thus, this section <strong>of</strong> the ISA could be improved. In particular,added analysis <strong>of</strong> the structures <strong>of</strong> 5-minute and 1-hr average concentrations, and how thetwo correlate. In particular, the concentrations that lead to the 5-minute maximum and 1-hr levels are from the same distributions, and thus are strongly linked. Having thecorrelation structure would be useful to the staff developing the REA. Indeed, suchinformation could help streamline their chapter on air quality data. At present, the ISAhas little analysis <strong>of</strong> the five-minute results. It is interesting to note that the current ISAsays that it is “very difficult to use (these data) precisely”, yet the REA does significantanalysis <strong>of</strong> the data (and I am not sure what they mean by “precisely”).I would think that SO2 concentrations being observed at a monitor will tend to follow alog-normal distribution, whether one considers five-minute or one-hour average values,and that the two distributions would have a similar mean, but that the GSD would differ.(The geometric means <strong>of</strong> the two would not necessarily be the same, given that the onehouraverage is an arithmetic average). Thus, this section should consider presentingconcentration statistics in terms <strong>of</strong> the geometric averages and standard deviations (GSD)(they will need to address how the below detection limit values are treated). From this,one could assess how the GSD’s <strong>of</strong> the five-minute and one-hour levels correlate, as wellas how the five-minute and one-hour maximums correlate. One might think that the fiveminutemaximum can be well approximated as a function <strong>of</strong> the one-hour maximum andassociated GSD.Page 1-1, line 12: monomeric, gaseous, sulfur species.Page 1-9, line 18: The science is not uncertain… the results contain uncertainty.Page 2-3, line 13: The sulfuric acid will move to a condensed, not necessarily aqueous,phase. Further, it is not removed.Page 2-3, line 18: What about sulfate?Page 2-4, lines 20 on. This section is a abit confusing. They state that most <strong>of</strong> theoxidation is via aqueous phase chemistry, then use the gas-phase lifetime to calculate anoverall lifetime. Again, it would be best if they used results from a US-based set <strong>of</strong>simulations to address the formation, fate and lifetime.Section 2-3: Again, provide a straightforward answer to the question as to whethersampler issues impact the issues under consideration here, and I suspect the answer is no.Table 2-4: Define units, make the caption more complete.Page 2-25, line 9: I still think you mean three summer months, not seasons.Figure 2-11: This figure is still <strong>of</strong> limited utility. It is impossible to see the frequency <strong>of</strong>observations at the low end. Provide a plot that actually provides such information. Allthis figure does, really, is indicate an average (which is too low to discern) and the28