Camera Identification from Printed Images
Camera Identification from Printed Images
Camera Identification from Printed Images

Create successful ePaper yourself
Turn your PDF publications into a flip-book with our unique Google optimized e-Paper software.
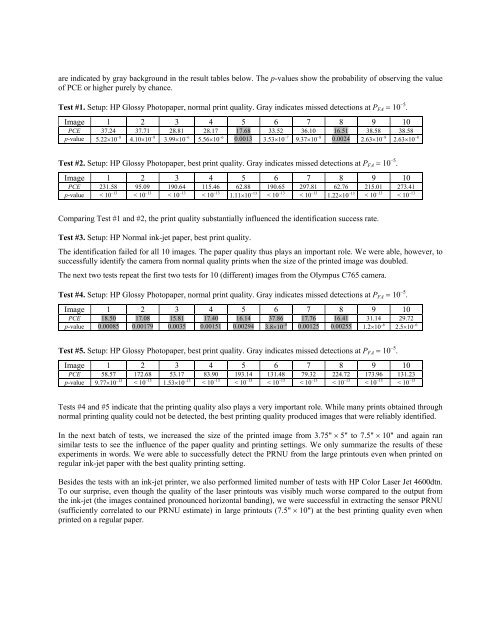
are indicated by gray background in the result tables below. The p-values show the probability of observing the valueof PCE or higher purely by chance.Test #1. Setup: HP Glossy Photopaper, normal print quality. Gray indicates missed detections at P FA = 10 –5 .Image 1 2 3 4 5 6 7 8 9 10PCE 37.24 37.71 28.81 28.17 17.68 33.52 36.10 16.51 38.58 38.58p-value 5.22×10 –8 4.10×10 –8 3.99×10 –6 5.56×10 –6 0.0013 3.53×10 –7 9.37×10 –8 0.0024 2.63×10 –8 2.63×10 –8Test #2. Setup: HP Glossy Photopaper, best print quality. Gray indicates missed detections at P FA = 10 –5 .Image 1 2 3 4 5 6 7 8 9 10PCE 231.58 95.09 190.64 115.46 62.88 190.65 297.81 62.76 215.01 273.41p-value < 10 –13 < 10 –13 < 10 –13 < 10 –13 1.11×10 –13 < 10 –13 < 10 –13 1.22×10 –13 < 10 –13 < 10 –13Comparing Test #1 and #2, the print quality substantially influenced the identification success rate.Test #3. Setup: HP Normal ink-jet paper, best print quality.The identification failed for all 10 images. The paper quality thus plays an important role. We were able, however, tosuccessfully identify the camera <strong>from</strong> normal quality prints when the size of the printed image was doubled.The next two tests repeat the first two tests for 10 (different) images <strong>from</strong> the Olympus C765 camera.Test #4. Setup: HP Glossy Photopaper, normal print quality. Gray indicates missed detections at P FA = 10 –5 .Image 1 2 3 4 5 6 7 8 9 10PCE 18.50 17.08 15.81 17.40 16.14 37.86 17.76 16.41 31.14 29.72p-value 0.00085 0.00179 0.0035 0.00151 0.00294 3.8×10 –8 0.00125 0.00255 1.2×10 –6 2.5×10 –6Test #5. Setup: HP Glossy Photopaper, best print quality. Gray indicates missed detections at P FA = 10 –5 .Image 1 2 3 4 5 6 7 8 9 10PCE 58.57 172.68 53.17 83.90 193.14 131.48 79.32 224.72 173.96 131.23p-value 9.77×10 –13 < 10 –13 1.53×10 –13 < 10 –13 < 10 –13 < 10 –13 < 10 –13 < 10 –13 < 10 –13 < 10 –13Tests #4 and #5 indicate that the printing quality also plays a very important role. While many prints obtained throughnormal printing quality could not be detected, the best printing quality produced images that were reliably identified.In the next batch of tests, we increased the size of the printed image <strong>from</strong> 3.75" × 5" to 7.5" × 10" and again ransimilar tests to see the influence of the paper quality and printing settings. We only summarize the results of theseexperiments in words. We were able to successfully detect the PRNU <strong>from</strong> the large printouts even when printed onregular ink-jet paper with the best quality printing setting.Besides the tests with an ink-jet printer, we also performed limited number of tests with HP Color Laser Jet 4600dtn.To our surprise, even though the quality of the laser printouts was visibly much worse compared to the output <strong>from</strong>the ink-jet (the images contained pronounced horizontal banding), we were successful in extracting the sensor PRNU(sufficiently correlated to our PRNU estimate) in large printouts (7.5" × 10") at the best printing quality even whenprinted on a regular paper.