BALTIC SEA ENVIRONMENT PROCEEDINGS No. 80
BALTIC SEA ENVIRONMENT PROCEEDINGS No. 80
BALTIC SEA ENVIRONMENT PROCEEDINGS No. 80
- No tags were found...

Create successful ePaper yourself
Turn your PDF publications into a flip-book with our unique Google optimized e-Paper software.
<strong>BALTIC</strong> <strong>SEA</strong> <strong>ENVIRONMENT</strong> <strong>PROCEEDINGS</strong><strong>No</strong>. <strong>80</strong>INTERCOMPARISON OF SEDIMENT SAMPLING DEVICESUSING ARTIFICIAL RADIONUCLIDES IN <strong>BALTIC</strong> <strong>SEA</strong>SEDIMENTS- The MOSSIE Report -HELSINKI COMMISSIONBaltic Marine Environment Protection Commission2000
<strong>BALTIC</strong> <strong>SEA</strong> <strong>ENVIRONMENT</strong> <strong>PROCEEDINGS</strong><strong>No</strong>. <strong>80</strong>INTERCOMPARISON OF SEDIMENT SAMPLING DEVICESUSING ARTIFICIAL RADIONUCLIDES IN <strong>BALTIC</strong> <strong>SEA</strong>SEDIMENTS- The MOSSIE Report -HELSINKI COMMISSIONBaltic Marine Environment Protection Commission2000
For bibliographic purposes this document should be cited as:HELCOM, 2000Intercomparison of Sediment Sampling Devices using Artificial Radionuclides in Baltic Sea Sediments- The MOSSIE Report -Baltic Sea Environ. Proc. <strong>No</strong>. <strong>80</strong>Information included in this publication or extracts thereof is free for citing on the conditionthat the complete reference of the publication is given as stated aboveCopyright 2000 by the Helsinki Commission- Baltic Marine Environment Protection Commission -ISSN 0357-2994
CONTENTSIntroductionGeneral errors involved in sediment samplingSampling arrangements and analyses . . . . . . .Description of sampling devices and techniquesSome notes on sampling on board the ArandaResults and discussionDepth profiles of radionuclides . . . . . . . . . .Statistical considerations . . . . . . . . . . .Impact of corer diameter or area . . . . . ..Characteristics of the sampling devices used inthe MOSSIE exerciseConclusions .. ...2526References . . . . . . . . . . . . . . . . . . . . . . . . . . . . . . . . . . . . . . . . . . . 29Figures 6-19 .......................................... 31Tables l-VI ........................................... 45Appendix - Analytical data ................................ 51Baltic Sea Environment Proceedings . . . . . . . . . . . . . . . . . . 70
INTRODUCTIONDuring the last four decades Baltic Sea sediments have been an excellent object for research byradioecologists and other scientists studying sedimentation and other processes in sediments usingartificial radionuclides deposited in sediment laminae of the seabed in chronological order. This is dueto two major events which have caused significant radioactive fallout in the Baltic Sea region, leavingdistinct markers in the corresponding layers of the sediments. One was the global fallout fromatmospheric nuclear weapon tests in the late 1950s and early ’60s, resulting in clear peaks of longlivedradionuclides such as Cs-137, Sr-90 and certain transuranic elements (especially Pu-239,240) inthe sediments. Another was the fallout from the accident at Chernobyl NPP, in the former USSR, inApril 1986. Since the first radioactive clouds from Chernobyl travelled north and caused highdeposition in the Baltic Sea region, the Baltic was the sea most affected by the accident (Povinec et al.,1996). The main long-lived constituents in this fallout were Cs-137 and Cs-134. These radioactivemarkers have since been utilised, e.g. in dating sediments and determining the sedimentation rate (e.g.Ilus, 1998).The sedimentation rate (mm a -1 ) and sediment accumulation rate (g cm -2 a -1 ) vary widely in the BalticSea, depending on the area and local environmental factors there. The rates may even be different atsampling points situated very near to each other. A study carried out in 1995-1996 showed that thesedimentation rates varied between 0.2 and 29 mm a -1 at different soft-bottom sampling sites in theBaltic Sea, depending on the sedimentation itself and the method used for calculation (Ilus et al.,2000). The corresponding accumulation rates of dry matter ranged from 0.006 to 0.90 g cm -2 a -1 . Theimportance of undisturbed, high-quality samples is especially pronounced in sedimentation ratestudies. The loss of soft surface sediments during sampling can significantly affect the results, at leastif the calculations are based on the Cs-137 and Pu-239,240 peaks.To get proper results, it is essential to obtain reliable samples from sediments. False conclusions are anobvious risk if the studies are based on biased field samples (Blomqvist, 1992). To be more precise, itis unreasonable to perform exacting and expensive analyses if the samples themselves are unreliableor of poor quality. However, sampling of the top, least consolidated sediments is difficult and, inaddition to properly designed devices, requires standardised, and precise working methods, as well asexperience and competence from the crew, including awareness of sources of error. Sedimentsampling is without doubt one of the most exacting sampling tasks in the aquatic environment. Theprime reason is that the upper, most recent layers of sediments are usually very soft and susceptible toresuspension, i.e. the interface between water and sediment resembles "a line drawn in water". Thefact that the crew normally can not see what is happening when the sampling device penetrates thesediment makes the work even more difficult (Ilus, 1996).The MORS (Monitoring of Radioactive Substances) Group of HELCOM (Helsinki Commission)handles radioactivity monitoring in the Baltic Sea. All the countries surrounding the Baltic Sea arepartners in this co-operation and all results from participating laboratories are reported and stored in ajoint database. The MORS monitoring programme includes regulatory sampling and analyses ofsediments at permanent stations performed by different partners, and the variety of sampling devicesused by different laboratories is great. The Group therefore decided to arrange an intercomparisonexercise on sediment sampling methods and devices called "MOSSIE" (MOrs Sediment SamplingIntercalibration Exercise) in 1992. The arrangements for the exercise, the devices compared and theresults are presented and discussed in this report. In addition to the authors, the following persons tookpart in the samplings on board the RV Aranda and RV Valdivia: Mr. Kari Huusela (STUK), Mr.Juhani Rapo and Ms. Maija Nyberg (Finnish Institute of Marine Research), Mr. Valerie Toporkov9* .KORSLQ 5DGLXP ,QVWLWXWH 0U /XW] %U JPDQQ ,QVWLWXW I U 2VWVHHIRUVFKXQJ :DUQHP QGHJan Tomczak and Rafal Stojaczek (Institute of Meteorology and Water Management, Poland). Ms.Taina Ilus was responsible for the statistical analysis of the results and the graphs contained in thisreport.
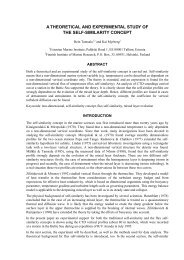
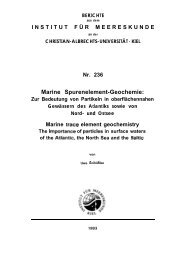
GENERAL ERRORS INVOLVED IN SEDIMENT SAMPLINGThe principal requirement for a perfect sediment sample is that it must be undisturbed. This means thatthe unconsolidated surface layers should remain undisturbed and unmixed and if conventional coringtubes or vessels are used, the covering water on top of the sediment should be as clear as it is in situ. Italso means that all the lower layers must be unmixed and at exactly the same depth in the sample as theyare in situ.The main errors involved in sediment sampling are (Fig. 1):(1) LOSS OF soft, watery and unconsolidated SURFACE SEDIMENTS as a result of- SCAVENGING (BLOW-AWAY) caused by the pressure wave ("shock wave" or "bow wave") builtup in front of the descending sampler;(2) MIXING and REDISTRIBUTION OF sampled SEDIMENT LAYERS as a result of the pressurewave, resuspension and other external or internal factors;(3) CORE SHORTENING = the difference between the depth of the corer’s penetration into thesediment and the interior length of the core, i.e. the core is compressed;(4) SMEARING = downflow of particles from the top layers to deeper layers along the core wallsduring coring and/or slicing;(5) EDGE EFFECT = loss of material from the margins of the sediment core, which means that thesurface area of the core is smaller than the orifice of the corer;(6) BRIMMING = filling of the sampler up to the brim;(7) TILTING of the sampling device at the bottom;(8) LOSS OF ENCLOSED MATERIAL as a result of brimming or tilting;(9) INGRESS OF SEDIMENT FROM THE OUTSIDE into the sample as a result of brimming,tilting or resuspension.The most important characteristic of a sampling device is that it must allow an unhindered flow of waterthrough the corer during descent and the penetration into the sediment. Otherwise, the hydraulic shockwave (bow wave) created in front of the orifice may laterally disperse the easily resuspended surfacesediments before the corer reaches the sediment surface (Blomqvist, 1992). In all respects, goodhydrodynamic design of the corer is of great importance in avoiding the consequences of the shock wave.Many corers tend to tilt at the bottom when the attachment wire slackens. The taller the sampling device,the greater the risk of tilting; a high centre of gravity further increases the risk. Loss of the enclosedmaterial and ingress of sediment from the outside are not the only consequences of tilting. Inside, tiltingmay cause accumulation of the surface sediment on one side and a wedge-shaped gap in the sediment onthe opposite side between the bulk sediment and the wall of the corer (Blomqvist, 1992). This gap isoften filled by material from the surface layer, which causes errors in the slicing as well as a slopingsurface in the sample itself.The risk of core shortening when small-diameter gravity corers are used has been widely discussed (e.g.Blomqvist, 1985). Nevissi et al. (1989) stated that the shortening of sediment cores is an artefact ofcoring processes and occurs to some extent in almost any coring device. It is related not only to the typeof coring device but also the sediment properties and the velocity of corer penetration into the sediment.As the core barrels are inserted into the sediment, friction along the barrel walls causes core shortening(Jahnke and Knight, 1997). Morton and White (1997) reported that core shortening can result fromseveral different processes, including physical compaction, sediment thinning and sediment bypassingduring sampling. The amount of core shortening as a function of the corer’s penetration depth is affectedby core diameter and penetration velocity (Blomqvist, 1992). In general, there is less core shortening incorers with a large diameter and when the penetration is slow. In extremely soft surface sediments withvery high water content, core shortening is usually low.
B .EFig. 1. General sources of error in sediment sampling. A = an undisturbed sample, B = scavenging, C = mixing, D = core shortening, E = brimming.F = smearing, G = planing; “edge effect”, H = ingress of material from outside, I = tilting.
Further down, the sediment gradually becomes more compact and the friction against the inner wall ofthe coring tube increases. When the corer reaches a depth where the ratio between the wall friction andthe aperture area of the corer becomes critical, the sediment core begins to act partly as a plough and coreshortening begins. Clayey, silty sediments are compressed more than light, unconsolidated, organicsediments, and the beginning of the shortening is related to the corer diameter (Blomqvist, 1992).Exclusionary core shortening typically occurs where relatively stiff, low-porosity sediments overlie azone of soft sediments and the soft sediments are driven aside as the core barrel containing high-densitysediments penetrates deeper (Morton and White, 1997).If recently contaminated particles in the top layer are dragged downwards along the inner wall of thecoring tube and are then found in older, deeper layers than those "in situ", the consequences of thesmearing effect are particularly disturbing in studies of sedimentation rate based on the verticaldistribution of radionuclides. Some intercomparisons have shown that the risk of smearing effect ishigher in corers with small diameters (Aarkrog and Dahlgaard, 1989, Nies et al., 1990), but the problemmight also be related to the consistency of the bottom, the penetration velocity and tilting of the corer.Problems linked with small-diameter gravity corers in the collection of soft and highly porous sedimentshave been discussed in many publications. Baxter et al. (1981) reported that small-diameter gravitycoring and possibly other techniques using heavy and high-velocity devices in unconsolidated surfacesediments can induce extensive loss of material while simultaneously distorting the vertical distributionof sedimentary species of interest. They argued that the extensive sediment loss and mixing processwhich accompanies gravity coring produces quite feasible, and thus particularly misleading, verticalprofiles of chemical parameters, and concluded that a soft-landing hydraulically-damped coring device ismore reliable for such work. However, their results were based on experiments in which the corer wasallowed to free-fall from a few metres above the sediment surface to the bottom. Evans & Lasenby(1984) showed that the deficiency in coring with gravity corers can be attributed to the high velocity atwhich the corers fall through the water column and then enter the sediments, resulting indispersion/blown-away of the surface sediments due to the "shock wave" effect. They tested whethercores taken with a gravity corer making a slow descent into the sediments would give chemical profilessimilar to those taken carefully by Scuba divers, and found that there is no evidence to reject thehypothesis that in soft, recent sediments, "slow impact" gravity cores are comparable to diver cores.To obtain reliable samples, gentle, slow entry and penetration of the coring tube/box into the sedimentare essential in order to prevent loss of the flocculent surface sediments. It is clear that the uppermost softsediments are often seriously disturbed or entirely lost when a free-falling corer is used (Blomqvist,1992).Favourable weather conditions and maximum ship stability are naturally advantageous in obtainingundisturbed and reliable samples. If sampling is performed in a small vessel in shallow waters, anchoringis always recommended before sampling. The attachment wire should be lowered as vertically aspossible, because bias from the vertical results in tilting of the corer. Supplying the corer with asupporting frame may reduce tilting in difficult circumstances.Repenetration of the corer into the sediment may easily lead to misinterpretations. Rolling and pitchingof the vessel may cause a problem when the sampler hits the bottom, resulting in disturbance before thecorer actually enters the sediment (Blomqvist, 1992).The sample may also be disturbed during the corer closing operation or its withdrawal from the sediment,and during retrieval (Blomqvist, 1992). These stages may, therefore, also require careful, gentle work.Rotation of a corer during retrieval causes shear stress on the sediment. Since the rate of motion increaseswith the sample area, large-area instruments tend to produce more disturbance (Blomqvist, 1992). Toavoid rotation, a swivel should always be connected to the wire.
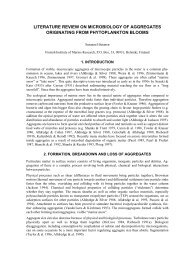
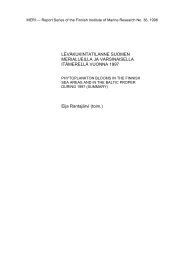
SAMPLING ARRANGEMENTS AND ANALYSESIn 1992 the HELCOM/MORS Group arranged an intercomparison exercise called "MOSSIE" onsediment sampling devices and methods. The exercise involved experts and sampling devices from fiveBaltic Sea countries and was carried out using two research vessels: the Valdivia from Germany and theAranda from Finland. Research groups from Germany and Poland were present on board the Valdivia,while groups from Russia, Sweden and Finland were on board the Aranda (Figs 2-4) .The arrangement for the MOSSIE exercise was that the Valdivia and Aranda should meet simultaneouslyat four sampling stations and the samples should be taken in parallel as close to each other as possible.However, even before she reached the first sampling station the Valdivia experienced a technical fault,and the repair caused a delay of three and a half days in its cruise schedule. This incident prevented threeof the planned meetings with the Aranda at sea and the only station with both ships workingsimultaneously was station XV-1 in the eastern Gulf of Finland. The Aranda complied with the originalcruise schedule and the Valdivia visited the three other stations a few days later, using exactly the sameco-ordinates as the Aranda had done. Before establishing the final co-ordinates, echo sounding at 12 kHzwas used on the Aranda to confirm the sediment quality.The exercise was carried out at the four sampling stations in different subareas of the Baltic Sea (Fig. 5).The stations represent different types of sediment characteristics of the Baltic. The co-ordinates anddepths of the stations are listed below:Code Lat. Lon. Depth [m] Date [Aranda] Date [Valdivia]BY-15 57°18.96’ N 20°01.99’ E 237 02 July 1992 06 July 1992Teili-1 59°25.77’ N 21°29.39’ E 160 05 July 1992 09 July 1992XV-1 60°14.99’ N 27°14.73’ E 62 08 July 1992 08 July 1992EB-1 61°03.35’ N 19°43.14’ E 135 04 July 1992 10 July 1992The deepest station, BY-15 in the Gotland Deep, represents the watery, anoxic sediment typical of thedeep area of the central Baltic Proper, containing rather small amounts of Chernobyl-derivedradionuclides. A brownish fluffy layer of organic detritus material 15-20 mm thick, (decomposed organicmatter, remains of the copepod Bosmina and diatom shells, as identified by microscopy on board) wasobserved covering the gelatinous laminated sediment package typical of the central Gotland Basin.Anoxic conditions are also characteristic of the station Teili-1 in the <strong>No</strong>rthern Baltic Proper, where thecontamination caused by the Chernobyl fallout is somewhat higher than in the Gotland Deep.Station EB-1 represents an oxic and relatively compact clay-mud bottom, typical of the central BothnianSea, and contains far higher amounts of radionuclides originating from the Chernobyl fallout than theprevious two.
Fig. 2. R/V ARANDA at station XV-1.Fig. 3. R/V VALDIVIA at station XV-1.
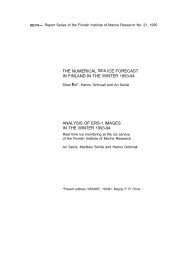
Fig. 4. The MOSSIE 1992 research group and the sediment samplers on board the ARANDA.7
Fig. 5. Location of the sampling stations.Station XV-l is situated in the eastern Gulf of Finland and represents an area where the amount of falloutnuclides in sediments is higher than at any of the other stations already mentioned. Anoxic conditionsfrequently occur in this basin too, where the sediment is very watery and consists mainly of blacksulphidic mud.The samples were sectioned into 1,2 or 5 cm thick slices on board immediately after the sampling usingthe particular sectioning equipment and technique varying according to the device (see below). If morethan one slice was needed for analysis, parallel sections from an appropriate number of core tubes orbarrels were combined and placed in plastic boxes or bags, which were then (without delay) stored infreezer boxes on board. Before analysis the samples were freeze-dried and homogenised.All the sediment slices were analysed for gamma-emitting radionuclides and some of them also for Pu-238, Pu-239,240 and Am-241. Each laboratory analysed its own samples using its own standardmethods. The quality of analysis at each laboratory is currently controlled in intercalibration exercisesarranged by the Marine Environment Laboratory (MEL) of the International Atomic Energy Agency(IAEA), Monaco (Ballestra et al., 1995).8
DESCRIPTION OF SAMPLING DEVICES AND TECHNIQUESSampling device: AQUARIUS Box Corer (STUK)Type of corer: a frame-supported box corer with an inner coring “aquarium” made of PlexiglasTotal height: 85 cmTotal weight: 26 kg + additional weights 12.5 kgClosing mechanism: closing jaws and a cutting bottom-plate, which is inserted on the deck beforeremoving the “aquarium” from the corerHeight of the “aquarium”: 30 cmInner square cross-section of the “aquarium”: 182 x 183 mmSampled area: 333.1 cm 2Number of parallel samples/analysis: 1Sectioning device: modified from that of the Niemistö Corer, consisting of a plastic square piston, aPlexiglas slicer base and slice holders with thin sliding cover-plates used to section the sub-samplesSectioning intervals: 2 or 5 cmDescribed in: Klemola et al., 1991.
Sampling device: GEMINI Twin Corer (FIMR; used by Finland and Russia)Type of corer: a gravity corer with 2 parallel Plexiglas coring tubesTotal length: 132 cmTotal weight: 33 kg + additional weights, max. 32 kgClosing mechanism: 2 lateral rudder closersTube length: 79 cmInner diameter of tubes: 2 x <strong>80</strong> mmSampled area: 100.5 cm 2Number of parallel samples/analysis: 1 or 2Sectioning device: identical with that of the Niemistö Corer but with a larger diameter. It consists of ascrew-operated extruder-piston, a Plexiglas slicer base and a Plexiglas slicing ring with centimetrescalingSectioning intervals: 1 or 2 or 5 cmA second version of Gemini, Gemax, is described in: Winterhalter, 1998.10
Sampling device: Large Box Corer (BSH)Type of corer: a frame-supported large box corer with portable inner 3mm stainless steel boxTotal height: 255 cm (diameter of the supporting frame: 235 cm)Total weight: <strong>80</strong>0 kgClosing mechanism: lateral bottom closerHeight of the box: 50 cmInner measures of the box: 500 x 500 mmTotal area of one haul: 2500 cm 2Number and inner diameter of the subsample tubes: 2 x ø 94 mm acrylic glass tubesArea of subsamples: 138.8 cm 2Number of parallel hauls/analysis: 1Sectioning device: consists of a plastic piston with centimetre scaling and a slicing unit with 1 or 2 cmaluminium rings, which are used to cut and remove sediment slicesSectioning intervals: 2 cmDescribed in: not published.11
Sampling device: LIMNOS Sediment Sampler (STUK)Type of corer: a gravity corer with a series of plastic rings placed on top of one anotherTotal length: 94 cmTotal weight: 4 kg + 2 to 6 lead weights, 1.7 kg each (= max. 4 + 10 kg)Closing mechanism: lateral bottom closerTube length: 66.5 cmInner diameter: 93 mmSampled area: 67.9 cm 2Number of parallel samples/analysis: 1 or 2Sectioning device: slicing is performed by rotating the rings around their one axle so that it cuts asediment layer of a similar thicknessSectioning intervals: 1 or 2 or 5 cmDescribed in: http://www.limnos.fi12
Sampling device: NIEMISTÖ Corer (STUK; used by Finland and Sweden)Type of corer: a gravity corer with an inner Plexiglas coring tubeTotal length: 140 cmTotal weight: 13 kg + additional weights, max. 28 kgClosing mechanism: lateral rudder closerTube length: 88 cmInner diameter of coring tube: 50 mmSampled area: 19.6 cm 2Number of parallel samples/analysis: 5 or 10Sectioning device: sectioning apparatus with a screw-operated core-extrusion piston, a Plexiglas slicerbase and slice holders with thin cover-plates for subsamples of varying thickness (0.5-5 cm)Sectioning intervals: 1 or 2 or 5 cmDescribed in: Niemistö, 1974.13
Sampling device: NIEMISTÖ Corer (Germany)Type of corer: a gravity corer with an inner Plexiglas coring tube (copy of the original Niemistö corerwith a larger tube diameter)Total length: 140 cmTotal weight: 13 kg + additional weights 32 kgClosing mechanism: lateral rudder closerTube length: 88 cmInner diameter of coring tube: 54 mmSampled area: 22.9 cm 2Number of parallel samples/analysis: 3 (BY-15) or 4 (others)Sectioning device: see Niemistö Corer aboveSectioning intervals: 2 cmDescribed in: Nies et al., 1990, p. 40 (IFM Sampler).
Sampling device: SELENA Corer (FIMR)Type of corer: a gravity corer with an inner Plexiglas coring tube (maxi version of the STUK Corer)Total length: 79 cmTotal weight: 25 kgClosing mechanism: spring operated bottom valve released by a messenger weightTube length: 70 cmInner diameter: 100 mmSampled area: 78.5 cm 2Number of parallel samples/analysis: 2Sectioning device: an extruder piston, a plastic slicer base and a Plexiglas slicing ring with centimetrescalingSectioning intervals: 2 or 5 cmDescribed in: not published.15
Sampling device: Small Box Corer (BSH)Type of corer: a frame-supported box corer with an inner 1.5mm stainless steel boxTotal height: 160 cm (supporting frame: 110 x 75 cm)Total weight: 20 kg to <strong>80</strong> kg (with lead weights)Closing mechanism: lateral bottom closerHeight of the box: 20 cmInner measurements of the box: 150 x 150 cmTotal area of one haul: 225 cm 2Number and inner diameter of the subsample tubes: 1 x ø 94 mm acrylic glass tubeArea of subsamples: 69.4 cm 2Number of parallel hauls/analysis: 2Sectioning device/method: the same as in the large box corerSectioning intervals: 2 cmDescribed in: not published.
Sampling device: SPRUT Corer (CLOR and KRIL; used by Poland and Russia, referred to in text asSPRUT POL and SPRUT RUS)Type of corer: a gravity corer with an inner Plexiglas coring tubeTotal height: 88 cmTotal weight: 20 kg + additional weights 10 kg (8 x 1.25 kg)Closing mechanism: bottom closed by 12 extruding, flexible, wedge-shaped brass platesTube length: 59 cmInner diameter of coring tube: 86 mmSampled area: 58.1 cm 2Number of parallel samples/analysis: 1 (RUS) or 2 (POL in general)Sectioning device: RUS: identical with that of the STUK Corer but with a larger diameter,POL: an extruder piston, slicing plate and ringSectioning intervals: 2 or 5 cmDescribed in: not published.16
Sampling device: STUK CorerType of corer: a gravity corer with a thick stainless-steel body and an inner Plexiglas coring tubeTotal length: 55 cmTotal weight: 12.5 kgClosing mechanism: spring-operated bottom valve released by a messenger weightTube length: 50 cmInner diameter of coring tube: 64 mmSampled area: 32.2 cm 2Number of parallel samples/analysis: 3Sectioning device: an extruder piston and simple Plexiglas slicing units with sliding cutting platesSectioning intervals: 2 or 5 cmDescribed in: Klemola et al., 1991.18
SOME NOTES ON SAMPLING ON BOARD THE ARANDA<strong>No</strong>tes of this kind were available only from the Aranda. The sampling programme usually took oneday at each station. The weather conditions were quite favourable for sampling. At stations BY-15 andTeili-1 the wind speed was about 10 m s -1 and the swell was moderate. At station EB-1 the wind speed(about 12 m s -1 ) and the waves were slightly higher. The ship was kept firmly in place the whole day,but the waves might have influenced the sampling somewhat. At station XV-1 the wind was light andthe waves were low.There were some clear differences in the sampling procedures. The Sprut Corer was allowed to fall ata relatively high speed into the sediment, while the others (especially Aquarius, Gemini and STUK)were lowered very slowly and carefully when the corer was approaching the bottom. Secondly, in allthe samples other than those taken by the Sprut Corer, a wash bottle filled with local sea water wasused to rinse the sediment remains into the sample boxes from the slice holders or slicing rings. Thepurpose was to obtain total dry weight and radionuclide values for the unit of area.At each station the Aquarius Corer was operated without additional weights, but even so it was almostfilled up to the brim at station XV-1, where the sediment was extreme soft. From the two samplestaken with the Aquarius Corer at stations Teili-1 and XV-1, the second ones looked better visually (seeTables in Appendix). Nevertheless, all the samples taken by the Aquarius Corer during this surveywere of excellent quality. The sediment surface was undisturbed, straight and horizontal, without anysign of scavenging, smearing or tilting. The overlying water was clear and full of small benthicanimals, such as Monoporeia affinis, Mysis relicta and Harmothoë sarsi at stations EB-1 and Teili-1.The Gemini Corer was operated without additional weights, too. It was only used at stations BY-15and Teili-1, but all the samples looked fine, with minimal signs of smearing. The Niemistö Corer waschosen in advance as a reference corer in this exercise, so it was the most frequently used device. Itwas always operated with 3 additional weights (adding 10.5 kg). In general the samples looked fine,with an even surface and clear overlying water, but quite frequently the edges of the core seemed to beslightly detached from the wall of the coring tube, and clear signs of smearing could be seen. Thequality of the Swedish and Finnish samples taken by the Niemistö Corer was generally of the samestandard. However, the Swedish samples were sliced with a slicing ring (ref. Gemini Corer) and theFinnish samples with slice holders. Both teams used wash bottles and local sea water to rinse theslicing tools.The samples taken by the Sprut Corer appeared to be mixed immediately after sampling. The water onthe top of the sediment core was black due to disturbance of the surface sediments. However, thecoring tubes were allowed to stand for several hours (or overnight). The overlying water was thendecanted and filtered before slicing. The aim was to analyse the filters and to add these amounts to thesurface sediment results.The Selena and STUK Corers were tested only at station EB-1 and the Limnos sampler at station XV-1. The cores taken by the STUK Corer looked excellent and also those taken by the Selena Corer andLimnos Sampler were of good quality and fulfilled our quality requirements. Nevertheless, there wereminor difficulties in slicing of the first Limnos sample due to the very loose surface sediments.
RESULTS AND DISCUSSIONBottom sediments play an important role in aquatic ecosystems, because they usually act as a final sinkfor organic material produced in the water phase, as well as for other particles transported by watercurrents from adjacent sea areas or other water courses and from adjacent terrestrial areas. As they slowlysink, the particles tend to bind foreign substances from the water phase and sweep them to the bottom(e.g. radionuclides and other contaminants).In favourable sedimentation conditions, suspended particles form undisturbed laminae in chronologicalorder, and bottom sediments create an archive from which the historical features of a lake or sea area canbe read. Various particle-bound substances can be used as markers of certain historical events or periods.With the aid of these markers the laminae can be dated. Consequently, the amounts of Chernobylderivedradionuclides, for example, in sediments and their depth distribution in different sediment layersprovide an excellent opportunity to study any errors caused by different sampling equipment ortechniques. The concentration peaks of certain transuranic elements (e.g. Pu-238 and Pu-239,240) causedby weapons test fallout in the 1950s and ’60s also provide useful markers in sedimentological studies.The analysis results for different slices of the sediment cores taken during the MOSSIE exercise aregiven in the Appendix. The vertical profiles of Cs-137 and Cs-134 and the total amounts of Cs-137 inthe entire cores are shown in Figs 6-13. <strong>No</strong>rmally the samples were analysed at the laboratory thattook the samples. However, two cores taken by the Finnish Gemini Twin Corer were analysed by theKhlopin Radium Institute, Russia (stations Teili-1 and XV-1).In connection with the sampling exercise the IAEA-MEL, Monaco, arranged an intercalibrationexercise on radionuclide analyses based on 3 sediment samples taken from the Baltic Sea (IAEA-300,-378, -379). The samples were provided by BSH, Germany (IAEA-300 from the Bothnian Sea andIAEA-378 from the Gotland Deep) and the Polish Institute of Oceanology, Sopot (IAEA-379 from theGulf of Gdansk). The results have been published (Ballestra et al., 1994) and generally showed verygood comparability between the MORS laboratories.Depth profiles of radionuclidesStation BY-15At station BY-15 (237 m) in the Gotland Deep, the type of sediment is very soft and the water content inthe surface layers of the sediment is very high. Thus, there is a significant risk that the surface layers willbe disturbed, mixed or even blown away during sampling. The relatively low concentrations of Cs-137were generally restricted to the uppermost layers of the sediment (Fig. 6).The lowest dry weight values (0.03-0.04 g cm -3 ) in the surface layer (0-2 cm) were sampled with theNiemistö G (=German), Gemini and Niemistö A (=Aranda) corers and the highest (0.21-0.25 g cm -3 )with the Small Box Corer and Large Box Corer. The highest Cs-137 peak (207 Bq kg -1 dry wt.) was alsoobtained with the Niemistö G, but the highest total value in the whole profile (630 Bq m -2 ) was obtainedwith the Aquarius. At this station quite comparable Cs-137 results were obtained with the Niemistö G,Aquarius, Gemini, Sprut and Niemistö A. In some of the cores, relatively high concentrations of Cs-134were detected from below the uppermost 0-2 centimetres (Fig. 7), which might indicate appearance ofthe smearing effect. Plutonium was not analysed at this station.
Station Teili-1At station Teili-1 (160 m) in the <strong>No</strong>rthern Baltic Proper, the sediment type is also anoxic sulphidic mud,which is almost as soft as the sediments in the Gotland Deep. The peak concentrations and the totalamounts of Cs-137 in the whole sediment profile are, however, far higher than at BY-15.The dry weight values of the surface sediment layer obtained with different corers were quite close toeach other, ranging from 0.09 to 0.15 g cm -3 . The lowest dry weights were sampled with the NiemistöA, Niemistö G and Sprut POL and the highest with the Gemini RUS. The highest Cs-137 peak (545Bq kg -1 dry wt.) was obtained from the uppermost 0-2cm layer with the Sprut POL, as well as thehighest total amount in the whole sediment profile (4940 Bq m -2 ). However, the cores taken by theGemini and Niemistö A, and sectioned into 1-cm slices, show that the Chernobyl peak occurred in 1992in the 1-2 cm layer (Fig. 8). At this station the Cs-137 profiles obtained with the Niemistö A, Geminiand Sprut RUS were quite similar and the parallel cores taken with the Aquarius were almostidentical. Likewise, the two profiles obtained with the Sprut POL and that obtained with the NiemistöG were similar. In the last-mentioned cores, significant amounts of Cs-137 were found in the layersbelow 10 cm unlike the other cores. It is possible, that there was a small difference in the samplingpositions of the Aranda and Valdivia and at this station it may significantly influence the resultsbecause of the varying bottom topography.In a majority of the cores, Cs-134 was detected only in the uppermost 4-6 cm, but in some cores it wasvisible down to 20 cm, which may be due to the smearing effect (Fig. 9). Only one Gemini core wasanalysed for Pu-239,240 and in this core the Pu peak (9.4 Bq kg -1 dry wt.) originating from weaponstest fallout occurred in the 6-7 cm sediment layer.Station XV-1At station XV-1 (62 m) in the eastern Gulf of Finland, the type of sediment is very loose organic andanoxic sulphidic mud and it is therefore often difficult to obtain undisturbed sediment samples fromthis station. The highest peak concentrations of Chernobyl-derived Cs-137 were detected at thisstation, although the highest total amounts in the whole sediment profile occurred at station EB-1 inthe Bothnian Sea.The lowest dry weight values in the surface layer (0.08-0.09 g cm -3 ) were sampled with the NiemistöA and Limnos corers and the highest (0.15-0.17 g cm -3 ) with the Sprut POL and Large Box Corer. Thehighest peak concentration of Cs-137 (4700 Bq kg -1 dry wt.) was recorded in the 5-6 cm slice takenwith the Limnos corer, but the highest total amount of Cs-137 in the whole sediment profile wasobtained with the Sprut POL. The Cs-137 profiles of different corers deviated most markedly fromeach other at this station (Fig. 10), as well as the total amounts of Cs-137, which ranged from 2,600 to35,200 Bq m -2 . Even the parallel cores taken by the Aquarius, Limnos, Sprut POL, Sprut RUS andNiemistö A differed considerably from each other. Traces of smearing effect were obvious in the Cs-134 profiles of almost all the corers (Fig. 11). In the cores taken by the Niemistö G and Limnos, thePu-239,240 peak occurred in the 8-10cm or 10-12cm slice, but in those taken by Sprut they wereroughly twice as deep.Station EB-1At station EB-1 (135 m) in the central Bothnian Sea, the type of sediment is more compact than at theother stations. Due to the oxic conditions in the near-bottom water, the uppermost layers of sedimentare affected by strong bioturbation. At this station the total amounts of Cs-137 in the whole sedimentprofiles were higher than at any other station.
The lowest dry weight values in the surface layer (0.20-0.22 g cm -3 ) were sampled with the NiemistöA, Sprut RUS, Niemistö G, Aquarius and STUK corers and the highest (0.26-0.29 g cm -3 ) with theSprut POL and Selena corers. The highest peak concentration of Cs-137 (1750 Bq kg -1 dry wt.) wasobtained from the surface sediment layer with the Sprut RUS (Fig. 12), as well as the highest totalamount in the whole sediment profile (46,700 Bq m -2 ). Quite comparable results were obtained withSprut RUS, Aquarius, Niemistö G, Selena, STUK and Niemistö A.In some of the cores, relatively high concentrations of Cs-134 were obtained from sediment layersbelow 10 cm, which is probably due to the smearing effect (Fig. 13). The Pu-239,240 peak occurred ata depth of 8-10 cm in the cores taken using the Sprut POL and Small Box Corer, but in the 10-15 cmslice in the core taken using the STUK corer.Statistical considerationsStatistical analysis of the MOSSIE data proved to be difficult or even impossible. A general problemin analysis of this kind of data is that it is difficult to determine the "best result", i.e. the referencevalue. The use of a mean value or median in this context is generally not correct, because in manycases a maximum or a minimum value can be argued to be the best result (e.g. the highest totalamount of Cs-137 in the profile).Especially in the MOSSIE data, the main weakness was in the planning of the sampling, which wasnot systematic enough. To be able to examine the data statistically, the samples should always betaken with the same set of corers and always using the same slicing. In addition, a sufficient number ofparallel cores should be taken with each corer. The present data include plenty of separate resultswithout parallel samples, so it is impossible to determine the error and confidence limits, for instance.One specific problem in the MOSSIE data was the considerable differences between some of thecorers, and consequently the incoherence of the results.The significance of small differences in sampling positions relative to the patchiness of radionuclidesin sediments and sedimentation rates is an open question. It was stated above that the result may differmarkedly, even at sampling points situated very close to each other. During the MOSSIE exercise theexact sampling positions might sometimes differ slightly in the case of the numerous cores taken froman individual ship, and especially between the two ships. When the ships were at station XV-1 at thesame time, the distance between them was about 0.5 nmi. Elsewhere the ships visited the stationsseparately.Nevertheless, serious efforts were made to find statistical differences in the results obtained withdifferent corers. The following criteria were used independently to examine the results:1) The corer yielding the lowest dry weight (g cm -3 ) for the surface layer was chosen as the referencecorer- deviation may indicate an appearance of scavenging2) The corer yielding the highest Cs-137 (peak) concentration (Bq kg -1 dry wt.) in some of the sectionswas chosen as the reference corer- deviation may indicate eventual scavenging, mixing or smearing, etc.3) The corer yielding the highest total amount (Bq m -2 ) in the whole sediment profile was chosen asthe reference corer- deviation may indicate scavenging, loss of enclosed material, etc.4) The corer with a total Cs-137 in the profile nearest to the median was chosen as the reference corer- in this context, the use of a median is not generally correct (see above)
5) The corer that was nearest to the FIN Niemistö Corer in total Cs-137 (Bq m -2 ) was chosen as thereference corer- before and during the MOSSIE exercise the Niemistö Corer was the corer most frequently used insediment sampling by the MORS Group. The FIN Niemistö was chosen as the reference, because thisparticular corer and the sampling technique used represented the original version of the device (cf.Niemistö, 1974).Tukey's Studentized Range (HSD) Test for Difference (SAS Institute Inc., 1989) was used for thewhole material, including the results from all the stations and corers. The test results show that if thelowest dry weight in the surface layer or the highest peak concentration of Cs-137 is used as thereference, none of the corers differs significantly from the others, i.e. in this respect the corers fall intothe same group (Tables I and II).If the highest total Cs-137 value per m 2 is used as the reference, the Large Box Corer differssignificantly from the Selena, STUK, Aquarius and Sprut corers (Table III). If the median of total Cs-137 values is used as the reference, the Large Box Corer differs significantly from the Aquarius, Sprutand Niemistö GER corers (Table IV). On the other hand, if the Niemistö FIN Corer is used as thereference, only the Limnos Corer differs significantly from the Large Box Corer (Table V). In general,however, the incoherence of the results hampered the use of Tukey's test for this material.Another simplified method for testing the differences between the corers was to calculate the relativedifferences from the reference corer:value - referencereferenceThe results of these tests are given in Figs 14-17. At station BY-15 the Large Box Corer waseliminated, because there were no useable Cs-137 results (all were "less than" values). Based on thisexamination a rough ranking list was drawn up for the corers used at the four sampling stations. Inaddition to criteria 1-5 given above, opposite "negative" items were included in the ranking categories:6) The corer with the highest dry weight (g cm -3 ) in the surface layer7) The corer with the lowest Cs-137 peak (Bq kg -1 dry wt.) in any of the surface layers8) The corer with the lowest total Cs-137 (Bq m -2 ) in the whole profile9) The corer with a total Cs-137 (Bq m -2 ) farthest from the median10) The corer with a total Cs-137 (Bq m -2 ) farthest from the FIN Niemistö Corer11) OutliersThe ranking list is given in Table VI. The Sprut Corers were considered as one type irrespective ofwhether they were used by Poland or Russia, because the corers were identical in every respect. TheNiemistö Corer used on the Aranda (A) was considered separately from that used on the Valdivia (G)due to the different diameter of the coring tubes. However, the Niemistö Corer used on board theAranda was considered as one type, whether it was used by Finland or by Sweden.In the first category, "lowest dry weight in the surface layer", the original Niemistö Corer used onboard the Aranda, the Niemistö G, Gemini and Sprut corers obtained most of the top ranks. In theopposite category, "highest dry weight in the surface layer" the Large Box Corer, the Small Box Corerand also the Sprut Corer gathered most of the negative top ranks.
In the second category, "highest Cs-137 peak", the Niemistö G, Sprut and Gemini corers obtainedmost of the top ranks, whereas the Large Box Corer and the Small Box Corer and again the SprutCorer gathered most of the negative top ranks in the opposite category, 7.In the third category, "highest total Cs-137 in the whole profile", the Sprut, Aquarius and Niemistö Gcorers obtained most of the top ranks, whereas the Large Box Corer, the Small Box Corer and theNiemistö A Corer obtained most of the negative top ranks in the opposite category, 8.In the fourth category, "total Cs-137 in the profile nearest to median", the Sprut, Gemini and Aquariuscorers obtained most of the top ranks. The Large Box Corer, the Small Box Corer and the Sprut Corerobtained most of the top ranks in the opposite category, 9, but the Sprut Corer and the Aquarius Coreralso gathered top ranks at two stations.In the fifth category, "nearest to FIN Niemistö Corer in total Cs-137", the Sprut Corer and the GeminiCorer obtained most of the top ranks. However, the Sprut Corer, together with the Large Box Corerand the Aquarius Corer, also gathered most of the top ranks in the opposite category, 10.In three cases the Large Box Corer was so far from the reference that it was categorised as an outlier.The Small Box Corer was considered an outlier in two cases.Impact of corer diameter or areaThe impact of corer diameter (or area) was considered using the Finnish data collected on board theAranda by six corers with different diameters (or areas). Only the Finnish data were used in this respect,because of the uniformity of the relevant results. In principle all the six corers were used in the sameway, and the results did not include any outliers.According to some publications (e.g. Baxter et al., 1981), it has been suggested earlier that smalldiametergravity coring or other techniques using heavy and high-velocity devices may induce extensiveloss of surface material and mixing of sediment layers. However, it seemed obvious that the majorproblem was due to the high velocity at which the corers enter the sediment, resulting in a "shock wave"effect (Evans&Lasenby, 1984). In our case, all six corers were lowered into the sediment at a very slowvelocity and the results show that the differences between the corers were not caused by scavenging ormixing, but seem to have been caused by a factor that we call "edge effect" (cf. p. 2).The consequences of the edge effect were clearly visible in the Finnish MOSSIE results (Ilus et al.,1994), which showed marked differences in the total amounts of Cs-137 per m 2 , even though the Cs-137concentrations per kg of dry weight were equal in parallel slices of the sediment profiles. The resultscalculated per m 2 were in direct correlation with the area of the corer, being lowest in the corers with thesmallest diameter (Fig. 18). The correlation between the total amount of Cs-137 per m 2 and the area ofthe corer was very significant, whereas no correlation was found between the Cs-137 value per kg of dryweight in the surface layer and the area of the corer (Fig. 19). The conclusion was that edge effectprobably occurs in any type of coring device (the inner walls of the coring tubes/barrels cause loss ofmaterial from the margins of the core). This loss is greater in corers with higher ratios between the innerperimeter and the sampled area (in corers with small diameters), and the error is multiplied when severalparallel samples are needed for analysis when small-diameter corers are used. In this calculation we usedthe maximum Cs-137 value per m 2 as the best estimate of the total amount of Cs-137 in sediments, andthe Cs-137 concentration in the sample with the lowest dry weight in the 0-5 cm layer as the bestestimate for the values per kg of dry wt.
CHARACTERISTICS OF THE SAMPLING DEVICES USED IN THE MOSSIE EXERCISEThe sediment samplers used in the MOSSIE exercise includes 5 box corers and 7 tubular gravity corers.The sources of error inherent in small-diameter corers are the main disadvantages of the Niemistö Corer.The consequences of the edge effect have been obvious in some intercomparisons, in which the resultsgiven per m 2 have been smaller than expected in samples taken by the Niemistö Corer (Aarkrog andDahlgaard, 1989; Klemola et al., 1991). Another disadvantage is its tendency to tilt on compact bottoms,because the corer is quite tall, and its centre of gravity is high up. This factor, together with the smalldiameter, may lead to the smearing effect. On the other hand, the soft watery surface layers are almostalways undisturbed in samples taken with the Niemistö Corer, and its slicing device is one of the mostsophisticated.The Gemini Twin Corer is an advanced version of the Niemistö Corer, featuring many improvements.The most significant advantage is the larger diameter of the coring tubes, which means a lower risk ofcore shortening, smearing and edge effect. In addition, the larger diameter and 2 parallel tubes mean thatthe number of parallel hauls can be reduced; normally one haul is sufficient to obtain an adequate samplefor radionuclide analysis. The parallel tubes and placing of the lead weights further down than in theNiemistö Corer increase the stability of the Gemini Corer and reduce the risk of tilting. An additionalimprovement is the locking of the upper lids and the closing rudders during descent, which increases thecorer's stability and the free flow of water through the sampling tubes. The slicing device is amodification of that in the original Niemistö Corer, and is also very neat and sophisticated.The STUK Corer is a very simple basic model of a tubular gravity corer. It is very safe to operate andregularly takes good-looking sediment samples with an undisturbed surface. However, core shorteningcaused by the relatively small diameter is one of the disadvantages recorded. Another weakness of theSTUK Corer is the risk of filling up to the brim on the very soft bottoms typical of the Baltic Sea,because the corer is relatively short compared with its weight. The sectioning equipment of the STUKCorer is also very simple and not as precise as that of the Niemistö Corer. The Selena Corer is a "bigbrother" of the STUK Corer. The construction of the corer itself is identical to that of the STUK Corer,but the size is bigger. The sectioning device is not similar, instead resembling that in the Gemini Corer.The bigger corer diameter and length should reduce the disadvantages listed above for the STUK Corer.The operational idea of the Limnos Sampler differs fundamentally from the other corers used in theMOSSIE exercise. In general the cores obtained with the Limnos sampler are undisturbed and thediameter is sufficient to minimise the disadvantages of all small-diameter corers, i.e. core shortening,smearing and edge effect. Furthermore, the cores are sliced without extrusion through the coring tube. Onthe other hand, the corer is very light and the construction is too weak for severe offshore conditions.Slicing may be difficult in rough weather or if the sediment is very watery and soft.The construction of the Sprut Corer is complicated, so it may sometimes be cumbersome and subject tooperational faults. However, the main weakness of the corer is the closing mechanism, which isconstructed of flexible, wedge-shaped brass plates. Especially if the type of sediment is very soft, theplates do not keep the watery sediment inside, or they let air bubbles through, and consequently the coreand the overlying water get mixed. This happened repeatedly on board the Aranda, but on the Valdiviathe sampling succeeded better. If the core obtained is short or very soft, it easily gets lost when the coreris passing through the water surface, especially when working on large research vessels with high rails.The corer might be more useful on harder clay bottoms.Use of the Large Box Corer and the Small Box Corer relies on additional on-board sampling withhand-operated coring tubes from the original box core. This method is a means of overcomingdisadvantages such as core shortening and smearing. The use of large box corers, however, ofteninvolves other inherent difficulties, such as tilting, brimming, ingress of sediments into the sample box
from the outside, redistribution, resuspension and loss of enclosed matter (Blomqvist, 1992). Large boxcorers are often cumbersome and require the use of large research vessels. In addition, their massiveconstruction, weight and less hydrodynamic design tend to disturb the soft surface layers of thesediment, even if flaps allow for water flow through the open box, as in these devices. A supportingstand or frame is used to reduce tilting and brimming. However, the Large Box Corer, specificallyproved to be too heavy for the soft bottoms of the Baltic Sea, and the soft surface layers were often lostdue to scavenging or brimming.A box corer is not the best sampling device available for very soft seabeds, although it has manyadvantages in sampling of hard clayey and sandy sediments. It is thus obvious that the same corer maynot be appropriate in all cases, and that different bottoms and circumstances require different devices. Onvery soft bottoms the main disadvantage of the box corer is its rather massive design, which causes lossof very soft surface sediments and makes of the corer sink too deeply into the sediment, resulting inbrimming of the coring barrel.The smaller Aquarius Box Corer is also equipped with a frame to avoid tilting and filling up to thebrim. In addition, it is lighter and handier than the large box corers and allows water flow through theopen box during descent and penetration into the sediment. Sample handling relies on an inner Plexiglasbox (aquarium) that can be removed from the corer, after which the entire core can be thinly sliced usinga sectioning device modified from that in the Niemistö Corer. Scavenging may be the main risk in use ofthe Aquarius Box Corer. However, very good samples were obtained in careful sampling with this corerduring the MOSSIE exercise. Before the corer was equipped with the frame, tilting often caused theappearance of a wedge-shaped gap in one edge of the core, but the frame reduced this disadvantage.CONCLUSIONSTo be able to study sedimentation and processes in sediments, it is essential to obtain reliable samples.False conclusions are an obvious risk if the studies are based on biased field samples, and it isunreasonable to perform exacting and expensive analyses if the samples themselves are unreliable or ofpoor quality. Sampling of soft, easily resuspended sediments, however, is difficult and involves manysources of error. In many cases the surface of the sediment is like a "line drawn in water", because theuppermost sediment layers usually consist of very light, mobile particles. Thus, sampling of sediments isone of the most demanding tasks in marine research. Different sources of error are associated withdifferent sampling equipment, and probably there is no single corer which is ideal for all kinds ofsediments.Despite the large variety of sampling instruments and the many sources of error involved in the use ofdifferent instruments, it is vital to know and account for the disadvantages and to work as reliably andcarefully as possible to minimise errors and obtain undisturbed and reliable samples.The instruments best suited to quantitative sampling of soft-bottom sediments appear to be those basedon the coring principle. Box corers can be reliably used mainly for bulk sampling of coherent sedimentsand some silty and sandy sediments. Nevertheless, it should be borne in mind that the same instrumentmay not be the best alternative for all types of bottom, and different circumstances require different typesof instrumentation.
The aim of each given study should determine what kind of sampling equipment should be used. If theaim is to study the distribution of recently settled radionuclides in the uppermost layers of sediment, forinstance, the criterion should be the most exact slicing system, even if the diameter of the corer is small.When monitoring total amounts of radionuclides in sediments, the best choice might be a corer with alarge sampling area. The most important criterion should be, however, that the corer used is able to takeundisturbed samples of good quality (unmixed surface layer, clear water layer above it, etc.).Many factors speak in favour of corer orifices with relatively large diameters/areas. It is not possible,however, to increase the tube diameter endlessly without having a negative impact on the corer’shandiness and making it more difficult to handle and slice the cores.In this study the main emphasis was placed on comparing the sampling devices in order to find the bestavailable instrumentation for Baltic Sea sediments. Intercomparison of analysis methods and results hasshown good comparability between the participating laboratories (Ballestra et al., 1994).Typical sources of error involved in sampling with the corers tested were as follows:• Aquarius: potential risk of scavenging or tilting. Slicing, not as precise as in tube corers with asmaller diameter.• Gemini: low risk of smearing, tilting or core shortening. In general this corer yields undisturbed,good-looking samples.• Large Box Corer: significant risk of scavenging and filling up to the brim on the very soft bottomsof the Baltic Sea. Probably more useful on harder clay and silt bottoms.• Limnos: the corer may be too light and its construction too weak for severe offshore conditions.Slicing may be difficult in rough weather or if the sediment is very watery and soft.• Niemistö: the sources of error inherent in small-diameter corers (smearing, core shortening, edgeeffect) and the risk of tilting are the main disadvantages. On the other hand, the slicing device is oneof the most sophisticated. The problems associated with small-diameter corers are probably slightlyless great in the German Niemistö Corer, because its diameter is somewhat larger.• Selena: potential risk of core shortening and low risk of filling up to the brim on very soft bottoms.• Small Box Corer: obvious risk of scavenging and filling up to the brim on the very soft bottoms ofthe Baltic Sea. Probably more useful on harder clay and silt bottoms.• Sprut: the main weakness is the closing mechanism of the corer, which may cause "bubbling" andmixing of the core.• STUK: potential risk of brimming on very soft bottoms and core shortening are the maindisadvantages recorded. In general this corer yields undisturbed, good-looking samples. Slicing is notas precise as in many other tube corers.In general, the results obtained with the ten sediment corers were so variable and inconsistent, and the theincoherence and deviations in the study material were so large that statistical analysis of the data provedto be difficult or even impossible. Five criteria were used to examine the results. The relative differencebetween the chosen reference corer and the other corers were determined at each sampling station basedon these criteria. As a summary, a ranking list was drawn up to indicate the usability of the differentsampling devices at the 4 sampling stations.1) When the corer yielding the lowest dry weight for the surface layer was chosen as the reference corer,the average relative differences calculated for the ten corers were in the order: STUK < Niemistö G
3) When the corer yielding the highest total amount of Cs-137 in the whole sediment profile was chosenas the reference corer, the order of the average relative differences calculated for each corer was asfollows: Selena < STUK < Aquarius < Niemistö G < Sprut < Limnos < Gemini < Niemistö A
REFERENCESAarkrog A. and Dahlgaard H., 1989. <strong>No</strong>rdic intercalibration of sediment sampling and analysis 1979.Manuscript translated to English; ø National Laboratory, Denmark.Ballestra S., Gastaud J., Lopez J.J., Parsi P, and Vas D., 1994. Intercomparison of radionuclidemeasurements in Baltic Sea sediments IAEA-300, IAEA-378 and IAEA-379. IAEA/AL/066.International Atomic Energy Agency, Marine Environment Laboratory, Monaco.Ballestra S, Herrmann J and Ikäheimonen T.K., 1995. Quality of data. In: Radioactivity in the Baltic Sea1984-1991. Baltic Sea Environment Proceedings 61: 30-58. Helsinki Commission, HelsinkiBaxter M.S., Farmer J.G., McKinley I.G., Swan D.S. and Jack W., 1981. Evidence of the unsuitability ofgravity coring for collecting sediment in pollution and sedimentation rate studies. Environmental Science& Technology 15: 843-846.Blomqvist S., 1985. Reliability of core sampling of soft bottom sediment - an in situ study.Sedimentology (1985) 32, 605-612.Blomqvist S., 1992. Geochemistry of coastal Baltic sediments: Processes and sampling procedures.Meddelanden från Stockholms universitets institution för geologi och geokemi. N:r 285, Stockholm.Evans H.E. & Lasenby D.C., 1984. A comparison of lead and zinc sediment profiles from cores taken bydiver and a gravity corer. Hydrobiologia 108, 165-169.Ilus E., 1996. Evaluation of sediment sampling devices and methods used in the NKS/EKO-1 Project.Technical Report of <strong>No</strong>rdic Nuclear Safety Research NKS/EKO-1(96)TR-1, Risö, Denmark.Ilus E. (ed.), 1998. Dating of sediments and determination of sedimentation rate. Proceedings of aseminar held in Helsinki 2-3 April 1997. Report STUK-A145, 149 pp., Radiation and Nuclear SafetyAuthority, Helsinki.Ilus E., Mattila J., Klemola S., Ikäheimonen T. and Niemistö L., 2000. Sedimentation rate in the BalticSea. Technical Report of <strong>No</strong>rdic Nuclear Safety Research NKS/EKO-1(2000)TR-x, Risö, Denmark. (inpress).Ilus E., Niemistö L. and Bojanowski R., 1995. Radionuclides in sediment and suspended particulatematter. In: Radioactivity in the Baltic Sea 1984-1991. Baltic Sea Environment Proceedings 61: 69-92.Helsinki Commission.Ilus E., Niemistö L. and Ikäheimonen T.K., 1994. The Finnish MOSSIE results. HELCOM/MORSSeminar "Internal and external quality assurance, and the preliminary review of the MOSSIE data" heldin Helsinki, 30 May 1994, Finnish Centre for Radiation and Nuclear Safety.Jahnke R.A. and Knight L.H., 1997. A gravity-driven, hydraulically-damped multiple piston corer forsampling fine-grained sediments. Deep-Sea Research I, 44, 713-718.Klemola S., Ilus E, Sjöblom K-L., Arvela H. and Blomqvist L., 1991. Monitoring of radionuclides in theenvirons of the Finnish nuclear power stations in 1988. Appendix: Intercomparison of sedimentsamplers. Report STUK-A92: 62-68, Finnish Centre for Radiation and Nuclear Safety, Helsinki.Morton R.A. and White W.A., 1997. Characteristics of and corrections for core shortening inunconsolidated sediments. Journal of Coastal research, 13(3), 761-769, Fort Lauderdale (Florida).
Nevissi A.E., Shott G.J. & Crecelius E.A., 1989. Comparison of two gravity coring devices forsedimentation rate measurement by 210 Pb dating techniques. Hydrobiologia 179: 261-269.Nies H., Albrecht H., Rechenberg V., Goroncy I., Dahlgaard H., Weiss D., Brügmann L., 1990.Intercomparison of sediment sampling techniques by means of radionuclide and heavy metal analyses.Dt. hydrogr. Z. 43, 27-53, Hamburg.Niemistö L., 1974. A gravity corer for studies of soft sediments. Merentutkimuslait.Julk./Havsforskningsinst.Skr. 238: 33-38, Helsinki.Povinec P., Fowler S. and Baxter M., 1996. Chernobyl & the marine environment: The radiologicalimpact in context, IAEA Bulletin, 38,1: 18-22, International Atomic Energy Agency, Vienna.SAS Institute Inc., 1989. SAS/STAT* User's Guide, Version 6 Fourth Edition, Volume 2, Cary, NC:SAS Institute Inc., 1989, 846 pp.Winterhalter B., 1998. The Gemax Corer for soft sediments. 9 pp. Geological Survey of Finland, Espoo.
Figures6-19
Fig. 6. Vertical profiles of G-137 obtained with different corers at station BY-15.31
Fig. 7. Vertical profiles of Cs-134 obtained with different corers at station BY-15.
Fig. 8. Vertical profiles of G-137 obtained with different corers at station Teili-1.33
Fig. 9. Vertical profiles of G-134 obtained with different corers at station Teili-1.34
Fig. 10. Vertical profiles of G-137 obtained with different corers at station XV-l.35
Fig. 11. Vertical profiles of Cs-134 obtained with different corers at station XV-l.36
Fig. 12. Vertical profiles of G-137 obtained with different corers at station EB-1.37
Fig. 13. Vertical profiles of Cs-134 obtained with different corers at station EB-1.38
Dry w.H. conMaxMedNieGER Small boxRUS Sprut IIPOL SprutRUS Sprut IFIN NiemistöGER NiemistöGER NiemistöFIN Aquarius IFIN GeminiRUS Sprut IFIN NiemistöRUS Sprut IISWE NiemistöFIN Aquarius IIPOL SprutGER Small boxFIN Aquarius IIGER NiemistöRUS Sprut IIFIN Aquarius IFIN GeminiRUS Sprut IFIN NiemistöPOL SprutSWE NiemistöGER Small boxFIN Aquarius IFIN GeminiRUS Sprut IFIN NiemistöPOL SprutSWE NiemistöGER Small boxFIN Aquarius IIGER NiemistöRUS Sprut IIFIN Aquarius IFIN GeminiRUS Sprut IFIN NiemistöPOL SprutSWE NiemistöGER Small boxDiff.5.131.150.790.650.640.540.540.270.160.000.00-0.03-0.08-0.13-0.23-0.34-0.36-0.37-0.46-0.930.00-0.03-0.03-012-0.18-0.21-0.31-0.32-0.53-0.840.240.210.210.090.02-0.02-015-0.15-0.42-0.810.450.420.410.2<strong>80</strong>.200.140.00-0.01-0.32-1 0 1 2 3 4 5 6Fig. 14. Relative differences between other corers and the reference corer at station BY-15.39
Dry w.H. conMaxMedNieDiff.0.630.560.500.460.400.390.360.360.300.240.220.210.000.00-0.27-0.28-0.30-0.32-0.34-0.39-0.45-0.48-0.50-0.50-0.85-0.890.00-0.21-0.28-0.48-0.50-0.53-0.56-0.51-0.64-0.64-0.65-0.91-0.921.2<strong>80</strong>.660.630.170.140.060.00-0.03-0.19-0.19-0.21-0.<strong>80</strong>-0.821.811. 041.010.450.400.310.230.200.000.00-0.02-0.75-0.78Fig. 15. Relative differences between other corers and the reference corer at station Teili-1.40
Dry w.H. conMaxMedNieDiff.1.120.920.850.830.<strong>80</strong>0.610.600.5<strong>80</strong>.570.560.500.400.130.000.00-0.02-0.07-0.21-0.34-0.37-0.42-0.49-0.51-0.54-0.55-0.61-0.63-0.9<strong>80</strong>.00-0.06-0.16-0.21-0.25-0.29-0.32-0.34-0.34-0.42-0.42-0.59-0.69-0.930.510.420.260.190.140.0<strong>80</strong>.020.00-0.00-0.12-0.13-0.38-0.53-0.891.451.311.050.940.850.750.660.630.620.430.420.00-0.24-0.82Fig. 16. Relative differences between other corers and the reference corer at station XV-1.41
Dry w.H. conMoxMedNieFIN SelenoFIN SelenaPOL Sprut IIRUS Sprut IIFIN AquarlusGER NiemistöFIN SelenaRUS Sprut. ISWE NiemistöFIN STUKFIN NiemistöPPGRUS Sprut IIFIN AquariusGER NiemistöFIN SelenaDiff.0.4570.3160.2790.2520.2400.1830.1140.1070.1000.0720.0140.0000.000-0.029-0.056-0.094-0.097-0.113-0.143-0.186-0.200-0.200-0.200-0.3030.000-0.023-0142-0.159-0.175-0.181-0.193-0.313-0.384-0.396-0.492-0.5330.23<strong>80</strong>.2100.0630.0410.0220.0140.000-0.149-0.237-0.252-0.371-0.4220.4550.4220.24<strong>80</strong>.2230.2000.1920.1750.000-0.104-0.121-0.261Fig. 17. Relative differences between other corers and the reference corer at station EB-1.42
Std Cs= Max.Cs – Corer spesific Cs per Max.CsF–test=35.10 p= 0.0001 (***)Std Cs0.15 0.20 0.251 / area of corerFig. 18. Correlation between the total amount of Cs- 137 per m 2 and the area (diameter) of the corer.
Std Cs= Cs in min.dens. – Corer spes. Cs per Cs in min.dens.F-test=2.20 p=0.157 (-)Std Cs0.15*0.10 *0.05 **0.00 * *-0.05***-0.10:-0.15 **-0.20 *-0.25-0.30*-0.35*-0.40 *0.05 0.10 0.15 0.20 0.25Fig. 19. Correlation between the G-137 cocentration in surface layer (0-5 cm) and the area (diameter) of corer.
TablesI-VI
Table I. Results of Tukey’s test, reference "lowest dry weight in surface layer".Reference: Surface layer (0-2 cm) with lowest dry weightGeneral Linear Models ProcedureTukey’s Studentized Range (HSD) Test for variable: STDdenNOTE: This test controls the type I experimentwise error rate, but generally has a higher type II errorrate than REGWQ.Alpha= 0.05 df= 41 MSE= 0.520375Critical Value of Studentized Range= 4.728Minimum Significant Difference= 2.1049WARNING: Cell sizes are not equal.Harmonic Mean of cell sizes= 2.625547Means with the same letter are not significantly different.Tukey Grouping Mean N CorerA 1.3108 5 SMALL BOXAA 0.6418 3 LARGE BOXAA 0.5564 14 SPRUTAA 0.4677 7 AQUARIUSAA 0.4573 1 SELENAAA 0.3720 4 GEMINIAA 0.3139 2 LIMNOSAA 0.2853 5 NIEMISTÖ GAA 0.2412 9 NIEMISTÖ AAA 0.1069 1 STUK
Table II. Results of Tukey’s test, reference "highest peak concentration of Cs-137".Reference: Highest (peak) concentration of Cs-137General Linear Models ProcedureTukey’s Studentized Range (HSD) Test for variable: STDCs-137NOTE: This test controls the type I experimentwise error rate, but generally has a higher type II errorrate than REGWQ.Alpha= 0.05 df= 41 MSE= 0.059457Critical Value of Studentized Range= 4.728Minimum Significant Difference= 0.7115WARNING: Cell sizes are not equal.Harmonic Mean of cell sizes= 2.625547Means with the same letter are not significantly different.Tukey Grouping Mean N CorerA -0.1429 1 STUKAA -0.1702 2 LIMNOSAA -0.2000 1 SELENAAA -0.2221 14 SPRUTAA -0.3291 5 NIEMISTÖ GAA -0.3307 9 NIEMISTÖ AAA -0.3337 4 GEMINIAA -0.3736 7 AQUARIUSAA -0.5105 5 SMALL BOXAA -0.6579 3 LARGE BOX
Table III. Results of Tukey’s test, reference "highest total Cs-137 value in the whole profile".Reference: Highest total Cs-137 values per m 2General Linear Models ProcedureTukey’s Studentized Range (HSD) Test for variable: STDtotCsNOTE: This test controls the type I experimentwise error rate, but generally has a higher type II errorrate than REGWQ.Alpha= 0.05 df= 41 MSE= 0.036823Critical Value of Studentized Range= 4.728Minimum Significant Difference= 0.5599WARNING: Cell sizes are not equal.Harmonic Mean of cell sizes= 2.625547Means with the same letter are not significantly different.Tukey Grouping Mean N CorerA -0.1595 1 SELENAAA -0.1925 1 STUKAA -0.1991 7 AQUARIUSAA -0.2267 14 SPRUTAB A -0.2404 5 NIEMISTÖ GB AB A -0.3377 2 LIMNOSB AB A -0.4247 4 GEMINIB AB A -0.5062 9 NIEMISTÖ AB AB A -0.6348 5 SMALL BOXBB -0.7938 3 LARGE BOX
Table IV. Results of Tukey’s test, reference "median of total Cs-137 value".Reference: Median of total Cs-137 valuesGeneral Linear Models ProcedureTukey’s Studentized Range (HSD) Test for variable: STDtotCsNOTE: This test controls the type I experimentwise error rate, but generally has a higher type II errorrate than REGWQ.Alpha= 0.05 df= 41 MSE= 0.085126Critical Value of Studentized Range= 4.728Minimum Significant Difference= 0.8513WARNING: Cell sizes are not equal.Harmonic Mean of cell sizes= 2.625547Means with the same letter are not significantly different.Tukey Grouping Mean N CorerA 0.2102 7 AQUARIUSAA 0.1<strong>80</strong>1 14 SPRUTAA 0.1576 5 NIEMISTÖ GAB A 0.0409 1 SELENAB AB A 0.0000 1 STUKB AB A -0.0010 2 LIMNOSB AB A -0.0152 4 GEMINIB AB A -0.2441 9 NIEMISTÖ AB AB A -0.4923 5 SMALL BOXBB -0.7112 3 LARGE BOX
Table V. Results of Tukey's test, reference "nearest to the FIN Niemistö Corer in total Cs-137".Reference: Niemistö CorerGeneral Linear Models ProcedureTukey’s Studentized Range (HSD) Test for variable: STDtotCsNOTE: This test controls the type I experimentwise error rate, but generally has a higher type II errorrate than REGWQ.Alpha= 0.05 df= 41 MSE= 0.185159Critical Value of Studentized Range= 4.728Minimum Significant Difference= 1.2556WARNING: Cell sizes are not equal.Harmonic Mean of cell sizes= 2.625547Means with the same letter are not significantly different.Tukey Grouping Mean N CorerA 0.6244 2 LIMNOSAB A 0.6078 7 AQUARIUSB AB A 0.5598 14 SPRUTB AB A 0.5477 5 NIEMISTÖ GB AB A 0.2843 4 GEMINIB AB A 0.2228 1 SELENAB AB A 0.1747 1 STUKB AB A -0.0429 9 NIEMISTÖ AB AB A -0.3092 5 SMALL BOXBB -0.6404 3 LARGE BOX
Table VI. Ranking list of different corers at different stations compiled on the basis of the 11 categories (see the text).Station 1 2 3 4 5 6 7 8 9 10 11BY-15 Nie G Nie G Aqu Sprut Sprut L box L box L box L box L box L boxGem Aqu Nie G Gem Gem S box S box S box S box S box S boxNie A Gem Sprut Aqu Aqu Sprut Sprut Nie A Nie A AquEB-1 Nie A Sprut Sprut STUK Sprut Sele S box S box S box Sprut -Sprut Nie G Aqu Nie A STUK Sprut Sprut L box L box S box -Nie G Nie A Nie G Sprut Sele - - Sprut Sprut Aqu -Teili-1 Nie A Sprut Sprut Sprut Gem Gem L box L box Sprut Sprut L boxNie G Nie G Nie G Gem Sprut L box S box S box L box Nie G S boxSprut Gem - Aqu Aqu Aqu Aqu Nie A S box L boxXV-1 Nie A Limn Sprut Limn Gem L box L box L box L box Sprut L boxLimn Sprut Aqu S box Sprut Sprut Nie G Nie A Nie A AquGem - - Nie G Limn - Gem Nie G Sprut L box
APPENDIXAnalytical data
Sampling station: BY-15Sampler: Aquarius Corer FIN (I) Number of cores: 1 Area: 333.1 cm 2 (182x183 mm)Depth Dry wt. K-40 Cs-134 Cs-137 Pu-238 Pu-239 Pu-238/Pu-239(cm) (g) Bq/kg dry wt.0-2 35.0 500 10 200 - - -2-4 52.0 450 0 83 - - -4-6 72.0 750 0 37 - - -6-8 128.0 7<strong>80</strong> 0 16 - - -8-10 144.0 <strong>80</strong>0 0 8.6 - - -10-15 373.0 890 0 3.5 - - -15-20 416.0 930 0 0 - - -Sampler: Aquarius Corer FIN (II) Number of cores: 1 Area: 333.1 cm 2 (182x183 mm )Depth Dry wt. K-40 Cs-134 Cs-137 Pu-238 Pu-239 Pu-238/Pu-239(cm) (g) Bq/kg dry wt.0-5 88.0 530 0 130 - - -5-10 242.0 770 0 29 - - -10-15 373.0 8<strong>80</strong> 0 7.1 - - -15-20 419.0 1000 0 0 - - -Sampler: Large Box Corer D Number of cores: 2 Area: 138.8 cm 2 (Ø 94 mm ), total 500x500Depth Dry wt. K-40 Cs-134 Cs-137 Pu-238 Pu-239 Pu-238/Pu-239(cm) (g) Bq/kg dry wt.0-2 68.2 910 < 4.3 < 2.0 - - -2-4 78.9 930 < 4.1 < 1.7 - - -4-6 75.9 890 < 4.1 < 1.8 - - -6-8 86.2 820 < 3.7 < 1.6 - - -8-10 86.5 <strong>80</strong>0 < 3.3 < 1.5 - - -10-12 81.2 860 < 2.2 < 1.0 - - -12-14 77.9 7<strong>80</strong> < 2.4 < 1.0 - - -14-16 83.1 720 < 2.6 < 1.2 - - -16-18 70.0 860 < 2.4 < 1.0 - - -18-20 89.4 770 < 1.9 < 1.1 - - -_________________0 = below detection limit- = not analysed
Sampler: Small Box Corer DNumber of cores: 2 Area: 138.8 cm 2 (Ø 94 mm ), total 150x150Depth Dry wt. K-40 Cs-134 Cs-137 Pu-238 Pu-239 Pu-238/Pu-239(cm) (g) Bq/kg dry wt.0-2 58.2 760
Sampler: Niemistö Corer FIN Number of cores: 5 Area: 98.2 cm 2 (Ø 50 mm )Depth Dry wt. K-40 Cs-134 Cs-137 Pu-238 Pu-239 Pu-238/Pu-239(cm) (g) Bq/kg dry wt.0-2 11.0 500 12 160 - - -2-4 18.0 5<strong>80</strong> 0 68 - - -4-6 26.0 6<strong>80</strong> 0 24 - - -6-8 39.0 760 0 10 - - -8-10 43.0 820 0 6.6 - - -10-15 112.0 950 0 0 - - -15-20 119.0 860 0 0 - - -Sampler: Niemistö Corer S Number of cores: 5 Area: 98.2 cm 2 (Ø 50 mm )Depth Dry wt. K-40 Cs-134 Cs-137 Pu-238 Pu-239 Pu-238/Pu-239(cm) (g) Bq/kg dry wt.0-2 8.5 670 10 133 - - -2-4 19.3 7<strong>80</strong> 6.0 40 - - -4-6 31.7 850 0 16 - - -6-8 36.4 560 0 9.7 - - -8-10 41.7 970 0 3.8 - - -Sampler: Niemistö Corer D Number of cores: 3 Area: 68.7 cm 2 (Ø 54 mm )Depth Dry wt. K-40 Cs-134 Cs-137 Pu-238 Pu-239 Pu-238/Pu-239(cm) (g) Bq/kg dry wt.0-2 4.7 650 < 13 207 - - -2-4 9.9 550 < 7.8 102 - - -4-6 16.4 640 < 5.9 49 - - -6-8 28.4 <strong>80</strong>0 < 4.7 19 - - -8-10 31.4 950 < 5.0 11 - - -10-12 32.6 990 < 4.7 7.2 - - -12-14 35.2 1020 < 4.9 3.5 - - -14-16 34.3 1050 < 3.0 2.2 - - -16-18 36.8 1030 < 3.0 1.6 - - -18-20 39.1 1020 < 2.8 1.5 - - -_________________0 = below detection limit- = not analysed
Sampler: Sprut Corer RUS (I) Number of cores: 1 Area: 58.1 cm 2 (Ø 86 mm )Depth Dry wt. K-40 Cs-134 Cs-137 Pu-238 Pu-239 Pu-238/Pu-239(cm) (g) Bq/kg dry wt.0-2 6.6
Sampling station: Teili-1Sampler: Aquarius Corer FIN (I) Number of cores: 1 Area: 333.1 cm 2 (182x183 mm )Depth Dry wt. K-40 Cs-134 Cs-137 Pu-238 Pu-239 Pu-238/Pu-239(cm) (g) Bq/kg dry wt.0-5 229.0 790 16 270 - - -5-10 205.0 <strong>80</strong>0 0 75 - - -10-15 412.0 900 0 12 - - -Sampler: Aquarius Corer FIN (II) Number of cores: 1 Area: 333.1 cm 2 (182x183 mm )Depth Dry wt. K-40 Cs-134 Cs-137 Pu-238 Pu-239 Pu-238/Pu-239(cm) (g) Bq/kg dry wt.0-5 214.0 750 19 270 - - -5-10 223.0 900 1.4 95 - - -10-15 419.0 1000 0 14 - - -Sampler: Large Box Corer D Number of cores: 2 Area: 138.8 cm 2 (94 mm ), total 500x500Depth Dry wt. K-40 Cs-134 Cs-137 Pu-238 Pu-239 Pu-238/Pu-239(cm) (g) Bq/kg dry wt.0-2 39.8 840
Sampler: Small Box Corer D Number of cores: 2 Area: 138.8 cm 2 (Ø 94 mm ), total 150x150Depth Dry wt. K-40 Cs-134 Cs-137 Pu-238 Pu-239 Pu-238/Pu-239(cm) (g) Bq/kg dry wt.0-2 37.0 730
Sampler: Sprut Corer RUS Number of cores: 1 Area: 58.1 cm 2 (Ø 86 mm )Depth Dry wt. K-40 Cs-134 Cs-137 Pu-238 Pu-239 Pu-238/Pu-239(cm) (g) Bq/kg dry wt.0-2 14.5
Sampler: Niemistö Corer D Number of cores: 4 Area: 91.6 cm 2 (Ø 54 mm )Depth Dry wt. K-40 Cs-134 Cs-137 Pu-238 Pu-239 Pu-238/Pu-239(cm) (g) Bq/kg dry wt.0-2 20.6 790 23 393 - - -2-4 26.9 760 22 373 - - -4-6 25.0 670 11 198 - - -6-8 25.3 820
Sampler: Niemistö Corer S Number of cores: 5 Area: 98.2 cm 2 (Ø 50 mm )Depth Dry wt. K-40 Cs-134 Cs-137 Pu-238 Pu-239 Pu-238/Pu-239(cm) (g) Bq/kg dry wt.0-2 21.7 870 43 373 - - -2-4 24.8 840 12 195 - - -4-6 27.6 770 3.0 63 - - -6-8 42.5 <strong>80</strong>0 2.2 24 - - -8-10 58.8 1110 0 6.2 - - -10-15 171.9 790 0 3.4 - - -15-20 173.6 830 0 1.2 - - -_________________0 = below detection limit- = not analysed
Sampling station: XV-1Sampler: Aquarius Corer FIN (I) Number of cores: 1 Area: 333.1 cm 2 (182x183 mm )Depth Dry wt. K-40 Cs-134 Cs-137 Pu-238 Pu-239 Pu-238/Pu-239(cm) (g) Bq/kg dry wt.0-5 207.0 850 210 2400 - - -5-10 252.0 860 120 1400 - - -10-15 250.0 790 9.5 190 - - -15-20 282.0 790 6.8 110 - - -Sampler: Aquarius Corer FIN (II) Number of cores: 1 Area: 333.1 cm 2 (182x183 mm )Depth Dry wt. K-40 Cs-134 Cs-137 Pu-238 Pu-239 Pu-238/Pu-239(cm) (g) Bq/kg dry wt.0-5 210.0 <strong>80</strong>0 170 2100 - - -5-10 251.0 850 200 2300 - - -10-15 228.0 840 14 270 - - -15-20 173.0 840 5.5 150 - - -Sampler: Large Box Corer D Number of cores: 2 Area: 138.8 cm 2 (Ø 94 mm ), total 500x500Depth Dry wt. K-40 Cs-134 Cs-137 Pu-238 Pu-239 Pu-238/Pu-239(cm) (g) Bq/kg dry wt.0-2 46.2 910
Sampler: Small Box Corer D Number of cores: 2 Area: 138.8 cm 2 (Ø 94 mm ), total 150x150Depth Dry wt. K-40 Cs-134 Cs-137 Pu-238 Pu-239 Pu-238/Pu-239(cm) (g) Bq/kg dry wt.0-2 34.9 920 182 2501 - - -2-4 41.0 910 158 2164 - - -4-6 35.7 870 215 2953 - - -6-8 42.8 920 25 432 - - -8-10 41.8 920 7.5 213 - - -10-12 43.4 920 5.5 163 - - -12-14 44.2 940 4.0 159 - - -14-16 48.0 940 4.6 164 - - -Sampler: Limnos Corer FIN (I) Number of cores: 2 Area: 135.9 cm 2 (Ø 93 mm )Depth Dry wt. K-40 Cs-134 Cs-137 Pu-238 Pu-239 Pu-238/Pu-239(cm) (g) Bq/kg dry wt.0-1 12.0 650 98 1100 0.02 2.0 01-2 18.0 770 130 1500 0.18 2.6 0.0692-3 16.0 660 130 1600 0.13 2.7 0.0483-4 22.0 830 170 2100 0.14 3.1 0.0454-5 20.0 810 190 2300 0.090 3.1 0.0295-6 19.0 840 400 4700 0.29 3.9 0.0746-7 21.0 7<strong>80</strong> 130 1600 0.12 3.5 0.0347-8 22.0 860 26 390 0.14 4.0 0.0358-9 23.0 810 17 290 0.20 4.1 0.0489-10 23.0 790 12 230 0.090 3.8 0.02310-15 108.0 910 5.0 140 0 0 0Sampler: Limnos Corer FIN (II) Number of cores: 1 Area: 67.9 cm 2 (Ø 93 mm )Depth Dry wt. K-40 Cs-134 Cs-137 Pu-238 Pu-239 Pu-238/Pu-239(cm) (g) Bq/kg dry wt.0-2 16.0 740 140 1600 0.13 2.8 0.0462-4 20.0 7<strong>80</strong> 270 3100 0.090 3.0 0.0304-6 21.0 <strong>80</strong>0 190 2300 0.16 3.6 0.0446-8 23.0 740 17 2<strong>80</strong> 0.12 3.8 0.0318-10 21.0 770 5.4 160 0.13 4.2 0.03010-15 57.0 830 3.0 120 - - -15-20 63.0 790 2.3 96 - - -_________________0 = below detection limit- = not analysed
Sampler: Sprut Corer POL (I) Number of cores: 2 Area: 116.2 cm 2 (Ø 86 mm )Depth Dry wt. K-40 Cs-134 Cs-137 Pu-238 Pu-239 Pu-238/Pu-239(cm) (g) Bq/kg dry wt.0-2 34.9 890 187 2126 - 2.8 -2-4 46.6 940 395 4385 - 3.1 -4-6 43.9 8<strong>80</strong> 41 599 - 4.1 -6-8 36.1 960 9.0 195 - 5.0 -8-10 41.2 870 3.0 122 - 5.5 -10-12 45.4 860 1.0 98 - 6.0 -12-14 46.1 850 2.0 102 - 6.3 -14-16 48.3 890 2.0 99 - 6.5 -16-18 64.7 910 0.90 96 - 7.3 -18-20 57.2 900 0 91 - 7.9 -Sampler: Sprut Corer POL (II) Number of cores: 2 Area: 116.2 cm 2 (Ø 86 mm )Depth Dry wt. K-40 Cs-134 Cs-137 Pu-238 Pu-239 Pu-238/Pu-239(cm) (g) Bq/kg dry wt.0-3 49.9 1120 188 2539 - - -3-6 60.1 1310 286 3693 - - -6-9 64.3 1130 9.1 276 - - -9-12 67.1 1100 1.8 160 - - -12-15 79.1 11<strong>80</strong> 1.3 139 - - -15-18 87.0 1140 0 129 - - -18-21 98.0 1160 0 100 - - -Sampler: Sprut Corer RUS (I) Number of cores: 1 Area: 58.1 cm 2 (Ø 86 mmDepth Dry wt. K-40 Cs-134 Cs-137 Pu-238 Pu-239 Pu-238/Pu-239(cm) (g) Bq/kg dry wt.0-2 16.4
Sampler: Sprut Corer RUS (II) Number of cores: 1 Area: 58.1 cm 2 (Ø 86 mm )Depth Dry wt. K-40 Cs-134 Cs-137 Pu-238 Pu-239 Pu-238/Pu-239(cm) (g) Bq/kg dry wt.0-2 16.8
Sampler: Niemistö Corer FIN Number of cores: 5 Area: 98.2 cm 2 (Ø 50 mm )Depth Dry wt. K-40 Cs-134 Cs-137 Pu-238 Pu-239 Pu-238/Pu-239(cm) (g) Bq/kg dry wt.0-2 24.0 <strong>80</strong>0 170 2100 - - -2-4 28.0 810 120 1500 - - -4-6 29.0 870 89 1100 - - -6-8 30.0 840 6.5 1<strong>80</strong> - - -8-10 32.0 810 0 110 - - -10-15 79.0 850 0 98 - - -15-20 94.0 - - - - - -Sampler: Niemistö Corer S Number of cores: 5 Area: 98.2 cm 2 (Ø 50 mm )Depth Dry wt. K-40 Cs-134 Cs-137 Pu-238 Pu-239 Pu-238/Pu-239(cm) (g) Bq/kg dry wt.0-2 15.4 950 255 2711 - - -2-4 20.3 700 107 1439 - - -4-6 20.2 900 38 476 - - -6-8 20.3 700 9.0 156 - - -8-10 24.8 9<strong>80</strong> 13 123 - - -10-15 85.1 700 4.0 117 - - -15-20 95.8 740 5.0 109 - - -_________________0 = below detection limit- = not analysed
Sampling station : EB-1Sampler: Aquarius Corer FIN Number of cores: 1 Area: 333.1 cm 2 (182x183 mm )Depth Dry wt. K-40 Cs-134 Cs-137 Pu-238 Pu-239 Pu-238/Pu-239(cm) (g) Bq/kg dry wt.0-5 360.0 8<strong>80</strong> 110 1300 - - -5-10 532.0 1000 110 1400 - - -10-15 415.0 1000 57 740 - - -Sampler: Small Box Corer D Number of cores: 2 Area: 138.8 cm 2 (Ø 94 mm ), total 150x150Depth Dry wt. K-40 Cs-134 Cs-137 Pu-238 Pu-239 Pu-238/Pu-239(cm) (g) Bq/kg dry wt.Analysed by BSH (D)0-2 64.5 990 120 1585 0.20 3.3 0.0602-4 78.7 950 113 1483 0.12 3.6 0.0334-6 92.2 1010 51 737 0.25 4.4 0.0566-8 93.9 1030 7.7 176 0.14 4.6 0.0308-10 98.1 1030
Sampler: Selena Corer FIN Number of cores: 2 Area: 157.1 cm 2 (Ø 100 mm )Depth Dry wt. K-40 Cs-134 Cs-137 Pu-238 Pu-239 Pu-238/Pu-239(cm) (g) Bq/kg dry wt.0-2 90.0 960 120 1400 - - -2-4 99.0 8<strong>80</strong> 110 1300 - - -4-6 108.0 970 97 1200 - - -6-8 112.0 990 60 <strong>80</strong>0 - - -8-10 122.0 790 49 630 - - -10-15 290.0 970 0 150 - - -15-20 305.0 1000 0 73 - - -Sampler: Sprut Corer POL (I) Number of cores: 2 Area: 116.2 cm 2 (Ø 86 mm )Depth Dry wt. K-40 Cs-134 Cs-137 Pu-238 Pu-239 Pu-238/Pu-239(cm) (g) Bq/kg dry wt.0-2 60.1 10<strong>80</strong> 114 1425 - 2.6 -2-4 77.6 1020 124 1392 - 2.9 -4-6 81.3 1070 94 1157 - 3.0 -6-8 97.8 1150 16 252 - 3.8 -8-10 89.1 1100 2.0 94 - 4.4 -10-12 84.5 11<strong>80</strong> 0 67 - 4.0 -12-14 95.0 11<strong>80</strong> 0 44 - 2.8 -14-16 92.8 1170 0 26 - 1.5 -16-18 92.7 1160 0 7.0 - 0.50 -18-20 95.8 1170 0 6.0 - 0.03 -Sampler: Sprut Corer POL (II) Number of cores: 2 Area: 116.2 cm 2 (Ø 86 mm )Depth Dry wt. K-40 Cs-134 Cs-137 Pu-238 Pu-239 Pu-238/Pu-239(cm) (g) Bq/kg dry wt.0-3 85.8 9<strong>80</strong> 105 1210 - - -3-6 114.0 900 95 1220 - - -6-9 113.7 1020 41 541 - - -9-12 129.7 1020 2.0 <strong>80</strong> - - -12-15 131.0 1010 2.9 61 - - -15-18 135.1 1020 3.4 28 - - -18-21 134.8 1010 2.5 8.3 - - -_________________0 = below detection limit- = not analysed
Sampler: Sprut Corer RUS (I) Number of cores: 1 Area: 58.1 cm 2 (Ø 86 mm )Depth Dry wt. K-40 Cs-134 Cs-137 Pu-238 Pu-239 Pu-238/Pu-239(cm) (g) Bq/kg dry wt.0-2 23.2
Sampler: Niemistö Corer D Number of cores: Area: 91.6 cm 2 (Ø 54 mm )Depth Dry wt. K-40 Cs-134 Cs-137 Pu-238 Pu-239 Pu-238/Pu-239(cm) (g) Bq/kg dry wt.0-2 38.6 930 122 1699 - - -2-4 51.7 990 117 1661 - - -4-6 59.5 9<strong>80</strong> 121 1696 - - -6-8 64.9 9<strong>80</strong> 83 1210 - - -8-10 72.4 1050 11 217 - - -10-12 71.6 10<strong>80</strong>
<strong>BALTIC</strong> <strong>SEA</strong> <strong>ENVIRONMENT</strong> <strong>PROCEEDINGS</strong><strong>No</strong>. 1<strong>No</strong>. 2<strong>No</strong>. 3<strong>No</strong>. 4<strong>No</strong>.5A<strong>No</strong>.5B<strong>No</strong>. 6<strong>No</strong>. 7JOINT ACTIVITIES OF THE <strong>BALTIC</strong> <strong>SEA</strong> STATES WITHIN THE FRAMEWORK OF THECONVENTION ON THE PROTECTION OF THE MARINE <strong>ENVIRONMENT</strong> OF THE<strong>BALTIC</strong> <strong>SEA</strong> AREA 1974-1978(1979)*REPORT OF THE INTERIM COMMISSION (IC) TO THE <strong>BALTIC</strong> MARINE<strong>ENVIRONMENT</strong> PROTECTION COMMISSION(1981)*ACTIVITIES OF THE COMMISSION 19<strong>80</strong>- Report on the activities of the Baltic Marine Environment Protection Commission during19<strong>80</strong>- HELCOM Recommendations passed during 19<strong>80</strong>(1981)*<strong>BALTIC</strong> MARINE <strong>ENVIRONMENT</strong> BIBLIOGRAPHY 1970-1979(1981)*ASSESSMENT OF THE EFFECTS OF POLLUTION ON THE NATURAL RESOURCESOF THE <strong>BALTIC</strong> <strong>SEA</strong>, 19<strong>80</strong>PART A-l : OVERALL CONCLUSIONS(1981)*ASSESSMENT OF THE EFFECTS OF POLLUTION ON THE NATURAL RESOURCESOF THE <strong>BALTIC</strong> <strong>SEA</strong>, 19<strong>80</strong>PART A-l : OVERALL CONCLUSIONSPART A-2: SUMMARY OF RESULTSPART B: SCIENTIFIC MATERIAL(1981)WORKSHOP ON THE ANALYSIS OF HYDROCARBONS IN <strong>SEA</strong>WATERlnstitut für Meereskunde an der Universität Kiel, Department of Marine Chemistry, March23 -April 3, 1981(1982)ACTIVITIES OF THE COMMISSION 1981- Report of the activities of the Baltic Marine Environment Protection Commission during1981 including the Third Meeting of the Commission held in Helsinki 16-19 February1982- HELCOM Recommendations passed during 1981 and 1982(1982)ACTIVITIES OF THE COMMISSION 1982- Report of the activities of the Baltic Marine Environment Protection Commission during1982 including the Fourth Meeting of the Commission held in Helsinki l-3 February1983- HELCOM Recommendations passed during 1982 and 1983(1983)<strong>No</strong>. 9<strong>No</strong>. 10SECOND BIOLOGICAL INTERCALIBRATION WORKSHOPMarine Pollution Laboratory and Marine Division of the National Agency of EnvironmentalProtection, Denmark, August 17-20, 1982, Rønne, Denmark(1983)TEN YEARS AFTER THE SIGNING OF THE HELSINKI CONVENTIONNational Statements by the Contracting Parties on the Achievements in Implementing theGoals of the Convention on the Protection of the Marine Environment of the Baltic Sea*) out of print**) in print70
<strong>No</strong>. 11<strong>No</strong>. 12<strong>No</strong> 13<strong>No</strong>. 14<strong>No</strong>. 15<strong>No</strong> 16Area (1984)STUDIES ON SHIP CASUALTIES IN THE <strong>BALTIC</strong> <strong>SEA</strong> 1979-1981Helsinki University of Technology, Ship Hydrodynamics Laboratory, Otaniemi, FinlandP. Tuovinen, V. Kostilainen and A. Hämäläinen(1984)GUIDELINES FOR THE <strong>BALTIC</strong> MONITORING PROGRAMME FOR THE SECONDSTAGE(1984)*ACTIVITIES OF THE COMMISSION 1983- Report of the activities of the Baltic Marine Environment Protection Commission during1983 including the Fifth Meeting of the Commission held in Helsinki 13-16 March 1984- HELCOM Recommendations passed during 1983 and 1984(1984)SEMINAR ON REVIEW OF PROGRESS MADE IN WATER PROTECTION MEASURES17-21 October 1983, Espoo, Finland(1985)ACTIVITIES OF THE COMMISSION 1984- Report of the activities of the Baltic Marine Environment Protection Commission during1984 including the Sixth Meeting of the Commission held in Helsinki 12-15 March 1985- HELCOM Recommendations passed during 1984 and 1985(1985)WATER BALANCE OF THE <strong>BALTIC</strong> <strong>SEA</strong>A Regional Cooperation Project of the Baltic Sea States;International Summary Report(1986)FIRST PERIODIC ASSESSMENT OF THE STATE OF THE MARINE <strong>ENVIRONMENT</strong> OFTHE <strong>BALTIC</strong> <strong>SEA</strong> AREA, 19<strong>80</strong>-l 985; GENERAL CONCLUSIONS(1986)FIRST PERIODIC ASSESSMENT OF THE STATE OF THE MARINE <strong>ENVIRONMENT</strong> OFTHE <strong>BALTIC</strong> <strong>SEA</strong> AREA, 19<strong>80</strong>-1985; BACKGROUND DOCUMENT(1987)ACTIVITIES OF THE COMMISSION 1985- Report of the activities of the Baltic Marine Environment Protection Commission during1985 including the Seventh Meeting of the Commission held in Helsinki 11-14 February1986- HELCOM Recommendations passed during 1986(1986)*<strong>No</strong>. 19<strong>No</strong>. 20<strong>No</strong>. 21<strong>BALTIC</strong> <strong>SEA</strong> MONITORING SYMPOSIUMTallinn, USSR, 10-15 March 1986(1986)FIRST <strong>BALTIC</strong> <strong>SEA</strong> POLLUTION LOAD COMPILATION(1987)SEMINAR ON REGULATIONS CONTAINED IN ANNEX II OF MARPOL 73/78 ANDREGULATION 5 OF ANNEX IV OF THE HELSINKI CONVENTIONNational Swedish Administration of Shipping and Navigation;17-18 <strong>No</strong>vember 1986, <strong>No</strong>rrköping, Sweden(1987)*) out of print**) in print
<strong>No</strong> 22SEMINAR ON OIL POLLUTION QUESTIONS19-20 <strong>No</strong>vember 1986, <strong>No</strong>rrköping, Sweden(1987)<strong>No</strong>. 23 ACTIVITIES OF THE COMMISSION 1986- Report on the activities of the Baltic Marine Environment Protection Commission during1986 including the Eighth Meeting of the Commission held in Helsinki 24-27 February1987- HELCOM Recommendations passed during 1987(1987)*<strong>No</strong>. 24<strong>No</strong> 25PROGRESS REPORTS ON CADMIUM, MERCURY, COPPER AND ZINC(1987)SEMINAR ON WASTEWATER TREATMENT IN URBAN AREAS7-9 September 1986, Visby, Sweden(1987)<strong>No</strong> 26 ACTIVITIES OF THE COMMISSION 1987- Report on the activities of the Baltic Marine Environment Protection Commission during1987 including the Ninth Meeting of the Commission held in Helsinki 15-19 February1988- HELCOM Recommendations passed during 1988(1988)<strong>No</strong>. 27A<strong>No</strong>. 27B<strong>No</strong>. 27C<strong>No</strong> 27D<strong>No</strong>. 28GUIDELINES FOR THE <strong>BALTIC</strong> MONITORING PROGRAMME FOR THE THIRD STAGE;PART A. INTRODUCTORY CHAPTERS(1988)GUIDELINES FOR THE <strong>BALTIC</strong> MONITORING PROGRAMME FOR THE THIRD STAGE;PART B. PHYSICAL AND CHEMICAL DETERMINANDS IN <strong>SEA</strong> WATER(1988)GUIDELINES FOR THE <strong>BALTIC</strong> MONITORING PROGRAMME FOR THE THIRD STAGE;PART C. HARMFUL SUBSTANCES IN BIOTA AND SEDIMENTS(1988)GUIDELINES FOR THE <strong>BALTIC</strong> MONITORING PROGRAMME FOR THE THIRD STAGE;PART D. BIOLOGICAL DETERMINANDS(1988)RECEPTION OF WASTES FROM SHIPS IN THE <strong>BALTIC</strong> <strong>SEA</strong> AREA- A MARPOL 73/78 SPECIAL AREA(1989)<strong>No</strong> 29 ACTIVITIES OF THE COMMISSION 1988- Report on the activities of the Baltic Marine Environment Protection Commission during1988 including the Tenth Meeting of the Commission held in Helsinki 14-17 February1989- HELCOM Recommendations passed during 1989(1989)<strong>No</strong> 30<strong>No</strong>. 31SECOND SEMINAR ON WASTEWATER TREATMENT IN URBAN AREAS6-8 September 1987, Visby, Sweden(1989)THREE YEARS OBSERVATIONS OF THE LEVELS OF SOME RADIONUCLIDES IN THE<strong>BALTIC</strong> <strong>SEA</strong> AFTER THE CHERNOBYL ACCIDENTSeminar on Radionuclides in the Baltic Sea29 May 1989, Rostock-Warnemünde, German Democratic Republic(1989)*) out of print**) in print72
<strong>No</strong>. 32<strong>No</strong>. 33<strong>No</strong>. 34<strong>No</strong>. 35A<strong>No</strong>. 35B<strong>No</strong>. 36<strong>No</strong>. 37<strong>No</strong>. 38<strong>No</strong>. 39<strong>No</strong>. 40<strong>No</strong>. 41<strong>No</strong>. 42<strong>No</strong>. 43<strong>No</strong>. 44DEPOSITION OF AIRBORNE POLLUTANTS TO THE <strong>BALTIC</strong> <strong>SEA</strong> AREA 1983-1985AND 1986(1989)ACTIVITIES OF THE COMMISSION 1989- Report on the activities of the Baltic Marine Environment Protection Commission during1989 including the Eleventh Meeting of the Commission held in Helsinki 13-16 February1990- HELCOM Recommendations passed during 1990(1990)*STUDY OF THE RISK FOR ACCIDENTS AND THE RELATED <strong>ENVIRONMENT</strong>ALHAZARDS FROM THE TRANSPORTATION OF CHEMICALS BY TANKERS IN THE<strong>BALTIC</strong> <strong>SEA</strong> AREA(1990)SECOND PERIODIC ASSESSMENT OF THE STATE OF THE MARINE <strong>ENVIRONMENT</strong>OF THE <strong>BALTIC</strong> <strong>SEA</strong>, 1984-1988; GENERAL CONCLUSIONS(1990)SECOND PERIODIC ASSESSMENT OF THE STATE OF THE MARINE <strong>ENVIRONMENT</strong>OF THE <strong>BALTIC</strong> <strong>SEA</strong>, 1984-l 988; BACKGROUND DOCUMENT(1990)SEMINAR ON NUTRIENTS REMOVAL FROM MUNICIPAL WASTE WATER4-6 September 1989, Tampere, Finland(1990)ACTIVITIES OF THE COMMISSION 1990- Report on the activities of the Baltic Marine Environment Protection Commission during1990 including the Twelfth Meeting of the Commission held in Helsinki 19-22 February1991- HELCOM Recommendations passed during 1991(1991)THIRD BIOLOGICAL INTERCALIBRATION WORKSHOP27-31 August 1990, Visby, Sweden(1991)AIRBORNE POLLUTION LOAD TO THE <strong>BALTIC</strong> <strong>SEA</strong> 1986-1990(1991)INTERIM REPORT ON THE STATE OF THE COASTAL WATERS OF THE <strong>BALTIC</strong> <strong>SEA</strong>(1991)INTERCALIBRATIONS AND INTERCOMPARISONS OF MESUREMENT METHODSFOR AIRBORNE POLLUTANTS(1992)ACTIVITIES OF THE COMMISSION 1991- Report of the activities of the Baltic Marine Environment Protection Commission during1991 including the 13th meeting of the Commission held in Helsinki 3-7 February 1992- HELCOM Recommendations passed during 1992(1992)<strong>BALTIC</strong> MARINE <strong>ENVIRONMENT</strong> BIBLIOGRAPHY 1986-1990(1992)NITROGEN AND AGRICULTURE, INTERNATIONAL WORKSHOP9-12 April 1991, Schleswig, Germany(1993)*) out of print**) in print73
<strong>No</strong>. 45<strong>No</strong>. 46<strong>No</strong> 47<strong>No</strong>. 48<strong>No</strong>. 49<strong>No</strong>. 50<strong>No</strong>. 51<strong>No</strong>. 52<strong>No</strong>. 53<strong>No</strong>. 54<strong>No</strong>. 55<strong>No</strong>. 56<strong>No</strong>. 57<strong>No</strong>. 58SECOND <strong>BALTIC</strong> <strong>SEA</strong> POLLUTION LOAD COMPILATION(1993)SUMMARIES OF THE PRE-FEASIBILITY STUDIESPrepared for the Baltic Sea Joint Comprehensive Environmental Action Programme(1993)*HIGH LEVEL CONFERENCE ON RESOURCE MOBILIZATIONGdansk, Poland, 24-25 March 1993Compilation of Presentations and Statements(1993)THE <strong>BALTIC</strong> <strong>SEA</strong> JOINT COMPREHENSIVE <strong>ENVIRONMENT</strong>AL ACTION PROGRAMME(1993)THE <strong>BALTIC</strong> <strong>SEA</strong> JOINT COMPREHENSIVE <strong>ENVIRONMENT</strong>AL ACTION PROGRAMMEOpportunities and Constraints in Programme Implementation(1993)SEMINAR ON RECEPTION FACILITIES IN PORTSTurku, Finland, 16-19 <strong>No</strong>vember 1992(1993)STUDY OF THE TRANSPORTATION OF PACKAGED DANGEROUS GOODS BY <strong>SEA</strong>IN THE <strong>BALTIC</strong> <strong>SEA</strong> AREA AND RELATED <strong>ENVIRONMENT</strong>AL HAZARDS(1993)ACTIVITIES OF THE COMMISSION 1992- Report on the activities of the Baltic Marine Environment Protection Commission during1992 including the 14th meeting of the Commission held in Helsinki 2-5 February 1993- HELCOM Recommendations passed during 1993(1993)<strong>BALTIC</strong> MARINE <strong>ENVIRONMENT</strong> BIBLIOGRAPHY 1991-1992(1993)FIRST ASSESSMENT OF THE STATE OF THE COASTAL WATERS OF THE <strong>BALTIC</strong><strong>SEA</strong>(1993)ACTIVITIES OF THE COMMISSION 1993- Report on the activities of the Baltic Marine Environment Protection Commission during1993 including the 15th meeting of the Commission held in Helsinki 8-11 March 1994- HELCOM Recommendations passed during 1994(1994)INTERGOVERNMENTAL ACTIVITIES IN THE FRAMEWORK OF THE HELSINKICONVENTION 1974-1994(1994)GUIDELINES FOR THE THIRD POLLUTION LOAD COMPILATION (PLC-3)(1994)*ICES/HELCOM WORKSHOP ON QUALITY ASSURANCE OF CHEMICAL ANALYTICALPROCEDURES FOR THE <strong>BALTIC</strong> MONITORING PROGRAMME5-8 October 1993, Hamburg, Germany(1994)*) out of print**) in print
<strong>No</strong>. 59<strong>No</strong>. 60<strong>No</strong>. 61<strong>No</strong>. 62<strong>No</strong>. 63<strong>No</strong>. 64A<strong>No</strong>. 64B<strong>No</strong>. 65<strong>No</strong>. 66<strong>No</strong>. 67<strong>No</strong>. 68<strong>No</strong>. 69<strong>No</strong>. 70<strong>No</strong>. 71<strong>No</strong>. 72HELCOM SEMINAR FOR EXPERTS FROM ESTONIA, LATVIA, LITHUANIA ANDRUSSIA ON THE IMPLEMENTATION OF HELCOM ARRANGEMENTS, OTHERINTERNATIONAL INSTRUMENTS AND RELATED MATTERS30 August - 3 September 1993, Riga, Latvia(1994)ACTIVITIES OF THE COMMISSION 1994- Report on the activities of the Baltic Marine Environment Protection Commission during1994 including the 16th meeting of the Commission held in Helsinki 14-17 March 1995- HELCOM Recommendations passed during 1995(1995)RADIOACTIVITY IN THE <strong>BALTIC</strong> <strong>SEA</strong> 1984 - 1991(1995)ACTIVITIES OF THE COMMISSION 1995- Report on the activities of the Baltic Marine Environment Protection Commission during1995including the 17th meeting of the Commission held in Helsinki 12-14 March 1996- HELCOM Recommendations passed during 1996(1996)COASTAL AND MARINE PROTECTED AREAS IN THE <strong>BALTIC</strong> <strong>SEA</strong> REGION(1996)*THIRD PERIODIC ASSESSMENT OF THE STATE OF THE MARINE <strong>ENVIRONMENT</strong>OF THE <strong>BALTIC</strong> <strong>SEA</strong>, 1989-l 993; EXECUTIVE SUMMARY(1996)THIRD PERIODIC ASSESSMENT OF THE STATE OF THE MARINE <strong>ENVIRONMENT</strong>OF THE <strong>BALTIC</strong> <strong>SEA</strong>, 1989-1993; BACKGROUND DOCUMENT(1996)OVERVIEW ON ACTIVITIES 1996(1997)*<strong>BALTIC</strong> MARINE <strong>ENVIRONMENT</strong> BIBLIOGRAPHY 1993-1995(1997)WORKSHOP ON THE REDUCTION OF EMISSIONS FROM TRAFFIC IN THE <strong>BALTIC</strong><strong>SEA</strong> AREA(1997)THE EVALUATION OF THE RELATION OF ATMOSPHERIC DEPOSITIONTORIVERINE INPUT OF NITROGEN TO THE <strong>BALTIC</strong> <strong>SEA</strong>(1997)AIRBORNE POLLUTION LOAD TO THE <strong>BALTIC</strong> <strong>SEA</strong> 1991-1995(1997)THE THIRD <strong>BALTIC</strong> <strong>SEA</strong> POLLUTION LOAD COMPILATION(1998)THE FINAL REPORT ON THE IMPLEMENTATION OF THE 1988 MINISTERIALDECLARATION(1998)*THE <strong>BALTIC</strong> <strong>SEA</strong> JOINT COMPREHENSIVE <strong>ENVIRONMENT</strong>AL ACTIONPROGRAMME: RECOMMENDATIONS FOR UPDATING AND STRENGTHENING(1998)*) out of print**) in print75
<strong>No</strong>. 73 OVERVIEW ON ACTIVITIES 1997(1998)<strong>No</strong>. 74<strong>No</strong>. 75<strong>No</strong>. 76<strong>No</strong>. 77<strong>No</strong>. 78<strong>No</strong>. 79AGENDA 21 FOR THE <strong>BALTIC</strong> <strong>SEA</strong> REGION, SUSTAINABLE DEVELOPMENT OF THEAGRICULTURAL SECTOR IN THE <strong>BALTIC</strong> <strong>SEA</strong> REGION(1998)RED LIST OF MARINE AND COASTAL BIOTOPES AND BIOTOPE COMPLEXES OFTHE <strong>BALTIC</strong> <strong>SEA</strong>, BELT <strong>SEA</strong> AND KATTEGAT(1998)MARINE SEDIMENT EXTRACTION IN THE <strong>BALTIC</strong> <strong>SEA</strong> - STATUS REPORT(1999)<strong>BALTIC</strong> LEGAL MANUAL - INFORMATION ON ANTI-POLLUTION REGULATIONSAT <strong>SEA</strong> AND THE PROSECUTION OF VIOLATIONS THEREOF IN THE <strong>BALTIC</strong> <strong>SEA</strong>AREA(2000)GUIDELINES ON ENSURING SUCCESSFUL CONVICTIONS OF OFFENDERS OFANTI-POLLUTION REGULATIONS AT <strong>SEA</strong>(2000)TRANSPORT SECTOR INVESTMENT DECISION-MAKING IN THE <strong>BALTIC</strong> <strong>SEA</strong>REGION(2000)***) out of print**) in print