Explanation of Several Simulation Models - Air Transportation ...
Explanation of Several Simulation Models - Air Transportation ...
Explanation of Several Simulation Models - Air Transportation ...

You also want an ePaper? Increase the reach of your titles
YUMPU automatically turns print PDFs into web optimized ePapers that Google loves.
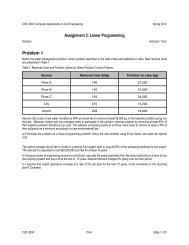
Basics on <strong>Air</strong>port and <strong>Air</strong>space <strong>Simulation</strong><strong>Models</strong>• These models mimic the behavior <strong>of</strong> aircraft incomplex airspace and airport systems• Typically these models use a discrete event simulationapproach (see another handout on this) to move aircraftamong airport and airspace resources• <strong>Air</strong>port and airspace resources are considered objectslike runways, taxiways, gates and airspace links• These models employ some sort <strong>of</strong> link-node structureto move aircraft entities between resourcesVirginia Tech 3
Sample <strong>Air</strong>port and <strong>Air</strong>space <strong>Simulation</strong><strong>Models</strong>SIMMOD - the FAA airport and airspace simulationmodelRAMS - Eurocontrol’s reorganized mathematicalsimulator modelTAAM - Australian developed simulation model (thePreston Group is now part <strong>of</strong> the Boeing Company)<strong>Several</strong> in-house simulation models exist (VPI_asim)Virginia Tech 4
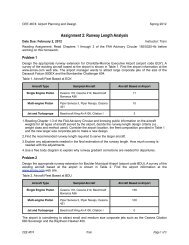
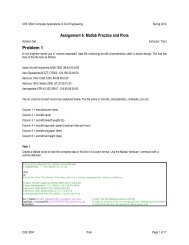
Sample Screen <strong>of</strong> RAMSThe figure illustrates the conflict detection andresolution in RAMSVirginia Tech 10
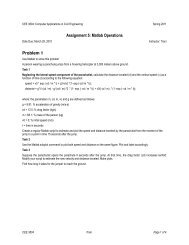
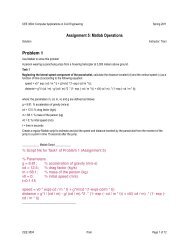
Principles <strong>of</strong> Discrete-Event <strong>Simulation</strong>(Applies to all three models)• The simulation moves from one scheduled event to thenext one• Keeps track <strong>of</strong> simulation events in an orderly fashion• Many internal events are generated for each externalevent.• The simulation clock is based on the current event’sscheduled initiation, not elapsed clock time• Events that are simultaneous, I.e., events with the sameinitiation times, are processed sequentially but there isno time change to the simulation clock.Virginia Tech 11
Typical SIMMOD/TAAM Studies• Runway closure impacts• Analysis and delays <strong>of</strong> airfield ground operations• Taxiway closures and upgrades• Cargo and passenger terminal impact studies• Pavement management• Terminal traffic analysis• Arrival/departure terminal operations• New in-trail aircraft separation procedures• Multi-airport interactionsVirginia Tech 12
Description <strong>of</strong> SIMMOD/TAAMSIMMOD and TAAM are computer modes used inairport operations and planningSimulates airport airside operations (i.e., airfield andairside)Estimates capacity, travel time, delay and fuelconsumption resulting from aircraft operationsAllows the investigation <strong>of</strong> causal links between airporttechnological improvements, aircraft operationalprocedures and their effect on aircraft delayVirginia Tech 13
Justification <strong>of</strong> Large-Scale <strong>Models</strong>Computer models are:• Safe in ascertaining the impact <strong>of</strong> operational changes• Inexpensive to use• Flexible to account for special airport/airspaceconditions• Provide answers to airspace and airport operationalanalysts• Help to understand complex operational phenomena• Improve decision-making abilityVirginia Tech 14
SIMMOD’s History• Development <strong>of</strong> the <strong>Air</strong>port/<strong>Air</strong>space Delay Model(ADM)(1978-1979)• Development <strong>of</strong> SIMMOD fuel consumption postprocessors(1983)• Validation <strong>of</strong> the SIMMOD <strong>Simulation</strong> Model (1985-1991)• IBM and Compatible version 1.2 available in late1992• Virginia Tech implements runway and HS runway exitlogic changes (1995)• SIMMOD Plus! from the ATAC CorporationVirginia Tech 15
Large Scale Model as Decision Analysis Tools<strong>Air</strong>space and <strong>Air</strong>portPhysical LayoutFlightSchedulesATC PoliciesandProceduresVirginia Tech 16
How SIMMOD/TAAM and Work• Builds airspace and airports from inputs that describethe physical layout.• Simulates all flights plane-by-plane.• Uses external data to initiate flights.• Resolves all conflicts.• Monitors time and fuel consumed along each segment.• Generates reports <strong>of</strong> some <strong>of</strong> the following: StatisticalSummaries, Graphics and AnimationVirginia Tech 17
Sample Application (SIMMOD)• Raleigh-Durham International <strong>Air</strong>port (RDU) in NorthCarolina represents a typical example <strong>of</strong> a medium sizehub airport in the US• Given a baseline aircraft demand during a two hourpeak period you will be asked to modify the airspaceand run some baseline simulationsVirginia Tech 18
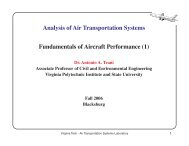
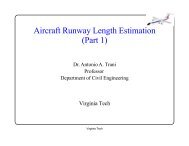
Graphical Description <strong>of</strong> RDU Terminal<strong>Air</strong>spaceNode2964 n.m.Node 295Arrival Track 110 n.m.Node 29430 Degrees5 n.m.4 n.m.Node297LOM 1Node 2676 n.m.RDU <strong>Air</strong>port05L23RDeparture Track 16 n.m.Node304Node30520 Degrees5 n.m.Node3024 n.m.Node 271LOM 26 n.m.05R23L6 n.m.Node20 Degrees280Departure Track 2Node307Node3014 n.m.10 n.m.Node 299Node 300Arrival Track 230 DegreesVirginia Tech 19
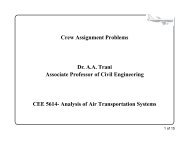
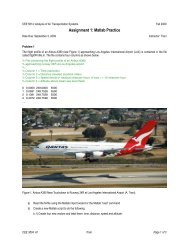
Graphical Depiction <strong>of</strong> RDU <strong>Air</strong>fieldConfigurationNode 17G 201 (American)G 165(US<strong>Air</strong>)CRunway 5L-23RNode 16ABProposed CargoTerminalNode 11Runway 5R-23LG 181 (Delta)Node 245RDU <strong>Air</strong>port with Supergates ShownGate CapacitiesConcourse A - 15 aircraft Concourse B - 10 aircraftConcourse C - 30 aircraft Cargo Complex - 30 aircraftVirginia Tech 20
RDU Baseline Input Parameters (<strong>Air</strong>craftDemands during a Two Hour Peak Hour)Flight Type <strong>of</strong> <strong>Air</strong>craft Departure Time Gate(hours + decimal)1 AA 231 B 727-200 7.15 G 2012 AA 450 B 727-200 7.20 G 2013 AA 120 B 737-200 7.23 G 2014 AA 003 F28 MK 2000 7.24 G 2015 AA 052 F28 MK 2000 7.26 G 2016 AA 2231 DC9-30-50 7.32 G 2017 AA 123 B 727-200 7.41 G 2018 DEL 200 F28 MK 4000 7.45 G 1819 USA 125 F28 MK 4000 7.50 G 16510 AA 454 B 727-200 7.52 G 20111 DEL 560 F28 MK 4000 7.55 G 18112 AA 320 B 727-200 7.58 G 20113 USA 178 F28 MK 4000 7.60 G 16514 DEL 678 F28 MK 4000 7.62 G 18715 AA 2311 DC9-30-50 7.64 G 20116 AA 2323 DC9-30-50 7.65 G 20117 AA 2345 DC9-30-50 7.66 G 20118 USA 780 B 727-200 7.70 G 16519 AA 356 DC-10-10 7.79 G 20120 AA 430 B 727-200 7.82 G 201Virginia Tech 21
<strong>Air</strong>craft Demands during a Two Hour PeakHour - ContinuationFlight Type <strong>of</strong> <strong>Air</strong>craft Departure Time Gate(hours + decimal)21 AA 579 B 727-200 7.83 G 20122 AA 122 A 300-600 7.85 G 20123 AA 065 A 300-600 7.88 G 20124 DEL 032 F 28 MK 4000 7.90 G 18125 AA 012 DC-10-10 7.93 G 20126 USA 005 F 28 MK 4000 8.00 G 16527 AA 4543 B 727-200 8.13 G 20128 DEL 563 F 28 MK 4000 8.20 G 18129 AA 3200 B 727-200 8.24 G 20130 USA 103 F 28 MK 2000 8.30 G 16531 DEL 6782 F 28 Mk 4000 8.32 G 18732 AA 2314 DC9-50 8.40 G 20133 AA 2327 DC9-50 8.43 G 20134 AA 2305 DC9-50 8.52 G 20135 USA 781 B 727-200 8.56 G 16536 AA 357 DC-10-10 8.70 G 20137 AA 5784 B 727-200 8.75 G 20138 AA 053 B 727-200 8.80 G 20139 AA 1222 A 300-600 8.84 G 20140 AA 865 A 300-600 8.92 G 201Virginia Tech 22
RDU Input <strong>Air</strong>craft Schedule (DeparturesDuring Two Hour Peak Period)Flight Type <strong>of</strong> <strong>Air</strong>craft Departure Time Gate(hours + decimal)1 AA 002 B 727-200 (29) 6.68 G 2012 AA 087 B 737-200 (45) 6.73 G 2013 AA 149 B 737-200 (45) 6.76 G 2014 DEL 096 F 28 MK 2000 (38) 6.80 G 2015 AA 3290 DC9-50 (46) 6.85 G 2016 AA 4670 DC9-50 (46) 6.88 G 2017 AA 274 B 727-200 (29) 7.03 G 2018 DEL 466 F 28 MK 4000 (39) 7.11 G 1819 USA 102 F 28 MK 2000 (38) 7.27 G 16510 AA 338 B 727-200 (29) 7.45 G 201Numbers in Parenthesis are the aircraft number according to SIMMODVirginia Tech 23
SIMMOD <strong>Air</strong>craft Number EquivalentsPartial List<strong>Air</strong>craft SIMMOD Number <strong>Air</strong>craft Engine<strong>Air</strong>bus A 300 31 GE CF6-50CBoeing 727-200 29 PW JT8D-15QNBoeing 737-200 45 PW JT8D-9QNBoeing 747-200 2 PW JT9D-FLBoeing 747-100 1 PW JT9D-BDBoeing 757-200 52 PW 2037MD-83 50 PW JT8D-219Douglas DC9-50 46 PW JT8D-17Douglas DC10-10 19 GE CF6-6DFokker F28 MK 2000 38 RR 183-2Fokker F28 MK 4000 39 RR 183-2PSaab SF 340 72 GE CT7-5Canadair CL 600 58 ALF 502LCessna 500 57 PW JTD15-1GASEPV 74 GenericVirginia Tech 24
IFR <strong>Air</strong>craft Intrail Separation MatrixLeading <strong>Air</strong>craft<strong>Air</strong>craft 1 2 3 4Group1 3.0 4.0 5.0 6.02 3.0 3.0 4.0 5.03 3.0 3.0 3.0 4.04 3.0 3.0 3.0 3.0Use the following parameters to estimate actual (stochastic separations)σ 0= 18q v= 1.65Standard deviation <strong>of</strong> intrail delivery error (seconds) for manual ATCValue <strong>of</strong> cumulative standard normal at Pv= 5% (prob. <strong>of</strong> violations)Virginia Tech 25
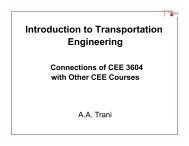
Sample Results (RDU)Average <strong>Air</strong>craft Delay vs. Number <strong>of</strong> Operations109RDU File8Average <strong>Air</strong>craftDelay (minutes)765432Ground Delay<strong>Air</strong> DelayTotal Delay102030405060708090<strong>Air</strong>craft Operations (<strong>Air</strong>craft/Hour)Virginia Tech 26
Sample Results for RDU (IFR WeatherConditions)Average <strong>Air</strong>craft Delays for RDU Under IFR Conditions15Average <strong>Air</strong>craftDelay (minutes)12963<strong>Air</strong> Delay (IFR)Ground Delay (IFR)Total Delay (IFR)056 76 96Operations per HourVirginia Tech 27
Sample Results for RDU (VFR WeatherConditions)Average <strong>Air</strong>craft Delay for RDU Under VFR Flight Conditions1210Average <strong>Air</strong>craftDelay (minutes)864<strong>Air</strong> Delay (VFR)Ground Delay (VFR)Total Delay (VFR)2056 76 96<strong>Air</strong>craft Operations per HourVirginia Tech 28
Sample Results for RDU and ATC SectorStudyRDU Sector Capacity/Delay Sensitivity Study108Average <strong>Air</strong>craftDelay (minutes)642Ground Delay<strong>Air</strong> DelayTotal Delay03 4 5 6Sector Capacity(Simultaneous <strong>Air</strong>craft)Virginia Tech 29
Creating Application with Multiple <strong>Air</strong>ports• All large-scale simulation models allow the creation <strong>of</strong>scenarios with multiple airports• Discuss the implications <strong>of</strong> multiple airport analysis inairport engineering and planning• <strong>Air</strong>port interfences• <strong>Air</strong>space planning studies• Traffic issuesVirginia Tech 30
México City International <strong>Air</strong>port (México)RWY 23RSupergate for 50 aircraft500 m.RWY 23L440 m.0 500 1000Scale in meters<strong>Air</strong>line TerminalRWY 13440 m.3,400 m.North530 m.183 m.500 m.3,050 m.183 m.1,950 m.440 m.350 m.200 m.350 m.RWY 33350 m.RWY 5LGeneral AviationTerminal183 m.250 m.RWY 5RVirginia Tech 31
Acapulco International <strong>Air</strong>port (Mexico)<strong>Air</strong>line TerminalGA TerminalRWY 10183 m.400 m.400 m.RWY 24550 m.North250 m.550 m.350 m.250 m.250 m.1,600 m.200 m.600 m.3,050 m.RWY 28122 m.RWY 06Supergate for 50 aircraft0 500 1000Scale in metersVirginia Tech 32
México City Terminal Area (Sketch)1A5 nmDeparture Track2A3A10 nm7 nm5 nm4 nm 10 nm DME Arc5 nm6 nmMEX VOR6 nm12 nm5 nm1D8 nm4 nmLOM2DArrival Tracks to MEX30 nmDeparture Track4ATEQ VORVirginia Tech 33
Acapulco <strong>Air</strong>port Terminal Area (Sketch)To INT SFCFrom INT CANto TEQ VORDepartureTrack1D4 nm4 nmVORDepartureTrack onV-15ArrivalTrack1AArrivalTrack2A4 nm2D4 nm4 nm4 nm6 nm4 nm4 nm5 nm5 nmACA VOR4 nm3 nm8 nm3 nm4 nmVirginia Tech 34
MEX-ACA <strong>Air</strong>way SystemMEX VORDeparture Trackson RWY 5R and 5LArrival Tracksto RWY 5R or 5L40.0 nmTEQ VORJ-21 W(ACA Departure Route)89.0 nm89.0 nmV-15NorthINT SFCINT CANJ-21 E(Arrival ACA Route)<strong>Air</strong> Distance betweenACA and MEX VOR'svia J-21 E or J-21 Wis 189.0 nm.60.0 nmACA VOR60.0 nm<strong>Air</strong> Distance betweenINT CAN and SFC is20.0 nmVirginia Tech 35
Large-Scale Model Inputs (Typical)• <strong>Air</strong>space files (link and node structures)• <strong>Air</strong>field files (link and node structures)• <strong>Air</strong>craft file (demand or schedule files)• Ancilliary files (for other tasks like fuel consumptionetc.)Virginia Tech 36
Large-Scale Model Outputs (Typical)• <strong>Air</strong>craft delays (in the airfield and in the airspace)• Fuel consumption (TAAM and RAMS)• Arrivals vs. Departures• Runway utilization patterns• Travel times and delays (air and ground)• Hourly delay metrics• Animation <strong>of</strong> aircraft operations (a selling point toshow decision makers what will happen)Virginia Tech 37
Use <strong>of</strong> Animation in <strong>Air</strong>port Modeling and<strong>Simulation</strong>• Serves to identify potential airspace/runway logicproblems• Analysts can examine the simulation in real time orfaster• Identifies visually potential queueing problems atvarious airfield spots• Helps non-technical people to understand airportoperations (specially good for airport facilities withcommunity complaints)Virginia Tech 38
<strong>Air</strong>craft Move Checks (Ground and <strong>Air</strong>space)Scheduled at a node by the following:• <strong>Air</strong>craft arriving at current node• <strong>Air</strong>craft departing from current node• Estimated release time for aircraft in holding queue atthe current node• <strong>Air</strong>craft departing from an approaching node to currentnode• <strong>Air</strong>craft leaving holding queue from an approachingnode to current nodeVirginia Tech 39
Sample SIMMOD <strong>Air</strong>space LogicDescription:<strong>Air</strong>craft holding at node 2.Route 13<strong>Air</strong>craft at node 3 must hold until node 2 hasan empty holding queue.Route 2Link 2Node 2Holding Queue<strong>Air</strong>portInterfaceNodeLink 3 Link 14 2 1Link 4Route 35Virginia Tech 40
Order <strong>of</strong> Actions to Impose Delays (SIMMOD)• Reduce aircraft speed based on node strategy (i.e., ATCspeed change request)• Vectors where wake turbulence on link is not aconsideration..• System cannot track wake during vectoring (ATCresponsibility)• Vector time must be specified for each link• Hold at nodeVirginia Tech 41
New SIMMOD Interface (SIMMOD Plus 7.0)• Two version <strong>of</strong> SIMMOD have been developed by theATAC Corporation (SIMMOD systems integrator forFAA):• SIMMOD Plus! 7.0• SIMMOD Pro (based on work done for the Navy)• The new version <strong>of</strong> SIMMOD Plus! 7.0 has a verydetailed Java-based interfaceVirginia Tech 42
Sample SIMMOD Plus! (Builder GUI)Source:ATAC CorporationVirginia Tech 43
Sample SIMMOD Plus! InterfaceSource:ATAC CorporationVirginia Tech 44
Sample SIMMOD Plus! (Animation)Node delays shownSource:ATAC CorporationVirginia Tech 45
SIMMOD Plus! <strong>Air</strong>craft MonitorSource:ATAC CorporationVirginia Tech 46
Sample <strong>Air</strong>space Study in RAMS (CSSI)Virginia Tech 47
RAMS Atlanta <strong>Air</strong>space StudyATL<strong>Air</strong>portVirginia Tech 48
TAAM• An airspace and airfield simulation model developed bythe Preston Group (Australia) - a Boeing Company• Good airfield and airspace logic• Gate-to-Gate simulator (important for someapplications)• Excellent graphics• Large learning curve• Limited stochastic behavior (only the aircraftperformance is somewhat stochastic in this model)Virginia Tech 49
TAAM Data Directory OrganizationVirginia Tech 50
TAAM Relation to <strong>Air</strong>craft Performance• TAAM uses table functions to approximate theperformance <strong>of</strong> aircraft in the airspace and on theground• Currently, 60 aircraft are included in the TAAMdatabase (version 1.2 under Solaris 2.8)• Transport aircraft and GA vehicles are included in thedatabase• Technically, it is not difficult to add an aircraft to theTAAM aircraft definition fileVirginia Tech 51
Sample TAAM <strong>Air</strong>craft Data57 # SUPER KING AIR -SHORT/LONG -BE20 S 4 4 M M # Type, Haul, Wake Turb.Cat., Classif.,Performance Cat (SID, STAR)030 280 350 # Preferable levels (Low, High), Ceiling (FL)015 104 114 126 0.0 0.0 0.0 12 # Below level... Min,Norm,MaxClimb.IAS(kt) Mach, Fuel C.030 110 160 210 0.0 0.0 0.0 12050 110 160 200 0.0 0.0 0.0 12100 110 160 195 0.0 0.0 0.0 12150 110 140 190 0.0 0.0 0.0 12190 110 140 190 0.0 0.0 0.0 12230 110 130 180 0.0 0.0 0.0 12260 110 130 160 0.0 0.0 0.0 12310 110 120 140 0.0 0.0 0.0 10350 110 120 120 0.0 0.0 0.0 10Virginia Tech 52
TAAM Studies• Berlin multi-airport and airspace simulation• Delta <strong>Air</strong>lines Atlanta simulation• FEDEX cargo hub modeling• FAA ARTCC modeling (Kansas City)• FAA Super TRACON modeling (Potomac metroplexstudy)• NASA Ames studies <strong>of</strong> advanced ATM concepts• VPI SATS enroute analysis• GMU SATS enroute analysisVirginia Tech 53
DFS Case Study• Optimization <strong>of</strong> a complex airspace structure andarrival/departure procedures for the approach controlunit serving the three airports <strong>of</strong> Berlin (Germany)• Developed a new airspace sectorization scheme withdeparture routes representing more optimal flightpr<strong>of</strong>iles• This resulted in a reduction <strong>of</strong> the controllers'coordination “workload” by almost 35%• Shorter arrival routes and optimized descent pr<strong>of</strong>iles• Reduced fuel burn (due to shorter flying time).Virginia Tech 54
FEDEX Use <strong>of</strong> TAAM• Construction work at Memphis (FEDEX Hub) runwaysrequired a change <strong>of</strong> operating procedures and forcedthe use <strong>of</strong> an alternate runway.• TAAM simulation showed that a 30% delay reductioncould be achieved through the use <strong>of</strong> a new parkingplan and departure order• Revised departure plan produced estimated annualsavings in fuel costs <strong>of</strong> $5 - $10 million for twoprojects.Virginia Tech 55
TAAM Study <strong>of</strong> SATS Enroute Traffic• A non-funded study was performed at Virginia Tech tostudy the impacts <strong>of</strong> SATS traffic in the enrouteairspace above the State <strong>of</strong> Virginia Boundaries• SATS = Small <strong>Air</strong>craft <strong>Transportation</strong> System (a NASAlangley initiative to bring General Aviation aircraft tothe masses)• Limited study <strong>of</strong> baseline conditions (no SATS), 5%and 10% enplanements in NAS shifting mode to SATS.(Performed by Baik, Farrell, Trani and Koelling)• Another more comprehensive study being done byGeorge Mason for the Virginia SATS Alliance withinputs from LMI and Virginia TechVirginia Tech 56
Scenario ModeledVirginia Tech 57
Statistics <strong>of</strong> Scenario ModeledVirginia Tech 58
Modeled Scenario (Part <strong>of</strong> ZDC)Virginia Tech 59
Results <strong>of</strong> Study (Baik/Trani, 2002)Region <strong>of</strong> Interest = Size <strong>of</strong> ZDC ARTCCNumber <strong>of</strong> Daily Conflicts1800016000140001200010000800060004000TAAM simulationsAnalytical Results (AEM model)Numbers indicate minimumseparation criteriaCurrent Traffic Level10 nmCurrent NAS(baseline)5 nm3 nm2 nmNASwith SATS200000.6 0.8 1 1.2 1.4 1.6 1.8 2 2.2x 10 4Number <strong>of</strong> Daily Flights (all types)Virginia Tech 60
Other Results (Baik/Trani, 2002)Number <strong>of</strong> Conflicts120001000080006000400020000Conflicts (100-120% Required Separation)3200596244838931936 1167 125550352000 2010 2015Year101060% SATS5% SATS10% SATSVirginia Tech 61
The Virginia Tech <strong>Air</strong>port <strong>Simulation</strong> Model• Hybrid simulation model• Microscopic in nature (second-by-second output ifrequired)• <strong>Models</strong> aircraft operations around the airport terminalarea (includes sequencing)• <strong>Models</strong> ATC-pilot interactions explicitly (voice anddatalink)• Dynamic taxiing plans (true dynamic trafficassignment)• Developed under the auspices <strong>of</strong> the FAA NEXTORbasic research funding (ATM agenda)Virginia Tech 62
Framework for VTASIMNominal Schedulefor ArrivalsSeparationRuleNominal Schedulefor Departures<strong>Air</strong>craft Sequencing Problem(ASP)Optimal sequence and scheduleTime-dependent O-D(between gates and runways)Taxiing NetworkConfigurationNetwork Assignment Problem(NAP)<strong>Simulation</strong>(VTASM)Optimal taxiing routesfor arrivals and departuresVirginia Tech 63
Development <strong>of</strong> a <strong>Simulation</strong> Model: VTASIM• Existing microscopic simulation models for airportstudies:• SIMMOD, TAAM (airfield and airspace analyses)• <strong>Air</strong>port Machine (airfield analysis)• RAMS (airspace analysis)• These models are:• discrete-event simulation models,• less accurate in describing the aircraft movement,• do not describe communication process (ATC-pilot).Virginia Tech 64
VTASIM is a Hybrid-type <strong>Simulation</strong> Model• A discrete-event simulation model• Represents a system by changing the system status at themoments when an event occurs• A discrete-time simulation model• Represents a system checking and changing the systemstatus at every step size (dt).• VTASIM is a hybrid-type simulation model• Movement: represented by discrete-time simulationmodel• Communication: represented by discrete-eventsimulation modelVirginia Tech 65
Entities and State Variables in VTASIMEntities:• Two types <strong>of</strong> controllers (i.e., local and groundcontrollers),• Two types <strong>of</strong> flights (i.e., departing and arriving flights),and• Facilities including gates, taxiways, runways, etc.State Variables:• Controllers: controlling state, next communication time,• Flights: communication state, next communication time,movement state, next movement time, speed,acceleration, position, etc.,Virginia Tech 66
• Gates, taxiways, runways: current flight(s).Virginia Tech 67
Ground Control Model Features• Communication interactions between ATC controllers/data link and each aircraft is explicitly modeled• Delay analysis. There are two types <strong>of</strong> delay:• Traffic delay due to the traffic congestion on taxiway/runway• Communication delay due to the controller/data linkcommunications• Dynamic aircraft-following logic• Static and dynamic route guidance for taxingVirginia Tech 68
State Diagram for COM (Voice Channel)Start CommunicationPut this flight strip toprogressing box.Is controller busy?NoSendingRequest(t1)WaitingCommand(t2)ReceivingCommand(t3)SendinConfirm(t4)YesWaitNextComm.(t0)End CommunicationReady tocomm.SendingConfirm.(t4)ReceivingCommand(t3)WaitContactfromControllerReceived cleaNo(i.e., Delayed)Virginia Tech 69
State Diagram for Controller’s Data StripsCompletedFlight StripsCompletedFlight StripsProcessingFlight StripsProcessingFlight StripsPendingFlight StripsPendingFlight StripsGround controller’sflight strip organizationLocal controller’sflight strip organizationVirginia Tech 70
Algorithm: Dynamic Taxiing Route Plann = 1Considers time-dependentnetwork loadingEmploys an incrementaltime-dependentnetwork assignment strategyBased on time-dependentshortest path algorithmFind TDSPfor the n th aircraft(by usingTDSP algorithm)Assign the n thaircraft on thelinks involved inthe TDSP overtime intervalsUpdatelink travel timesn = last vehicle?Non = n+1YesEndVirginia Tech 71
1006Algorithm: Dynamic Taxiing Route Plan100610071008200510071008200521211009 10101 1011210121014310154 10165101710186101971020 10212006200720102008201220111013200920151009 10101 1011210121014310154 10165101710186101971020 1021200620072010200820122011101320092015121082013201410233312108201320141023331028111030102910329102610311024 10251027201720161028111030102910329102610311024 102510272017201610332018201910332018201932020202101Statically assigned path32020012021Time-dependent assigned pathVirginia Tech 72
<strong>Air</strong>craft Following ModelH tv t+dtBasic equations <strong>of</strong> motion to characterize the aircrafttaxiing following modeld fH jvt+ ∆t= v (1−) Speed equation <strong>of</strong> motionHatt d1= ( vt+ 1− vt) ∆tAcceleration equation <strong>of</strong> motiot +∆n+ /Virginia Tech 73
Conflict Detection and Resolution ModelSecond or later flights on this link(do follow the leading flightby car-following logic)First flight on this link(Need to checkthe potential collision)Conflicting flights comingtoward thecommon intersection15.6(sec)20.8(sec)F1F3Current position<strong>of</strong> flightStart point<strong>of</strong> Intersection30.7(sec)Legend :the current operation directionF2Expected arrival time tothe common intersction(ET i)Virginia Tech 74
Four Phases <strong>of</strong> the Landing ProcedureExit pointTouchdown Point<strong>Air</strong> SpeedAltitudeDisatanFLFR BR COExitRunwFL : FlareFR: Free-rollingBR: BrakingCO: CoastingVirginia Tech 75
Example <strong>of</strong> Output File (1): Log FileSecond-by-second statistics can be obtained in VTASIMTime = 320.000DEP_1 (4.27860, 7.23847)readyToCommunicateclearToTakeOff rolling228.557 5.65931 2006 -> 2005347.582 322.875 8907.85DEP_2 (3.44770, 3.71363)readyToCommunicateclearToTaxi taxiingToDepQue27.3409 0.000000 1031 -> 2018782.058 727.237 3832.22<strong>Air</strong>craft ID and PositiAcft. COMM StateAcft. PermissionAcft. speed, accel. anlink informationVirginia Tech 76
Example <strong>of</strong> Output File (2): Summary File------------------------------- SUMMARY -------------------------------Flight (Departure DEP_1, B727-100, Gate 1, Runway 36)Enters into the simulation at : 1 sec.Taxiing Duration : 73 - 217Taxiing Delay : 2.22827Nominal Take<strong>of</strong>f Time (= NTOT) : 186Sequenced Take<strong>of</strong>f Time (= STOT) : 268Actual Take<strong>of</strong>f Time (= ATOT) : 289Runway Occupancy Time (= ROT) : 289 - 328Sequenced Delay (= ATOT - STOT) : 21Runway Delay (= ATOT - NTOT) : 103Virginia Tech 77
Local Controller Workload MetricLocal controller’s workload (2)(Utilization factor = 0.607)109No. <strong>of</strong> aircraft contacting controller<strong>Air</strong>craft Under Control8765432100 200 400 600 800 1000 1200 1400 1600 1800Time Time (seconds) (second)Virginia Tech 78
Delay Curves for Mixed Runway Operations900Average <strong>Air</strong>craft Delay (seconds)Average Delay per <strong>Air</strong>craft (seconds)800700600500400300200<strong>Simulation</strong> +Average oTextEnd100010 15 20 25 30 35 40 45 50 55 60Number <strong>of</strong> Operations<strong>Air</strong>craft Operations per HourVirginia Tech 79
Sample <strong>Air</strong>craft Delays CurvesVoice channel - three assignment techniques studiedVirginia Tech 80
Sample Delay Curves (datalink analysis)Datalink active - three assignment techniques studiedVirginia Tech 81