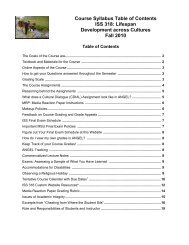
STRUCTURE OF THE HYPOMANIC PERSONALITY SCALE50910. extreme intense emotion.8421. moods do not fluctuate37. mood up, down44. speeded up irritable45. happy, irritable8. impossible to sit still46. can't stop talking9. amusing eccentric31. can slow down41. brief inspiration20. no need to sleep43. excited involved35. moods / no rules5. ideas so fast38. thoughts racing-.86.86.71.71-.63.63.71.71.69.69C5= .85C4= .68.78C14= .57.73C3= .68.72C6= .64.91.83.82.84.82C23= .82= .73C20= .67= .65C22= .69= .62C24= .66= .59.84.85.85.75C21= .71= .63N = 4C25= .78= .72N = 6.87.90.74C26= .84= .77N = 10.92C34= .86= .70N = 12.92C40= .88= .69N = 153. friends / hyper32. hyper17. average mood18. outperform anyone15. excited / happy / no reason11. high spirits, can't concentrate33. giddy.93.93.80.80C1= .93.83C7= .78.76.90-.82C15= .80= .75.90.82C27= .81= .68N = 4-.91C28= .82= .69N = 5.91C35= .87= .76N = 726. good actor2. nervous / clown4. good comedian30. politician7. assertive, sociable25. uncomfortable / social6. let o<strong>the</strong>rs / attention40. life <strong>of</strong> party-.75.75-.77.77-.85.85.81C10= .72C12= .75C11= .84.86.87.83C19= .74= .68-.85C29= .77= .69N = 4.68-.90C30= .83= .77N = 6.82.90.74C33= .85= .73N = 9.92C37= .85= .56N = 10.91C38= .87= .68N = 13.89C42= .88= .69N = 2329. group / adventurous / crazy36. sexy13. people clever idea39. control o<strong>the</strong>rs42. persuade o<strong>the</strong>rs22. mood / everywhere / everything23. succeed / several19. range <strong>of</strong> interests34. succeed47. ra<strong>the</strong>r ordinary16. no book about my life48. achievements forgotten14. average self-aware1. average27. normal.66.66.79.79.71.71.69.69.71.71C17= .55.61.85C9= .77.77.80C2= .68.82C8= .64.68C13= .67.85.84.80C32= .71= .58C18= .72= .67C16= .70= .66C36= .61= .47.86.80.78C31= .74= .62N = 4C39= .73= .59N = 6-.76-.82C41= .78= .58N = 10.82Figure 1. ICLUST output using <strong>the</strong> maximum beta criterion. Path coefficients represent reliability-correctedcorrelations. For clusters, alpha was used for <strong>the</strong> correction; for items, item–total correlations were used as anestimate <strong>of</strong> reliability. Note that <strong>the</strong> final purified solution in Table 1 is slightly different from <strong>the</strong> clusteringsolution in <strong>the</strong> figure (see footnote 1). C Cluster.
510 SCHALET, DURBIN, AND REVELLETable 2Three-Factor Model <strong>of</strong> <strong>the</strong> <strong>Hypomanic</strong> <strong>Personality</strong> <strong>Scale</strong><strong>Scale</strong> item Factor 1 Factor 2 Factor 3 h 242. Persuade and inspire o<strong>the</strong>rs 0.67 0.00 0.02 0.4740. Life <strong>of</strong> party 0.59 0.18 0.36 0.5725. Social discomfort 0.56 0.26 0.26 0.4516. No book about my life 0.56 0.16 0.19 0.3136. Can elicit sexual interest 0.53 0.06 0.04 0.2934. Succeed 0.53 0.21 0.21 0.317. Assertive, sociable 0.53 0.07 0.20 0.3730. Politician 0.52 0.02 0.10 0.2539. Good at controlling o<strong>the</strong>rs 0.52 0.17 0.08 0.306. Not center <strong>of</strong> attention 0.51 0.18 0.43 0.5413. Have clever ideas 0.49 0.03 0.08 0.221. Average person 0.47 0.17 0.16 0.2323. Succeed in several domains 0.46 0.24 0.20 0.252. Nervous about playing <strong>the</strong> clown 0.46 0.18 0.27 0.3326. Good actor 0.46 0.14 0.11 0.3029. Have persuaded o<strong>the</strong>rs to be adventurous, crazy 0.45 0.07 0.20 0.334. Good comedian 0.45 0.01 0.12 0.2648. Achievements will be forgotten 0.43 0.09 0.08 0.1947. Ra<strong>the</strong>r be ordinary 0.43 0.27 0.11 0.2518. Feel I can outperform anyone 0.41 0.24 0.15 0.3427. Normal person 0.29 0.24 0.06 0.1938. Thoughts racing 0.09 0.61 0.10 0.4644. Speeded-up and irritable 0.10 0.61 0.12 0.4237. Moods up and down 0.25 0.58 0.14 0.4021. Moods do not fluctuate 0.04 0.56 0.20 0.425. Ideas and insights too fast to express 0.22 0.51 0.00 0.3535. Mood rules don’t apply 0.26 0.48 0.01 0.3420. No need to sleep 0.05 0.46 0.26 0.388. Impossible to sit still 0.08 0.45 0.35 0.4045. Happy and irritable at same time 0.03 0.44 0.09 0.2441. Brief periods <strong>of</strong> inspiration 0.07 0.43 0.04 0.2231. Can slow down 0.03 0.42 0.24 0.3010. Extreme, intense emotion 0.02 0.42 0.24 0.2922. Get into mood to do everything 0.25 0.41 0.15 0.3428. Write down creative thinking 0.18 0.39 0.09 0.1843. Excited about project 0.16 0.39 0.10 0.2419. Range <strong>of</strong> interests 0.33 0.35 0.01 0.279. Amusing, eccentric 0.04 0.32 0.32 0.2832. A hyper person 0.01 0.03 0.85 0.743. Friends say I’m hyper 0.04 0.13 0.79 0.7033. Happy, energetic, giddy 0.07 0.11 0.66 0.5411. High spirits, can’t concentrate 0.07 0.24 0.56 0.5046. Impossible to stop talking 0.04 0.27 0.55 0.4917. Average mood 0.18 0.17 0.46 0.3815. Excited and happy, no reason 0.11 0.02 0.45 0.2524. Excited and happy, I know why 0.00 0.20 0.23 0.1214. No more self-aware 0.28 0.24 0.16 0.1312. Nothing can happen to me 0.22 0.26 0.02 0.13Note. Pattern matrix <strong>of</strong> factor loadings. Ordinary least squares factor analysis was based on tetrachoric correlations. Items 12, 24, and 28 were includedin <strong>the</strong> analysis. Items listed are truncated versions. Items with loadings in bold correspond to items also assigned to <strong>the</strong> corresponding cluster.18, 20, 21, 22, 24, 31, 33, 35, 37, 38, 44, 45, and 46) represents amerging <strong>of</strong> mostly Mood Volatility items (11 out <strong>of</strong> 15) and <strong>the</strong>Excitement items (six out <strong>of</strong> eight). This is consistent with our datato <strong>the</strong> extent that <strong>the</strong>se two clusters are highly correlated andmerge into a single cluster in a two-cluster model. Our SocialVitality cluster, however, is represented by three different factorsin Rawlings et al.’s analysis. Although items reflecting <strong>the</strong> secondfactor (Items 5, 9,12, 13, 19, 23, 26, 28, 34, 36, 41, 42, and 43)were scattered across <strong>the</strong> subclusters <strong>of</strong> Social Vitality, itemsloading high on <strong>the</strong> third factor (Items 2, 3, 4, 6, 25, 29, 32, and 40)reflected exhibitionist tendencies and mostly clustered toge<strong>the</strong>r(six out <strong>of</strong> eight items). Items loading highly on <strong>the</strong> fourth factor(Items 1, 14, 16, 27, 47, and 48) reflected <strong>the</strong> reverse-scored items<strong>of</strong> Ordinariness and entirely cluster toge<strong>the</strong>r before merging into<strong>the</strong> larger Social Vitality cluster (see Figure 1 for <strong>the</strong> location <strong>of</strong><strong>the</strong>se items in <strong>the</strong> cluster hierarchy).Estimates <strong>of</strong> reliability. Before testing validity correlationswith our subscales, we compared estimates <strong>of</strong> reliability <strong>of</strong> <strong>the</strong>subscales (shown in Table 3). Although coefficient beta maybe used as an estimate <strong>of</strong> <strong>the</strong> proportion <strong>of</strong> variance in a scaleaccounted for by a general factor, h may actually be a moreaccurate estimate <strong>of</strong> <strong>the</strong> general factor saturation than coefficient
- Page 1 and 2: Psychological Assessment© 2011 Ame
- Page 3 and 4: 506 SCHALET, DURBIN, AND REVELLETab
- Page 5: 508 SCHALET, DURBIN, AND REVELLEite
- Page 9 and 10: 512 SCHALET, DURBIN, AND REVELLETat
- Page 11 and 12: 514 SCHALET, DURBIN, AND REVELLETab
- Page 13 and 14: 516 SCHALET, DURBIN, AND REVELLEp
- Page 15 and 16: 518 SCHALET, DURBIN, AND REVELLESoc
- Page 17 and 18: 520 SCHALET, DURBIN, AND REVELLECli
- Page 19: 522 SCHALET, DURBIN, AND REVELLEApp