Multidimensional Structure of the Hypomanic Personality Scale
Multidimensional Structure of the Hypomanic Personality Scale
Multidimensional Structure of the Hypomanic Personality Scale

You also want an ePaper? Increase the reach of your titles
YUMPU automatically turns print PDFs into web optimized ePapers that Google loves.
Psychological Assessment© 2011 American Psychological Association2011, Vol. 23, No. 2, 504–522 1040-3590/11/$12.00 DOI: 10.1037/a0022301<strong>Multidimensional</strong> <strong>Structure</strong> <strong>of</strong> <strong>the</strong> <strong>Hypomanic</strong> <strong>Personality</strong> <strong>Scale</strong>Benjamin D. Schalet, C. Emily Durbin, and William RevelleNorthwestern UniversityThe structure <strong>of</strong> <strong>the</strong> <strong>Hypomanic</strong> <strong>Personality</strong> <strong>Scale</strong> was explored in a sample <strong>of</strong> young adults (N 884);resulting structures were validated on subsamples with measures <strong>of</strong> personality traits, internalizingsymptoms, and externalizing behaviors. Hierarchical cluster analysis and estimates <strong>of</strong> general factorsaturation suggested <strong>the</strong> presence <strong>of</strong> a weak general factor, as well as 3 subordinate clusters. The 3-clustersubscales (Social Vitality, Mood Volatility, and Excitement) were moderately correlated but conceptuallydistinct and were correlated in opposing patterns with a range <strong>of</strong> personality and psychopathologymeasures. Results show that cluster subscales suppress total score associations with validity measures.Recommendations are made to analyze <strong>Hypomanic</strong> <strong>Personality</strong> <strong>Scale</strong> data by subscale, and <strong>the</strong>oreticalimplications are discussed.Keywords: hypomanic personality, cluster analysis, negative emotionality, positive emotionalityNormal personality dimensions are increasingly acknowledgedto provide an important conceptual framework for identifyinglatent factors underlying <strong>the</strong> structure <strong>of</strong> psychological disorders(Clark, 2005). Unipolar mood disorders (major depressive disorderand dysthymic disorder) have been repeatedly linked in concurrentdesigns to two <strong>of</strong> <strong>the</strong> Big Five (Goldberg, 1993) personality traits:high levels <strong>of</strong> neuroticism/negative emotionality (NE) and, lessconsistently, low levels <strong>of</strong> extraversion/positive emotionality (PE;Clark, Watson, & Mineka, 1994). The developmental literaturesuggests <strong>the</strong>se traits may represent early-emerging precursors orpredispositions for depression (Klein, Durbin, & Shankman,2009). In adults, <strong>the</strong>re is evidence that NE is both a premorbid riskfactor evident before depression onset (e.g., Kendler, Kuhn, &Prescott, 2004; Ormel, Oldehinkel, & Vollebergh, 2004) and amarker <strong>of</strong> improvement in treatment above and beyond symptomchange (Tang et al., 2009).By contrast, research on personality risk factors for bipolardisorder has been less consistent, with some studies demonstratinghigh levels <strong>of</strong> PE in bipolar disorder, some high levels <strong>of</strong> NE, andmany reporting no association for <strong>the</strong>se traits (Klein et al., 2009;Tackett, Quilty, Selbom, Rector, & Bagby, 2008). Individualsthought to be vulnerable for bipolar disorder are described asenergetic, gregarious, and driven to pursue ambitious goals(Akiskal & Akiskal, 2005; Eckblad & Chapman, 1986; Johnson,2005). Their premorbid functioning may be characterized by subthresholdmanifestations <strong>of</strong> mania, such as irritability, moodswings, entitlement, risk taking, and impulsivity (including substanceabuse), and contentious social relationships (Eckblad &This article was published Online First April 11, 2011.Benjamin D. Schalet, C. Emily Durbin, William Revelle, Department <strong>of</strong>Psychology, Northwestern University.We thank Dan McAdams, Josh Wilt, and Sylia Wilson for <strong>the</strong>ir helpfulcomments on this article.Correspondence concerning this article should be addressed to BenjaminD. Schalet, Department <strong>of</strong> Psychology, 2029 Sheridan Avenue, NorthwesternUniversity, Evanston, IL 60208. E-mail: schalet.ben@gmail.comChapman, 1986; Johnson, 2005; Krumm-Merabet & Meyer, 2005;B. Meyer, Rahman, & Shepherd, 2007). These hypo<strong>the</strong>sized precursorsare conceptually linked to several <strong>of</strong> <strong>the</strong> Big Five traits(Neuroticism, Extraversion, Agreeableness, and Conscientiousness)and include behaviors consistent with both internalizing andexternalizing disorders (Kendler, Prescott, Myers, & Neale, 2003;Krueger, 1999; Vollebergh et al., 2001).In an effort to capture <strong>the</strong> personality pr<strong>of</strong>ile that might reflectrisk for bipolar disorder in a single instrument, Eckblad andChapman (1986) created <strong>the</strong> <strong>Hypomanic</strong> <strong>Personality</strong> <strong>Scale</strong> (HPS),a 48-item true–false scale measuring hyperactive, ambitious, andexhibitionistic behaviors as well as feelings <strong>of</strong> euphoria and flights<strong>of</strong> thoughts. Among an original sample <strong>of</strong> 1,519 undergraduates,high scorers on <strong>the</strong> HPS (those in <strong>the</strong> top 3%) were more likely toconcurrently meet criteria for bipolar spectrum disorders than werecontrol participants with average scores (Eckblad & Chapman,1986). These 40 top HPS scorers reported more hypomanic (i.e.,subthreshold mania) and depressive episodes and schizotypicalfeatures. They also reported less interview anxiety, more frictionwith family and friends, higher overall energy, and more artisticinterests than controls, suggesting that <strong>the</strong> HPS identifies a broadpattern <strong>of</strong> personality functioning.A 13-year follow-up <strong>of</strong> <strong>the</strong>se same high-scoring participantsshowed that 75% developed hypomanic or manic episodes(Kwapil et al., 2000). Compared with controls, high scorers hadmore depressive episodes, borderline personality disorder symptoms,psychotic-like experiences, substance and alcohol problems,and a trend toward more arrests. Consistent with <strong>the</strong>se findings, ina separate longitudinal study <strong>of</strong> a large adolescent sample (Klein,Lewinsohn, & Seeley, 1996), elevations on an abbreviated version<strong>of</strong> <strong>the</strong> HPS predicted both internalizing and externalizing problemsabout one year later as well as a broad range <strong>of</strong> measures <strong>of</strong>psychosocial dysfunction. Among participants who had a history<strong>of</strong> mood disorder, high HPS scores predicted a more severe course<strong>of</strong> depression and more suicide attempts.The ability <strong>of</strong> <strong>the</strong> HPS to predict such a broad range <strong>of</strong> mentaldisorders and life-functioning outcomes suggests that this scale islikely multidimensional, tapping several underlying dimensions504
STRUCTURE OF THE HYPOMANIC PERSONALITY SCALE505reflecting aspects <strong>of</strong> both abnormal and normal functioning. If thiswere <strong>the</strong> case, <strong>the</strong>n one would expect <strong>the</strong> HPS to show associationswith multiple personality traits. Only a few studies have examined<strong>the</strong> relationship between <strong>the</strong> HPS and normal personality traits.Two studies have found small to moderate (.25 to .45) zero-ordercorrelations with <strong>the</strong> Big Five traits <strong>of</strong> Extraversion and Opennessto Experience but have found weak or no effects for <strong>the</strong> o<strong>the</strong>r threetraits (Furnham, Batey, Anand, & Manfield, 2008; T. D. Meyer,2002). The lack <strong>of</strong> association with Neuroticism is puzzling, giventhat <strong>the</strong> HPS predicts depressive episodes and severity (Klein etal., 1996; Kwapil et al., 2000). Several studies have focused on <strong>the</strong>role <strong>of</strong> individual differences in self-report measures <strong>of</strong> <strong>the</strong> BehavioralActivation (or Facilitation) System (Carver & White,1994), a broad neurobiological system hypo<strong>the</strong>sized to underliebipolar disorder (Depue & Iacono, 1989). HPS scores have beenfound to be positively associated with at least one BehavioralActivation System subscale (Reward Responsivity; B. Meyer,Johnson, & Carver, 1999; B. Meyer, Johnson, & Winters, 2001).However, Durbin, Schalet, Hayden, Simpson, and Jordan (2009)demonstrated that HPS scores were uniquely predicted by threehigher order traits—Extraversion, Openness, and Conscientiousness—andthat <strong>the</strong>se associations were evident over and aboveself-reported Behavioral Activation System scales.Taken toge<strong>the</strong>r, <strong>the</strong> heterogeneous content <strong>of</strong> <strong>the</strong> HPS items(shown in Table 1), its range <strong>of</strong> psychiatric and normal functioningcorrelates, and evidence that <strong>the</strong> HPS is correlated with three <strong>of</strong> <strong>the</strong>Big Five personality dimensions strongly suggest <strong>the</strong> presence <strong>of</strong>multiple group factors within <strong>the</strong> HPS. For example, <strong>the</strong> HPSpredicts both internalizing problems (such as depressive episodes)and externalizing disorders (e.g., substance abuse), which typicallyform distinct factors (Krueger, 1999; Vollebergh et al., 2001).Thus, it is possible that <strong>the</strong> overall scale score obscures groupfactors that may more cleanly account for <strong>the</strong> divergent correlates<strong>of</strong> <strong>the</strong> HPS. The estimate <strong>of</strong> reliability most commonly reported forstudies using <strong>the</strong> HPS is Cronbach’s alpha; however, althoughalpha indicates <strong>the</strong> extent to which a scale’s total score maycorrelate with some o<strong>the</strong>r measure, it tells us little about <strong>the</strong>unidimensionality versus multidimensionality <strong>of</strong> <strong>the</strong> scale (Revelle& Zinbarg, 2009).To date, efforts to elucidate <strong>the</strong> structure <strong>of</strong> <strong>the</strong> HPS haveincluded only two published structural analyses and one itemresponse <strong>the</strong>ory analysis. In <strong>the</strong>ir original study, Eckblad andChapman (1986) reported briefly on a principal components analysiswith varimax rotation, which yielded 12 components wi<strong>the</strong>igenvalues higher than 1. The first component accounted for14.3% <strong>of</strong> <strong>the</strong> variance and included 15 items (loadings above .3)that mostly measured hypomanic symptoms. The second factor(containing six items with factor loadings above .3) accounted for6.3% <strong>of</strong> <strong>the</strong> variance and seemed to reflect exhibitionism. Littlevariance was explained by each additional factor, leaving <strong>the</strong>structure <strong>of</strong> <strong>the</strong> additional 27 items unresolved. Of note, <strong>the</strong>orthogonal rotation precluded examination <strong>of</strong> whe<strong>the</strong>r <strong>the</strong> underlyingfactors were intercorrelated.Rawlings, Barrantes-Vidal, Claridge, McCreery, and Galanos(2000) analyzed three samples, using maximum-likelihood factoranalysis with promax rotation. The three samples produced somewhatdifferent factor structures; <strong>the</strong>se authors noted in <strong>the</strong>ir discussionthat <strong>the</strong>ir Spanish translation <strong>of</strong> <strong>the</strong> HPS (which was notindependently validated prior to <strong>the</strong> study) may have contributedto unreliable results for one <strong>of</strong> <strong>the</strong> samples. In addition, <strong>the</strong> secondsample, consisting <strong>of</strong> Australian participants, was relatively small(N 158) compared with <strong>the</strong>ir third sample (N 1,073) <strong>of</strong> Britishparticipants. Analyzing <strong>the</strong> British sample, Rawlings et al. foundthat four factors emerged (interpreting <strong>the</strong> Cattel scree plot), accountingfor 33% <strong>of</strong> <strong>the</strong> common variance in <strong>the</strong> HPS; <strong>the</strong> factorscorrelated moderately to weakly with one o<strong>the</strong>r. Rawlings et al.described <strong>the</strong>se factors as Moodiness, Cognitive Elements, Hyper-Sociability, and Ordinariness. Inspecting <strong>the</strong> pattern matrix table<strong>of</strong> <strong>the</strong> largest sample, one finds that <strong>the</strong> first factor clearly includes<strong>the</strong> hyperactivity and mood fluctuations characteristic <strong>of</strong> manicand hypomanic symptoms. The remaining factors are more difficultto interpret. For example, <strong>the</strong> second factor contained a mix <strong>of</strong>cognitive capacity items (“Sometimes ideas and insights come tome so fast that I cannot express <strong>the</strong>m all”) and social potency items(“I have an uncommon ability to persuade and inspire o<strong>the</strong>rs”).The Ordinariness (fourth) factor contained only reverse-codeditems, suggesting that wording polarity likely influenced factorextraction. The first factor dominated <strong>the</strong> scale, with 19 itemsloading higher than .3. The remaining factors had approximatelyeight items, each loading greater than .3; six did not load higherthan .3 on any factor. Given <strong>the</strong> number <strong>of</strong> low loadings, a highlevel <strong>of</strong> uniqueness may be associated with each item. Finally, itshould be noted that nei<strong>the</strong>r Rawlings et al. nor Eckblad andChapman (1986) validated <strong>the</strong> factors against any criterion measures.Finally, Meads and Bentall (2008) applied a Rasch model (oneparameteritem response <strong>the</strong>ory) to a sample <strong>of</strong> 318 students whocompleted <strong>the</strong> HPS. This produced a 20-item unidimensional scaleafter redundancies and misfitted items were eliminated. The 20-item version and <strong>the</strong> original full scale had similar correlationswith symptoms <strong>of</strong> depression, rumination, and reports <strong>of</strong> dangerousactivities. A potential problem with this approach is thatmeaningful group variance may be eliminated when <strong>the</strong> aim is toproduce a single scale with one dimension, ra<strong>the</strong>r than to explicitlymodel <strong>the</strong> empirical structure <strong>of</strong> <strong>the</strong> items.The present study represents an attempt to clarify <strong>the</strong> structure<strong>of</strong> <strong>the</strong> HPS, improving on some <strong>of</strong> <strong>the</strong> analytic procedures <strong>of</strong>previous studies and validating this structure with a range <strong>of</strong>important criterion variables. One challenge to this aim is <strong>the</strong>dichotomous response format <strong>of</strong> <strong>the</strong> HPS. Dichotomous items maybe prone to factor or cluster toge<strong>the</strong>r on <strong>the</strong> basis <strong>of</strong> equal endorsementprobability (Ferguson, 1941; Panter, Swygert, Dahlstrom,& Tanaka, 1997). For example, two items can achieve aperfect correlation only if <strong>the</strong>ir endorsement probabilities are alsoequal. Because items may be endorsed according to thresholds inaddition to content, any analytic procedure that depends on interitemcorrelations may overestimate <strong>the</strong> number <strong>of</strong> factors andunderestimate <strong>the</strong> factor loadings. One improvement is to estimatetetrachoric correlations on <strong>the</strong> basis <strong>of</strong> <strong>the</strong> item intercorrelations(Divgi, 1979; Wherry & Gaylord, 1944).Like factor analysis, hierarchical cluster analysis can be used toexplore <strong>the</strong> structural relationship among items (Bacon, 2001;Revelle, 1979; Tate, 2003; van Abswoude, Vermunt, Hemker, &van der Ark, 2004). One type <strong>of</strong> hierarchical cluster analysis,ICLUST (Revelle, 1979) follows a four-step algorithm in whichestimates <strong>of</strong> reliability form <strong>the</strong> basis for clustering decisions. In<strong>the</strong> first step, <strong>the</strong> two items with <strong>the</strong> highest corrected correlationare combined. As small clusters are matched on <strong>the</strong> basis <strong>of</strong> <strong>the</strong>
506 SCHALET, DURBIN, AND REVELLETable 1Three-Cluster Model <strong>of</strong> <strong>the</strong> <strong>Hypomanic</strong> <strong>Personality</strong> <strong>Scale</strong><strong>Scale</strong> item Social Vitality Mood Volatility Excitement42. I seem to have an uncommon ability to persuade and inspire o<strong>the</strong>rs. 0.69 0.22 0.3040. At social ga<strong>the</strong>rings, I am usually <strong>the</strong> “life <strong>of</strong> <strong>the</strong> party.” 0.67 0.24 0.456. When with groups <strong>of</strong> people, I usually prefer to let someone else be <strong>the</strong> center ... 0.64 0.27 0.4525. When I go to a ga<strong>the</strong>ring where I don’t know anyone, it usually takes me a while ... 0.59 0.09 0.317. In unfamiliar surroundings, I am <strong>of</strong>ten so assertive and sociable that I surprise ... 0.58 0.21 0.3629. I have <strong>of</strong>ten persuaded groups <strong>of</strong> friends to do something really adventurous or crazy. 0.56 0.32 0.4016. I can’t imagine that anyone would ever write a book about my life. 0.55 0.16 0.1726. I think I would make a good actor, because I can play many roles convincingly. 0.55 0.33 0.3339. I am so good at controlling o<strong>the</strong>rs that it sometimes scares me. 0.54 0.28 0.222. It would make me nervous to play <strong>the</strong> clown in front <strong>of</strong> o<strong>the</strong>r people. 0.53 0.14 0.314. I think I would make a good nightclub comedian. 0.53 0.23 0.2534. There are so many fields I could succeed in that it seems a shame to have to pick ... 0.53 0.19 0.181. I consider myself to be pretty much an average kind <strong>of</strong> person. 0.52 0.20 0.1436. I find it easy to get o<strong>the</strong>rs to become sexually interested in me. 0.52 0.14 0.2547. I would ra<strong>the</strong>r be an ordinary success in life than a spectacular failure. 0.49 0.30 0.2330. I would really enjoy being a politician and hitting <strong>the</strong> campaign trail. 0.48 0.06 0.1523. I expect that someday I will succeed in several different pr<strong>of</strong>essions. 0.47 0.18 0.1913. People <strong>of</strong>ten come to me when <strong>the</strong>y need a clever idea. 0.46 0.13 0.1519. I have such a wide range <strong>of</strong> interests that I <strong>of</strong>ten don’t know what to do next. 0.46 0.37 0.3248. A hundred years after I’m dead, my achievements will probably have been forgotten. 0.45 0.11 0.2227. I like to have o<strong>the</strong>rs think <strong>of</strong> me as a normal kind <strong>of</strong> person. 0.44 0.33 0.3014. I am no more self-aware than <strong>the</strong> majority <strong>of</strong> people. 0.31 0.17 0.1644. I frequently get into moods where I feel very speeded-up and irritable. 0.12 0.70 0.3238. I frequently find that my thoughts are racing. 0.31 0.67 0.4021. My moods do not seem to fluctuate any more than most people’s do. 0.23 0.65 0.4120. There have <strong>of</strong>ten been times when I had such an excess <strong>of</strong> energy that I felt little ... 0.26 0.64 0.5137. I seem to be a person whose mood goes up and down easily. 0.02 0.63 0.238. There are <strong>of</strong>ten times when I am so restless that it is impossible for me to sit still. 0.20 0.61 0.4835. I <strong>of</strong>ten get into moods where I feel like many <strong>of</strong> <strong>the</strong> rules <strong>of</strong> life don’t apply to me. 0.39 0.59 0.305. Sometimes ideas and insights come to me so fast that I cannot express <strong>the</strong>m all. 0.35 0.58 0.3531. I can usually slow myself down when I want to. 0.22 0.57 0.3845. I have <strong>of</strong>ten felt happy and irritable at <strong>the</strong> same time. 0.19 0.55 0.2610. When I feel an emotion, I usually feel it with extreme intensity. 0.19 0.55 0.4022. I very frequently get into moods where I wish I could be everywhere and do everything ... 0.40 0.55 0.469. Many people consider me to be amusing but kind <strong>of</strong> eccentric. 0.28 0.54 0.4443. I have <strong>of</strong>ten been so excited about an involving project that I didn’t care about eating ... 0.28 0.53 0.3441. I do most <strong>of</strong> my best work during brief periods <strong>of</strong> intense inspiration. 0.20 0.51 0.2832. I am considered to be kind <strong>of</strong> a “hyper” person. 0.37 0.48 0.8233. I <strong>of</strong>ten get so happy and energetic that I am almost giddy. 0.35 0.46 0.833. I am frequently so “hyper” that my friends kiddingly ask me what drug I’m taking. 0.33 0.54 0.7911. I am frequently in such high spirits that I can’t concentrate on any one thing for too ... 0.33 0.54 0.7946. I <strong>of</strong>ten get into excited moods where it’s almost impossible for me to stop talking. 0.32 0.57 0.6817. I am usually in an average sort <strong>of</strong> mood, not too high and not too low. 0.44 0.42 0.6615. I <strong>of</strong>ten feel excited and happy for no apparent reason. 0.25 0.25 0.6218. I <strong>of</strong>ten have moods where I feel so energetic and optimistic that I feel I could ... 0.52 0.38 0.5912. I sometimes have felt that nothing can happen to me until I do what I am meant to ... 0.25 0.28 0.2124. When I feel very excited and happy, I almost always know <strong>the</strong> reason why. 0.14 0.28 0.3628. I frequently write down <strong>the</strong> thoughts and insights that come to me when I am thinking ... 0.24 0.36 0.20Note. <strong>Structure</strong> matrix <strong>of</strong> cluster loadings. ICLUST analysis was based on tetrachoric correlations. Items 12, 24, and 28 were dropped from <strong>the</strong> clustersprior to calculating cluster loadings. Items with loadings in bold were included in <strong>the</strong> corresponding cluster.highest correlating pairs, <strong>the</strong> combination <strong>of</strong> two subclusters proceedsonly when estimates <strong>of</strong> internal consistency (Cronbach’salpha) and <strong>of</strong> unidimensionality (as measured by Revelle’s beta) <strong>of</strong><strong>the</strong> combined cluster increase according to preselected criteria.Revelle’s beta, <strong>the</strong> worst split-half correlation <strong>of</strong> any given set <strong>of</strong>items, is an estimate <strong>of</strong> <strong>the</strong> unidimensionality (or general factorsaturation) <strong>of</strong> a set <strong>of</strong> intercorrelated items (Zinbarg, Revelle,Yovel, & Li, 2005). Because subclusters are combined only whenbeta increases, <strong>the</strong> general saturation factor is maximized in <strong>the</strong>final solution. This algorithm may prevent <strong>the</strong> pitfall <strong>of</strong> overfactoring,certainly in comparison with push-button factor analysis,applying <strong>the</strong> eigenvalue greater than 1.0 rule (Revelle, 1979). Asecond benefit <strong>of</strong> ICLUST is that <strong>the</strong> hierarchical cluster–subcluster relationships are easily inspected, such that researchersmay select only those cohesive (sub)clusters that are <strong>of</strong> <strong>the</strong>oreticalinterest. By contrast, in traditional factor analysis, <strong>the</strong> relationshipsbetween items across different correlated factors are obscured.Finally, by identifying decreases in beta as individual items areadded to each subcluster, ICLUST may identify items that fitpoorly into <strong>the</strong> scale (see Cooksey & Soutar, 2006).For <strong>the</strong> purposes <strong>of</strong> contrast, we also report on a more traditionalfactor analysis <strong>of</strong> <strong>the</strong> HPS, using ordinary least squares estimation.
STRUCTURE OF THE HYPOMANIC PERSONALITY SCALE507In this analysis, we wished to improve on <strong>the</strong> factor selectionmethods <strong>of</strong> Eckblad and Chapman (1986) and Rawlings et al.(2000). Although Eckblad and Chapman did not specifically note<strong>the</strong> number <strong>of</strong> components in <strong>the</strong>ir brief description, <strong>the</strong>y didreference <strong>the</strong> eigenvalue greater than 1.0 rule (Guttman, 1954;Kaiser, 1960). Rawlings et al. (2000), on <strong>the</strong> o<strong>the</strong>r hand, examined<strong>the</strong> scree plot to select four factors (Cattell, 1966). Both proceduresare imperfect: The eigenvalue rule <strong>of</strong>ten leads to grossly overextractingfactors, and interpreting <strong>the</strong> scree plot is somewhat subjective(Lance, Butts, & Michels, 2006). An improved approachmay be <strong>the</strong> Very Simple <strong>Structure</strong> (VSS) criterion (Revelle &Rocklin, 1979), which operationalizes <strong>the</strong> informal procedure forselecting factors on <strong>the</strong> basis <strong>of</strong> <strong>the</strong> number <strong>of</strong> high loadings perfactor. The VSS criterion indexes how well a simplified loadingsmatrix (with zero loadings replacing low loadings) is able toreproduce <strong>the</strong> original correlation matrix, given a tolerable level <strong>of</strong>complexity (defined by <strong>the</strong> number <strong>of</strong> nonzero loadings per item).A factor solution is <strong>the</strong>n selected to maximize <strong>the</strong> VSS goodness<strong>of</strong> fit index. In <strong>the</strong> present study, we used <strong>the</strong> VSS index to assistin <strong>the</strong> factor number selection.The goals <strong>of</strong> this research were <strong>the</strong>refore threefold. In Study1, our goal was to explore <strong>the</strong> structure <strong>of</strong> <strong>the</strong> HPS, usinghierarchical cluster analysis and factor analysis. Given <strong>the</strong>heterogeneous content <strong>of</strong> <strong>the</strong> HPS and <strong>the</strong> four-factor structurefound by Rawlings et al. (2000), we expected that ICLUST andfactor analysis would produce a multicluster structure. In Study2, our aim was to test <strong>the</strong> criterion validity <strong>of</strong> <strong>the</strong> resultingsubscales. We administered personality and psychopathologyquestionnaires to subsets <strong>of</strong> our larger sample, including measures<strong>of</strong> internalizing (e.g., worry and depression) and externalizingsymptoms (e.g., aggression, drug use, sexual risk taking)and normal and abnormal personality traits. Our final aimwas to use this structure (or structures) to generate testablehypo<strong>the</strong>ses about <strong>the</strong> nature <strong>of</strong> hypomanic personality and, byextension, personality risk for bipolar disorder.Study 1MethodParticipants. The sample consisted <strong>of</strong> 884 undergraduatestudents enrolled in introductory psychology courses at NorthwesternUniversity from 2006 through 2009. Students received coursecredit for participation. Because <strong>of</strong> institutional review board restrictionson maintaining identifying information during some <strong>of</strong><strong>the</strong> data collection period, data on age and gender were availablefor 565 participants. Female participants were somewhat overrepresented(56.9%), and <strong>the</strong> mean participant age was 18.9 (SD 1.02). Data on ethnicity were available for 443 participants. Thesample was somewhat ethnically diverse; participants largely identified<strong>the</strong>mselves as European American/White (60.9%), followedby Asian American (22.9%), biracial (7.2%), Hispanic American(5.4%), and African American/Black (3.6%).Procedure. Most participants (n 818) completed <strong>the</strong> HPSas part <strong>of</strong> a questionnaire packet administered during class. Theremainder did so prior to participating in laboratory tasks designedto measure personality (Durbin et al., 2009).Measure: HPS. The HPS (Eckblad & Chapman, 1986) measuresdispositional hypomanic characteristics, consisting <strong>of</strong> 48true–false items (see Table 1). An example <strong>of</strong> an item is, “Therehave <strong>of</strong>ten been times when I had such an excess <strong>of</strong> energy that Ifelt little need to sleep at night.” The HPS has been shown to havehigh test–retest reliability over 15 weeks (Eckblad & Chapman,1986). In <strong>the</strong> current sample, scores ranged from 0 to 45 (M 17.74, SD 8.36), and <strong>the</strong> internal consistency reliability wasgood (.87, t .88). The mean on <strong>the</strong> HPS in this sample wascomparable with that from o<strong>the</strong>r recent studies using similarlyaged participants (Meads & Bentall, 2008; T. D. Meyer, 2002;Rawlings et al., 2000) but was approximately one half <strong>of</strong> a standarddeviation lower than that reported by Eckblad and Chapman(1986).Data analysis. First, we used <strong>the</strong> dichotomous HPS data tocreate a tetrachoric correlation matrix. We estimated a tetrachoriccorrelation matrix, using <strong>the</strong> hetcor function <strong>of</strong> <strong>the</strong> polycor package(Fox, 2010) available in R (R Core Development Team, 2010).This procedure estimates <strong>the</strong> underlying Pearson correlation if <strong>the</strong>dichotomous data were taken from a bivariate normal distribution;it eliminates <strong>the</strong> effect <strong>of</strong> response frequency and thus corrects for<strong>the</strong> reduction in absolute correlation found in dichotomous correlations.The mean interitem correlation <strong>of</strong> <strong>the</strong> tetrachoric correlationmatrix was .21 (compared with .12 for <strong>the</strong> original matrix).Cluster analysis <strong>of</strong> <strong>the</strong> HPS data set was done with <strong>the</strong> resultingmatrix. Next, we ran ICLUST (psych package; Revelle, 2009),first applying <strong>the</strong> average beta criterion. The two crucial criteriaare as follows: (a) for two clusters <strong>of</strong> three or more items, combineonly if <strong>the</strong> resulting cluster increases alpha past <strong>the</strong> maximum <strong>of</strong><strong>the</strong> two subclusters, and (b) for two clusters <strong>of</strong> four items or more,combine only if <strong>the</strong> resulting cluster increases beta beyond <strong>the</strong>average <strong>of</strong> <strong>the</strong> two. We subsequently explored a second solution byincreasing <strong>the</strong> beta criterion such that <strong>the</strong> beta <strong>of</strong> <strong>the</strong> combinedcluster must be higher than <strong>the</strong> maximum <strong>of</strong> <strong>the</strong> two subclusters.Factor analysis proceeded as follows. The tetrachoric correlationmatrix was factor analyzed with ordinary least squares estimation;<strong>the</strong> VSS (Revelle & Rocklin, 1979) criterion was applied to <strong>the</strong>correlation matrix to determine <strong>the</strong> number <strong>of</strong> factors to extract.VSS is an exploratory procedure that formalizes <strong>the</strong> selection <strong>of</strong><strong>the</strong> number <strong>of</strong> factors by treating low factor loadings as zeroloadings. A VSS index plot allows one to see how well a factorpattern matrix can reproduce <strong>the</strong> actual correlation matrix forsolutions that differ by factor number and complexity (<strong>the</strong> number<strong>of</strong> nonzero loadings per item). To measure <strong>the</strong> similarity between<strong>the</strong> solutions from <strong>the</strong> factoring and clustering methods, we alsocalculated factor-cluster congruence coefficients <strong>of</strong> <strong>the</strong> loadingsmatrices. The congruence coefficient is <strong>the</strong> cosine <strong>of</strong> <strong>the</strong> angle <strong>of</strong><strong>the</strong> two factor loading vectors, taken from <strong>the</strong> origin. Thoughsimilar in form to a correlation coefficient, <strong>the</strong> mean loading is notsubtracted when doing <strong>the</strong> calculations.ResultsHierarchical cluster analysis (ICLUST). We first applied<strong>the</strong> average-beta criterion ICLUST analysis to <strong>the</strong> tetrachoric correlationmatrix. The result was a one-cluster solution (standardized.92, .68), with three identifiable subordinate clusters.When we increased <strong>the</strong> reliability beta criterion (combine only if<strong>the</strong> beta <strong>of</strong> <strong>the</strong> new cluster is higher than ei<strong>the</strong>r subscluster), <strong>the</strong>clustering also stopped at three clusters. These clusters, broadlyspeaking, encompassed items tapping affect and cognition (26
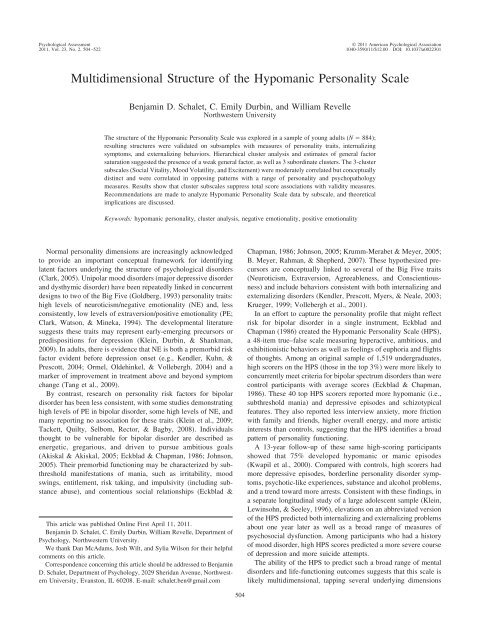
508 SCHALET, DURBIN, AND REVELLEitems), social potency/sociability (13 items), and considering oneselfto be average (9 items).Before we finalized our cluster solution, we inspected <strong>the</strong> graphicaloutput to detect poor fitting items, marked by steep reductionsin beta as items/small subclusters are added to larger subclusters.Four items on <strong>the</strong> affect/cognition cluster (Items 12, 15, 24, and28) resulted in a noticeable drop in beta. Before deciding to deleteany <strong>of</strong> <strong>the</strong>se items, we examined how beta changed with <strong>the</strong>addition <strong>of</strong> each single item to <strong>the</strong> 22-item affect cluster. With<strong>the</strong> addition <strong>of</strong> Items 12, 24, and 28, beta changed from .70 to quitelow levels (.48, .43, and .50, respectively). The addition <strong>of</strong> Item15, however, left beta virtually unchanged at .69. Given that ourprimary purpose was to determine unidimensional clusters, wedropped Item 12 (“I sometimes have felt that nothing can happento me until I do what I am meant to do in life”), Item 24 (“WhenI feel very excited and happy, I almost always know <strong>the</strong> reasonwhy”), and Item 28 (“I frequently write down <strong>the</strong> thoughts andinsights that come to me when I am thinking especially creatively”),but we retained Item 15 to create a 45-item version <strong>of</strong> <strong>the</strong>HPS. Finally, it should be noted that <strong>the</strong> higher beta <strong>of</strong> <strong>the</strong> 45-itemHPS (.66) compared with <strong>the</strong> 48-item HPS (.54) substantiallychanges <strong>the</strong> estimate <strong>of</strong> test variance explained by <strong>the</strong> generalfactor (44% vs. 25%).Applying <strong>the</strong> maximum-beta criterion in ICLUST to <strong>the</strong> 45-itemHPS, a three-cluster solution emerged. Table 1 shows <strong>the</strong> structurematrix <strong>of</strong> this solution and Figure 1 shows <strong>the</strong> hierarchical cluster–subcluster relationships. 1 According to <strong>the</strong> highest loading items,<strong>the</strong> three clusters seemed clearly distinguished by <strong>the</strong>ir content,with <strong>the</strong> first cluster—labeled Mood Volatility (tapping negativeand unpredictable mood states and hypomanic cognition), Excitement(energetic and highly cheerful mood), and Social Vitality(social potency and vivaciousness). The Excitement and MoodVolatility clusters showed <strong>the</strong> highest intercorrelation (r .52,p .05); <strong>the</strong> Social Vitality cluster correlated moderately withboth <strong>the</strong> Excitement (r .42, p .05) and <strong>the</strong> Mood Volatilitycluster (r .35, p .05). 2 All items in <strong>the</strong> clusters were subsequentlyincluded in <strong>the</strong> corresponding subscales, regardless <strong>of</strong> <strong>the</strong>irloading size.Factor analysis. We started our analysis with <strong>the</strong> VSS procedure,using <strong>the</strong> full 48-item tetrachoric correlation matrix. Weapplied VSS with a variety <strong>of</strong> factoring methods (ordinary leastsquares, maximum-likelihood, principal axis, generalized leastsquares) and rotations (promax and oblimin). The VSS indexpeaked most frequently at two-factor solutions at a reasonablelevel <strong>of</strong> complexity (allowing one or two nonzero loadings peritem). Increasing <strong>the</strong> level <strong>of</strong> complexity, <strong>the</strong> VSS index alsopeaked at three factors. We decided to examine <strong>the</strong> two- andthree-factor structures.The eigenvalues <strong>of</strong> <strong>the</strong> first two factors <strong>of</strong> <strong>the</strong> ordinary leastsquares analysis were 11.1 and 4.3, explaining 22% <strong>of</strong> <strong>the</strong> commonvariance. In <strong>the</strong> three-factor solution, <strong>the</strong> eigenvalue <strong>of</strong> <strong>the</strong> thirdfactor was 2.7, with <strong>the</strong> three factors explaining 31% <strong>of</strong> <strong>the</strong>variance. These values contrast with <strong>the</strong> smaller eigenvalues <strong>of</strong>Rawlings et al.’s (2000) largest sample, which were 9.1, 2.7, and2.2; our larger values are likely due to <strong>the</strong> use <strong>of</strong> tetrachoriccorrelations. The second and third factors correlated modestly, r .33, with both factors reflecting emotional content (mood volatilityand excitement). The first factor, reflecting mostly negativelyscored extraversion items, correlated negatively with <strong>the</strong> factorstapping mood volatility (r .32) and excitement (r .17).The pattern matrix is shown in Table 2.To test for similarity among <strong>the</strong> factor and cluster solutions, wecalculated <strong>the</strong> factor–cluster congruence coefficients. This requiredus first to repeat <strong>the</strong> factor analyses on <strong>the</strong> 45-item scales.As shown in Table 2, <strong>the</strong> reduction to 45 items appears justified,given that <strong>the</strong> three items that we eliminated in <strong>the</strong> cluster analyses(Items 12, 24, and 28) also show <strong>the</strong> lowest loadings on any singlefactor as well as <strong>the</strong> lowest communality estimates. First, wecompared <strong>the</strong> two-factor and two-cluster solutions. The twoclustersolution is easily derived from <strong>the</strong> three-cluster solution:Relaxing <strong>the</strong> beta criterion, <strong>the</strong> two emotional clusters (MoodVolatility and Excitement) combine into one, whereas <strong>the</strong> SocialVitality cluster remains intact. Factor–cluster congruence wasnearly perfect for <strong>the</strong> two-group solutions (.99 and .98); consequently,subscales derived from <strong>the</strong> loadings <strong>of</strong> ei<strong>the</strong>r method wereidentical. Factor–cluster congruence for three-group solutions wasalso high (.99, .95, .91), reflecting only a single item (18) thatwould be assigned to a different subscale (to <strong>the</strong> Social Vitalitysubscale instead <strong>of</strong> <strong>the</strong> Excitement subscale) with factor analysis.Given <strong>the</strong> similarity between <strong>the</strong> factor and cluster methods and<strong>the</strong> <strong>the</strong>oretical coherence <strong>of</strong> <strong>the</strong> three-cluster solution, we selected<strong>the</strong> three-cluster solution for fur<strong>the</strong>r reliability and validity analysis.Comparison with <strong>the</strong> factor structure <strong>of</strong> Rawlings et al.(2000). Although Rawlings et al. (2000) reported on factoranalyses <strong>of</strong> three samples, <strong>the</strong>ir British sample was by far <strong>the</strong>largest (N 1,073); accordingly, we compare <strong>the</strong> four-factorpattern matrix <strong>of</strong> <strong>the</strong> British sample to ours. Importing this patternmatrix and repeating <strong>the</strong>ir analytic procedure (maximumlikelihoodfactor analysis, promax rotation, selection <strong>of</strong> four factors)on our dichotomous data, we found that factor congruencebetween <strong>the</strong> results <strong>of</strong> <strong>the</strong> two studies was low (.78, .82, .52, .52).To better understand how <strong>the</strong> results <strong>of</strong> <strong>the</strong> two studies weredifferent, we mapped <strong>the</strong> factor assignments (based on <strong>the</strong> highestloading) onto our cluster solutions. In assigning items to factorsextracted by Rawlings et al., we left out three <strong>of</strong> <strong>the</strong> lowest loadingitems (Items 7, 30, and 39). The first factor (Items 8, 10, 11, 15, 17,1 Figure 1 shows <strong>the</strong> solution for <strong>the</strong> maximum-beta criterion ICLUSTprior to purification, which is slightly discrepant with <strong>the</strong> purified solutionpresented in Table 1. That is, to optimize ICLUST solutions, reshuffling afew items between clusters is sometimes necessary, based on any possiblediscrepant cluster–item correlations. Item 46 (“I <strong>of</strong>ten get into excitedmoods where it’s almost impossible for me to stop talking”) was movedfrom <strong>the</strong> Cluster 40 (Mood Volatility) to Cluster 35 (Excitement), and Item22 (“I very frequently get into moods where I wish I could be everywhereand do everything at once”) was moved from Cluster 42 (Social Vitality)to Cluster 40 (Mood Volatility). Figure 1 also shows that a four-clustersolution is defensible. In this structure, <strong>the</strong> Social Vitality cluster (Cluster42) would be split into a Sociability/Exhibitionism cluster (Cluster 38) anda Surgency/Achievement cluster (Cluster 41). The reliability estimates forCluster 38 were quite high ( .68, h .74, on tetrachoric correlations)but were lower for Cluster 41 ( .58, h .51, on tetrachoric correlations).Space limitations precluded us from describing validity correlationsfor this solution.2 These correlations are based on <strong>the</strong> dichotomous data. Cluster correlationsbased on <strong>the</strong> tetrachoric matrix were slightly higher for each (.61,.49, .39).
STRUCTURE OF THE HYPOMANIC PERSONALITY SCALE50910. extreme intense emotion.8421. moods do not fluctuate37. mood up, down44. speeded up irritable45. happy, irritable8. impossible to sit still46. can't stop talking9. amusing eccentric31. can slow down41. brief inspiration20. no need to sleep43. excited involved35. moods / no rules5. ideas so fast38. thoughts racing-.86.86.71.71-.63.63.71.71.69.69C5= .85C4= .68.78C14= .57.73C3= .68.72C6= .64.91.83.82.84.82C23= .82= .73C20= .67= .65C22= .69= .62C24= .66= .59.84.85.85.75C21= .71= .63N = 4C25= .78= .72N = 6.87.90.74C26= .84= .77N = 10.92C34= .86= .70N = 12.92C40= .88= .69N = 153. friends / hyper32. hyper17. average mood18. outperform anyone15. excited / happy / no reason11. high spirits, can't concentrate33. giddy.93.93.80.80C1= .93.83C7= .78.76.90-.82C15= .80= .75.90.82C27= .81= .68N = 4-.91C28= .82= .69N = 5.91C35= .87= .76N = 726. good actor2. nervous / clown4. good comedian30. politician7. assertive, sociable25. uncomfortable / social6. let o<strong>the</strong>rs / attention40. life <strong>of</strong> party-.75.75-.77.77-.85.85.81C10= .72C12= .75C11= .84.86.87.83C19= .74= .68-.85C29= .77= .69N = 4.68-.90C30= .83= .77N = 6.82.90.74C33= .85= .73N = 9.92C37= .85= .56N = 10.91C38= .87= .68N = 13.89C42= .88= .69N = 2329. group / adventurous / crazy36. sexy13. people clever idea39. control o<strong>the</strong>rs42. persuade o<strong>the</strong>rs22. mood / everywhere / everything23. succeed / several19. range <strong>of</strong> interests34. succeed47. ra<strong>the</strong>r ordinary16. no book about my life48. achievements forgotten14. average self-aware1. average27. normal.66.66.79.79.71.71.69.69.71.71C17= .55.61.85C9= .77.77.80C2= .68.82C8= .64.68C13= .67.85.84.80C32= .71= .58C18= .72= .67C16= .70= .66C36= .61= .47.86.80.78C31= .74= .62N = 4C39= .73= .59N = 6-.76-.82C41= .78= .58N = 10.82Figure 1. ICLUST output using <strong>the</strong> maximum beta criterion. Path coefficients represent reliability-correctedcorrelations. For clusters, alpha was used for <strong>the</strong> correction; for items, item–total correlations were used as anestimate <strong>of</strong> reliability. Note that <strong>the</strong> final purified solution in Table 1 is slightly different from <strong>the</strong> clusteringsolution in <strong>the</strong> figure (see footnote 1). C Cluster.
510 SCHALET, DURBIN, AND REVELLETable 2Three-Factor Model <strong>of</strong> <strong>the</strong> <strong>Hypomanic</strong> <strong>Personality</strong> <strong>Scale</strong><strong>Scale</strong> item Factor 1 Factor 2 Factor 3 h 242. Persuade and inspire o<strong>the</strong>rs 0.67 0.00 0.02 0.4740. Life <strong>of</strong> party 0.59 0.18 0.36 0.5725. Social discomfort 0.56 0.26 0.26 0.4516. No book about my life 0.56 0.16 0.19 0.3136. Can elicit sexual interest 0.53 0.06 0.04 0.2934. Succeed 0.53 0.21 0.21 0.317. Assertive, sociable 0.53 0.07 0.20 0.3730. Politician 0.52 0.02 0.10 0.2539. Good at controlling o<strong>the</strong>rs 0.52 0.17 0.08 0.306. Not center <strong>of</strong> attention 0.51 0.18 0.43 0.5413. Have clever ideas 0.49 0.03 0.08 0.221. Average person 0.47 0.17 0.16 0.2323. Succeed in several domains 0.46 0.24 0.20 0.252. Nervous about playing <strong>the</strong> clown 0.46 0.18 0.27 0.3326. Good actor 0.46 0.14 0.11 0.3029. Have persuaded o<strong>the</strong>rs to be adventurous, crazy 0.45 0.07 0.20 0.334. Good comedian 0.45 0.01 0.12 0.2648. Achievements will be forgotten 0.43 0.09 0.08 0.1947. Ra<strong>the</strong>r be ordinary 0.43 0.27 0.11 0.2518. Feel I can outperform anyone 0.41 0.24 0.15 0.3427. Normal person 0.29 0.24 0.06 0.1938. Thoughts racing 0.09 0.61 0.10 0.4644. Speeded-up and irritable 0.10 0.61 0.12 0.4237. Moods up and down 0.25 0.58 0.14 0.4021. Moods do not fluctuate 0.04 0.56 0.20 0.425. Ideas and insights too fast to express 0.22 0.51 0.00 0.3535. Mood rules don’t apply 0.26 0.48 0.01 0.3420. No need to sleep 0.05 0.46 0.26 0.388. Impossible to sit still 0.08 0.45 0.35 0.4045. Happy and irritable at same time 0.03 0.44 0.09 0.2441. Brief periods <strong>of</strong> inspiration 0.07 0.43 0.04 0.2231. Can slow down 0.03 0.42 0.24 0.3010. Extreme, intense emotion 0.02 0.42 0.24 0.2922. Get into mood to do everything 0.25 0.41 0.15 0.3428. Write down creative thinking 0.18 0.39 0.09 0.1843. Excited about project 0.16 0.39 0.10 0.2419. Range <strong>of</strong> interests 0.33 0.35 0.01 0.279. Amusing, eccentric 0.04 0.32 0.32 0.2832. A hyper person 0.01 0.03 0.85 0.743. Friends say I’m hyper 0.04 0.13 0.79 0.7033. Happy, energetic, giddy 0.07 0.11 0.66 0.5411. High spirits, can’t concentrate 0.07 0.24 0.56 0.5046. Impossible to stop talking 0.04 0.27 0.55 0.4917. Average mood 0.18 0.17 0.46 0.3815. Excited and happy, no reason 0.11 0.02 0.45 0.2524. Excited and happy, I know why 0.00 0.20 0.23 0.1214. No more self-aware 0.28 0.24 0.16 0.1312. Nothing can happen to me 0.22 0.26 0.02 0.13Note. Pattern matrix <strong>of</strong> factor loadings. Ordinary least squares factor analysis was based on tetrachoric correlations. Items 12, 24, and 28 were includedin <strong>the</strong> analysis. Items listed are truncated versions. Items with loadings in bold correspond to items also assigned to <strong>the</strong> corresponding cluster.18, 20, 21, 22, 24, 31, 33, 35, 37, 38, 44, 45, and 46) represents amerging <strong>of</strong> mostly Mood Volatility items (11 out <strong>of</strong> 15) and <strong>the</strong>Excitement items (six out <strong>of</strong> eight). This is consistent with our datato <strong>the</strong> extent that <strong>the</strong>se two clusters are highly correlated andmerge into a single cluster in a two-cluster model. Our SocialVitality cluster, however, is represented by three different factorsin Rawlings et al.’s analysis. Although items reflecting <strong>the</strong> secondfactor (Items 5, 9,12, 13, 19, 23, 26, 28, 34, 36, 41, 42, and 43)were scattered across <strong>the</strong> subclusters <strong>of</strong> Social Vitality, itemsloading high on <strong>the</strong> third factor (Items 2, 3, 4, 6, 25, 29, 32, and 40)reflected exhibitionist tendencies and mostly clustered toge<strong>the</strong>r(six out <strong>of</strong> eight items). Items loading highly on <strong>the</strong> fourth factor(Items 1, 14, 16, 27, 47, and 48) reflected <strong>the</strong> reverse-scored items<strong>of</strong> Ordinariness and entirely cluster toge<strong>the</strong>r before merging into<strong>the</strong> larger Social Vitality cluster (see Figure 1 for <strong>the</strong> location <strong>of</strong><strong>the</strong>se items in <strong>the</strong> cluster hierarchy).Estimates <strong>of</strong> reliability. Before testing validity correlationswith our subscales, we compared estimates <strong>of</strong> reliability <strong>of</strong> <strong>the</strong>subscales (shown in Table 3). Although coefficient beta maybe used as an estimate <strong>of</strong> <strong>the</strong> proportion <strong>of</strong> variance in a scaleaccounted for by a general factor, h may actually be a moreaccurate estimate <strong>of</strong> <strong>the</strong> general factor saturation than coefficient
STRUCTURE OF THE HYPOMANIC PERSONALITY SCALE511Table 3Estimates <strong>of</strong> Reliability for Subscales <strong>of</strong> <strong>the</strong> <strong>Hypomanic</strong> <strong>Personality</strong> <strong>Scale</strong>Common factor varianceGeneral factor variance<strong>Scale</strong> t hAICItemsHPS-48 .93 (.87) .94 (.88) .54 (.62) .47 (.44) .21 (.12) 48HPS-45 .92 (.87) .94 (.88) .66 (.62) .47 (.44) .21 (.13) 45Social Vitality .88 (.79) .90 (.82) .68 (.54) .56 (.48) .25 (.15) 22Mood Volatility .87 (.79) .90 (.81) .69 (.61) .58 (.52) .32 (.19) 15Excitement .88 (.87) .91 (.83) .80 (.68) .67 (.64) .47 (.30) 8R1 (Moodiness) .88 (.81) .91 (.83) .57 (.48) .58 (.58) .31 (.19) 18R2 (Cognitive Elements) .78 (.67) .83 (.71) .59 (.51) .55 (.40) .22 (.14) 13R3 (Hyper-Sociability) .84 (.71) .91 (.81) .62 (.50) .68 (.54) .40 (.25) 8R4 (Ordinariness) .73 (.59) .83 (.68) .59 (.48) .46 (.38) .31 (.19) 6Note. Estimates outside <strong>of</strong> paren<strong>the</strong>ses are based on tetrachoric correlations; estimates in paren<strong>the</strong>ses are calculated from <strong>the</strong> original dichotomous data.AIC average interitem correlation; HPS <strong>Hypomanic</strong> <strong>Personality</strong> <strong>Scale</strong>. HPS-45 excludes Items 12, 24, and 28. Estimates listed for R1, R2, R3, R4are based on subscales derived from <strong>the</strong> highest loading items on each factor reported by Rawlings et al. (2000) in <strong>the</strong>ir largest sample. Three items with<strong>the</strong> lowest loadings (30, 7, and 39) were excluded.beta (Revelle & Zinbarg, 2009; Zinbarg et al., 2005). We <strong>the</strong>reforecalculated h for <strong>the</strong> entire scale and <strong>the</strong> different solutions bysubjecting <strong>the</strong> data to maximum-likelihood exploratory factoranalysis, oblimin rotation, followed by a Schmid–Leiman transformation(Schmid & Leiman, 1957). 3 (See <strong>the</strong> Appendix for <strong>the</strong>general loadings and group factor loadings.) The general factorsaturation estimates ( h and ) were ei<strong>the</strong>r <strong>the</strong> same or higher for<strong>the</strong> three-group solution compared with <strong>the</strong> total scale estimates,and acceptable internal consistency ( t and ) estimates weremaintained. The fact that general factor saturation is low for <strong>the</strong>total scale but tends to increase for each subscale supports <strong>the</strong>hypo<strong>the</strong>sis that <strong>the</strong> HPS is probably best scored with severalsubscales.Although <strong>the</strong> estimates <strong>of</strong> reliability for <strong>the</strong> subscale scoresderived from <strong>the</strong> first three factors reported by Rawlings et al.(2000) were mostly comparable with <strong>the</strong> cluster-based subscales,scores on <strong>the</strong> fourth factor subscale (Ordinariness) appear to beless reliable than scores <strong>of</strong> <strong>the</strong> cluster subscales. Notably, estimates<strong>of</strong> general factor saturation were lower for <strong>the</strong> Ordinariness subscale( .59, h .46) than for <strong>the</strong> larger Social Vitality clusterthat subsumes it ( .68, h .56). This difference is not afunction <strong>of</strong> item number, as <strong>the</strong>se estimates are also relatively lowfor <strong>the</strong> entire 48-item scale ( .54, h .47).Study 2To explore <strong>the</strong> criterion validity <strong>of</strong> <strong>the</strong> HPS clusters, we alsocollected o<strong>the</strong>r questionnaire measures from subsets <strong>of</strong> Study 1participants. The questionnaires covered <strong>the</strong> domains <strong>of</strong> normalpersonality psychopathology and abnormal personality traits, druguse and sexual behavior, and social adjustment. As two <strong>of</strong> <strong>the</strong>inventories we used are based on <strong>the</strong> Big Three <strong>the</strong>ory <strong>of</strong> adaptiveand maladaptive personality traits (Tellegen, 1985; Watson &Clark, 1992), we generated hypo<strong>the</strong>ses accordingly (with <strong>the</strong> understandingthat o<strong>the</strong>r organizations <strong>of</strong> measures may be equallyvalid). For traits related to PE, we hypo<strong>the</strong>sized that <strong>the</strong> SocialVitality and Excitement clusters would correlate positively withPE constructs, whereas <strong>the</strong> Mood Volatility cluster would correlatemore positively with NE and related constructs. We predicted that<strong>the</strong> Social Vitality and Excitement clusters would show differentialcorrelations, such that <strong>the</strong> latter would correlate with measures <strong>of</strong>agreeableness and social closeness, but <strong>the</strong> former would correlatemore strongly with measures <strong>of</strong> social potency and achievement.We anticipated that only <strong>the</strong> Mood Volatility cluster wouldcorrelate with NE constructs. Because some <strong>of</strong> our NE measures(Aggression, Manipulativeness, and Mistrust) represent a moreexternalizing form <strong>of</strong> NE, we hypo<strong>the</strong>sized that <strong>the</strong>y would havesmall associations with Mood Volatility, given that <strong>the</strong> later alsotaps irritability. In four-factor solutions <strong>of</strong> personality trait inventories,<strong>the</strong>se subscales load toge<strong>the</strong>r with Agreeableness on a factorlabeled Disagreeable Disinhibition (Markon, Krueger, & Watson,2005).Given past findings indicating a negative (but small) relationshipbetween <strong>the</strong> HPS and Conscientiousness (Durbin et al., 2009)and a positive relationship between HPS and drug/alcohol use(Krumm-Merabet & Meyer, 2005; Kwapil et al., 2000; B. Meyeret al., 2007), we expected to replicate <strong>the</strong>se associations. Specifically,we anticipated that <strong>the</strong> Social Vitality cluster would correlatenegatively with Constraint constructs. With respect to alcohol andsubstance use, we did not have any a priori hypo<strong>the</strong>ses for differentialassociation with <strong>the</strong> Social Vitality and Mood Volatilityclusters. However, given <strong>the</strong> relatively agreeable and well-adjustedcontent <strong>of</strong> <strong>the</strong> Excitement cluster, we hypo<strong>the</strong>sized that it wouldei<strong>the</strong>r be uncorrelated or negatively correlated with measures <strong>of</strong>drug use and sexual activity.We expected previous findings <strong>of</strong> a positive association betweenOpenness to Experience and <strong>the</strong> HPS (Furnham et al., 2008; T. D.Meyer, 2002) to also emerge in our data. However, given thatitems reflecting creativity, diverse interests, and eccentricity seemto be scattered across <strong>the</strong> HPS clusters, it was not clear whe<strong>the</strong>rmeasures <strong>of</strong> Openness would associate differentially with eachcluster. Never<strong>the</strong>less, to <strong>the</strong> extent that <strong>the</strong> Mood Volatility clustertaps <strong>the</strong> most pathological content, we expected it to associatemore strongly with those Openness constructs linked to personalitypathology, namely, Absorption and Eccentric Perception (Glisky,3 Note that this function is available as omega in <strong>the</strong> psych package(Revelle, 2009) <strong>of</strong> R (R Core Development Team, 2010).
512 SCHALET, DURBIN, AND REVELLETataryn, Tobias, Kihlstrom, & McConkey, 1991; Watson, Clark,& Chmielewski, 2008).As <strong>the</strong>re are findings that individuals scoring high on <strong>the</strong> HPShave more contentious relationships (Eckblad & Chapman, 1986),we expected that poorer social adjustment would be associatedwith one or more HPS clusters. Given <strong>the</strong> items on irritability andintensity <strong>of</strong> emotion in <strong>the</strong> Mood Volatility cluster, we hypo<strong>the</strong>sizedthat Mood Volatility would be positively associated withdifficulty in various social settings (such as school and work),whereas Excitement and Social Vitality would not. We suspectedthat Excitement and Social Vitality would likely be related t<strong>of</strong>ewer problems engaging in leisure activities.MethodParticipants. To explore <strong>the</strong> criterion validity <strong>of</strong> <strong>the</strong> HPSclusters, we also collected o<strong>the</strong>r questionnaire measures fromsubsets <strong>of</strong> Study 1 participants. To reduce burden, each participantcompleted only some <strong>of</strong> <strong>the</strong> measures, resulting in different samplesizes for each set <strong>of</strong> measures. These included normal personality(n 315), psychopathology and abnormal personality traits (n 178), drug use and sexual behavior (n 137), and social adjustment(n 203). Participant characteristics (gender, age, andethnicity) <strong>of</strong> <strong>the</strong> subsamples who completed each <strong>of</strong> <strong>the</strong>se batteriesmirrored those in <strong>the</strong> larger sample. None <strong>of</strong> <strong>the</strong> four subsamplesdiffered significantly from <strong>the</strong> larger sample (N 884) on totalHPS, Mood Volatility, or Excitement scores; however, <strong>the</strong> participantsin <strong>the</strong> subsample measuring psychopathology and abnormalpersonality traits (n 178) scored slightly lower on Social Vitality(Cohen’s d .21) compared with <strong>the</strong> larger sample.Measures.HPS. The HPS (Eckblad & Chapman, 1986) measures dispositionalhypomanic characteristics and consists <strong>of</strong> 48 true–falseitems (see Table 1).Normal personality measures. A subset <strong>of</strong> participants (n 315) also completed <strong>the</strong> Big Five Mini-Markers (Saucier, 1994)and <strong>the</strong> <strong>Multidimensional</strong> <strong>Personality</strong> Questionnaire–Brief Form(MPQ-BF; Patrick, Curtin, & Tellegen, 2002). The Mini-Markerstaps extraversion, neuroticism, openness to experience or intelligence,conscientiousness, and agreeableness. Each trait is measuredby eight adjectives that are rated on a 9-point Likert-typescale. Alphas for Mini-Markers scales in our study ranged from .80to .89 (omega total estimates ranged from .88 to .92). TheMPQ-BF is a 155-item true–false questionnaire that assesses threebroad personality dimensions that roughly correspond with extraversion,neuroticism, and conscientiousness: PE, NE, and Constraint.The higher order dimensions are marked by <strong>the</strong> followinglower order scales: Wellbeing, Social Potency, Achievement, andSocial Closeness (PE); Stress Reaction, Alienation, and Aggression(NE); and Control, Harm Avoidance, and Traditionalism(Constraint). The MPQ-BF also includes a subscale labeled Absorption,which taps <strong>the</strong> tendency for imaginative and selfinvolvedexperiences and is conceptually similar to <strong>the</strong> Big Five Odimension. (The Absorption subscale was administered to a largersubset, n 432.) Alphas for <strong>the</strong> MPQ-BF subscales ranged from.74 to .86 (Mdn .82), and omega total estimates ranged from .77to .88 (Mdn .85).Maladaptive personality. We asked 178 participants to complete<strong>the</strong> Schedule for Nonadaptive and Adaptive <strong>Personality</strong>Self-Description Rating Form (SNAP-SRF; Harlan & Clark,1999), a measure <strong>of</strong> normal and abnormal personality traits relevantto personality disorders. The SNAP-SRF includes 33 paragraphdescriptors describing individuals who are low versus highon <strong>the</strong> characteristic <strong>of</strong> interest; each item is rated on a 6-pointscale. It assesses three higher order dimensions, Negative Temperament,Positive Temperament, and Disinhibition, marked by 15subordinate scales. Each scale contains two or three items, with <strong>the</strong>exception <strong>of</strong> Eccentric Perceptions, which has only one item. Thescales are Mistrust ( .57), Manipulativeness ( .55), Aggression( .40), Self-Harm ( .21), Eccentric Perceptions,Dependency (.34), Exhibitionism (.81), Entitlement (.43), Detachment (.53), Impulsivity (.43), Propriety (.33), Workaholism ( .43), Negative Temperament ( .62),Positive Temperament ( .63), and Disinhibition ( .67).With <strong>the</strong> exception <strong>of</strong> Self-Harm and Dependency, alphas from oursample are similar to those reported by Harlan and Clark (1999).Psychopathology measures. We had 178 participants complete<strong>the</strong> Inventory to Diagnose Depression, a 25-item measure <strong>of</strong>current depression symptoms (Zimmerman, Coryell, Corenthal, &Wilson, 1986). We did not administer <strong>the</strong> suicide item and excludedItems 23 (timing <strong>of</strong> depression symptoms) and 25 (similarityto grief) from analyses. The remaining 22 items had an alpha<strong>of</strong> .79 ( t .82). We had 178 participants complete <strong>the</strong> BeckAnxiety Inventory (Beck, Epstein, Brown, & Steer, 1988), a 21-item measure <strong>of</strong> anxiety symptoms ( .82, t .85), and 100participants completed <strong>the</strong> Penn State Worry Questionnaire (T. J.Meyer, Miller, Metzger, & Borkevec, 1990), a 16-item measure <strong>of</strong>excessive worry ( .94, t .95). Both <strong>the</strong> Penn State WorryQuestionnaire and <strong>the</strong> Inventory to Diagnose Depression items (21out <strong>of</strong> 22) use a 5-point scale <strong>of</strong> severity. The Beck AnxietyInventory uses a 4-point scale for all items.Drug use and sexual activity. To assess behavioral indicators<strong>of</strong> externalizing psychopathology, we administered nine self-reportitems tapping drug use (five items) and risky sexual behavior (fouritems) to 137 participants. The drug questions included <strong>the</strong> following:(a) maximum number <strong>of</strong> drinks participant had consumedin a 24-hr period, (b) lifetime number <strong>of</strong> intoxications, (c) number<strong>of</strong> times <strong>the</strong>y had driven drunk or high, (d) lifetime number <strong>of</strong>times <strong>the</strong>y had used marijuana, and (e) total number <strong>of</strong> differentdrug classes used. Although we also assessed legal problemsinvolving drugs, we eliminated <strong>the</strong> variable from analysis because<strong>of</strong> a low endorsement rate. The sexual behavior questions included<strong>the</strong> following: (a) number <strong>of</strong> lifetime oral sexual partners, (b) totalnumber <strong>of</strong> lifetime vaginal/anal sexual partners, (c) number <strong>of</strong>times participant had unprotected sex, and (d) number <strong>of</strong> timesparticipant had sex while drunk or high. These items are commonmeasures <strong>of</strong> sexual risk taking that have been linked to <strong>the</strong> personalitytrait <strong>of</strong> Constraint (Hoyle, Fejfar, & Miller, 2000). Notsurprisingly, all <strong>of</strong> <strong>the</strong> variables were skewed. Because quantitativedifferences in <strong>the</strong>se answers can be misleading (i.e., <strong>the</strong>difference between 0 and 2 times having unprotected sex is moremeaningful than <strong>the</strong> difference between 40 and 42 times), wegrouped answers for <strong>the</strong> variables (with <strong>the</strong> exception <strong>of</strong> number <strong>of</strong>drug classes used) into four response categories (abstinent, a fewtimes, occasionally, more than occasionally). The resulting ninevariables were moderately intercorrelated (average r .54, range.25–.79, ps .05). The average interitem correlation was slightlyhigher within each content group (r .63 for drug use, r .62 for
STRUCTURE OF THE HYPOMANIC PERSONALITY SCALE513sexual behavior). Hierarchical cluster analysis suggested <strong>the</strong> presence<strong>of</strong> one unidimensional cluster; <strong>the</strong> reliability estimates weregood (standardized .91, .79). The drug and sex variablesclustered toge<strong>the</strong>r separately as expected on <strong>the</strong> basis <strong>of</strong> content,with both showing unidimensionality ( .79, .73, respectively).Therefore, we created drug and sex composites by summing<strong>the</strong> drug and sex items separately. The resulting two compositeswere highly correlated (r .64).Social adjustment. A subset (203 participants) completed ashortened version <strong>of</strong> <strong>the</strong> Social Adjustment Self-Report (SAS-SR;Weissman & Bothwell, 1976), a widely used measure that assessesvarious domains <strong>of</strong> functioning. To tailor this measure to a collegeagedpopulation, we deleted questions on housework, marriage,parenting, and unit functioning. The remaining 32 items includesections on school, family (parents, siblings, extended family),spare time (leisure and social activities), and finances. Studentscompleted <strong>the</strong> Social Adjustment Self-Report questions on paidwork only if <strong>the</strong>y worked 5 hr or more per week (59 studentscompleted <strong>the</strong>se questions). Because four items correlated negativelywith <strong>the</strong>ir respective corrected subscale total, we deletedthose items. Alphas for <strong>the</strong> remaining modified subscales were .59(work, four items), .63 (school, six items), .54 (spare time, 10items), and .66 (family, seven items). Because respondents on <strong>the</strong>full Social Adjustment Self-Report complete only questions thatare relevant to <strong>the</strong>ir particular social roles, internal reliabilityestimates for subsections have not typically been reported (Weissman,1978; Weissman & Bothwell, 1976; Ro & Clark, 2009).Because <strong>of</strong> an error in printing, only 137 participants completed<strong>the</strong> single question on financial difficulty. Intercorrelations among<strong>the</strong> domain subscales were low to moderate, ranging from .05 to.34 (mean r .23, SD .10).Data analysis. Subscales from <strong>the</strong> cluster solution were correlatedwith validity measures. We also regressed <strong>the</strong> clustersubscales on <strong>the</strong> criterion variables to find each subscale’s uniquevariance associated with each criterion variable. We completed allanalyses in R (R Core Development Team, 2010), using <strong>the</strong> psychpackage for most <strong>of</strong> <strong>the</strong> functions (Revelle, 2009).ResultsTo test for criterion validity <strong>of</strong> <strong>the</strong> three-cluster solution, we (a)examined zero-order correlations between subscales and a variety<strong>of</strong> validity measures and (b) regressed <strong>the</strong> three subscales on eachmeasure to examine <strong>the</strong> unique associations <strong>of</strong> each cluster wi<strong>the</strong>ach validity measure. Although unique associations <strong>of</strong> highlycorrelated predictors should be interpreted cautiously (Lynam,Hoyle, & Newman, 2006), we felt justified in doing so, given <strong>the</strong>relative homogeneity and good internal consistency <strong>of</strong> <strong>the</strong> subscales,as well as <strong>the</strong> fact <strong>the</strong>y were only moderately intercorrelated(.35–.51).Table 4 shows descriptive statistics (mean, standard deviation)for item averages for each validity scale and <strong>the</strong>ir correlations andunique associations with each <strong>of</strong> <strong>the</strong> three HPS clusters. To easeinterpretation, we reversed <strong>the</strong> scoring for SNAP-SRF Detachment(higher scores reflect less detachment), Disinhibition, and Impulsivity(higher scores indicate less disinhibited or less impulsivebehaviors). Intercorrelations among NE measures ranged widely(mean r .23, SD .18), from .17 between SNAP-SRFDependency and Aggressiveness to .71 between SNAP-SRF NegativeTemperament and MPQ-BF Stress Reaction. For PE measures,<strong>the</strong> intercorrelations ranged from .06 between SNAP-SRFEntitlement and Detachment to .73 between SNAP-SRF Exhibitionismand Mini-Marker Extraversion (mean r .38, SD .19).For Constraint measures, intercorrelations ranged from .02 betweensexual activity and MPQ-BF Harm avoidance to .75 betweenMPQ-BF Control and reversed SNAP-SRF Impulsivity(mean r .31, SD .20). Measures related to Openness correlatedas follows: Mini-Marker Openness and MPQ-BF Absorptioncorrelated .41. SNAP-SRF Eccentric Perceptions correlated .27with Openness and .31 with Absorption.NE. At <strong>the</strong> zero-order level, Mood Volatility was positivelyrelated to NE scales tapping internalizing tendencies (includingmeasures <strong>of</strong> frank symptoms <strong>of</strong> anxiety and depression) withcoefficients ranging from .29 to .50 (all ps .05). Controlling for<strong>the</strong> shared variance among <strong>the</strong> clusters, <strong>the</strong> unique associations <strong>of</strong>Mood Volatility with internalizing symptoms was strong, with betaweights ranging from .41 to .75 (ps .05). The association <strong>of</strong>Mood Volatility with externalizing NE measures was weaker. Two<strong>of</strong> <strong>the</strong>se measures (SNAP-SRF Manipulativeness, MPQ-BF Aggression)were significantly related to Mood Volatility (r .20,r .24, respectively, ps .05), whereas <strong>the</strong> o<strong>the</strong>rs, SNAP-SRFAggressiveness and Mistrust, were not (r .13, r .14, respectively,ps .05). However, at <strong>the</strong> unique level, all four measureswere positively associated with Mood Volatility, with betas rangingfrom .21 to .31 (p .05). SNAP-SRF Dependency wasunrelated to <strong>the</strong> Mood Volatility cluster (r .00). Consistent withthis finding, Dependency also had no or small correlations with <strong>the</strong>o<strong>the</strong>r internalizing NE measures (mean r .10, SD .09).Consistent with <strong>the</strong> hypo<strong>the</strong>sis that Social Vitality represents ahealthier aspect <strong>of</strong> <strong>the</strong> HPS compared with Mood Volatility, NEmeasures were ei<strong>the</strong>r uncorrelated with Social Vitality or showednegative associations. Significant zero-order negative associationswere found for SNAP-SRF Negative Temperament (r .19,.35, ps .05) and Dependency (r .24, .18, ps .05). Unique negative associations were also found for Mini-Marker Neuroticism, Stress Reaction, Self-Harm, and Penn StateWorry Questionnaire, with beta weights ranging from .19 to.31 (ps .05).Similar to <strong>the</strong> Social Vitality cluster, <strong>the</strong> Excitement cluster wasuncorrelated with NE measures at <strong>the</strong> zero-order level. The exceptionto this pattern was <strong>the</strong> small positive correlation with <strong>the</strong> BeckAnxiety Inventory (r .19, p .05), but this association disappearedat <strong>the</strong> unique level ( .00), suggesting <strong>the</strong> associationwas due to <strong>the</strong> shared variance between Excitement and MoodVolatility. Consistent with our hypo<strong>the</strong>ses, unique negative associationsbetween Excitement and NE were significant for MPQ-BFStress Reaction ( .18, p .05), Mini-Marker Neuroticism( .17, p .05), and <strong>the</strong> Inventory to Diagnose Depression( .19, p .05), as well as SNAP-SRF Aggressiveness ( .17, p .05), Mistrust ( .19, p .05), and MPQ-BFAggression (.21, p .05). Although small, <strong>the</strong>se unique andopposite associations draw a sharp distinction between MoodVolatility and Excitement that is obscured in <strong>the</strong> HPS total scale.A similar contrast is seen for Agreeableness, where <strong>the</strong> uniqueassociation with Excitement is positive ( .27, p .05), but <strong>the</strong>unique association with Mood Volatility is negative ( .24,p .05). The combination <strong>of</strong> internalizing and externalizing NEtraits associated with <strong>the</strong> Mood Volatility cluster is suggestive <strong>of</strong>
514 SCHALET, DURBIN, AND REVELLETable 4Validity Correlations and Unique Associations With Three-Cluster HPS SubscalesHPS-48SocialVitalityMoodVolatilityExcitement<strong>Scale</strong> N M SDr r r r Mult RConstructs related to Negative EmotionalityNeuroticism (MM) 315 4.67 1.22 .07 .08 .19 .29 .45 .00 .17 .38Stress Reaction (MPQ-BF) 313 0.45 0.29 .19 .09 .29 .50 .71 .08 .18 .60Alienation (MPQ-BF) 313 0.18 0.19 .20 .05 .06 .35 .45 .07 .14 .38Aggression (MPQ-BF) 313 0.24 0.23 .11 .09 .06 .20 .28 .03 .21 .26Negative Temperament (SNAP-SRF) 178 3.20 0.99 .03 .19 .35 .32 .57 .00 .18 .50Mistrust (SNAP-SRF) 178 2.68 1.03 .02 .02 .06 .14 .27 .06 .19 .23Manipulativeness (SNAP-SRF) 178 2.57 0.95 .16 .08 .01 .24 .31 .05 .13 .27Aggressiveness (SNAP-SRF) 178 2.64 1.00 .07 .06 .04 .13 .21 .04 .17 .19Self-Harm (SNAP-SRF) 178 1.96 0.83 .11 .12 .30 .32 .46 .12 .02 .43Dependency (SNAP-SRF) 178 3.71 1.06 .13 .24 .30 .00 .07 .00 .08 .27Worry (PSWQ) 100 3.03 0.83 .06 .15 .31 .32 .48 .06 .07 .44Anxiety (BAI) 178 0.40 0.33 .25 .06 .10 .37 .41 .19 .00 .38Depression (IDD) 178 0.48 0.36 .17 .01 .11 .35 .50 .05 .19 .40Constructs related to Positive EmotionalityExtraversion (MM) 315 5.66 1.48 .50 .58 .54 .19 .18 .41 .29 .63Well-Being (MPQ-BF) 313 0.75 0.24 .29 .36 .34 .02 .37 .34 .40 .52Social Potency (MPQ-BF) 313 0.53 0.26 .52 .66 .67 .20 .12 .31 .10 .67Achievement (MPQ-BF) 313 0.63 0.27 .13 .17 .16 .04 .05 .09 .05 .17Social Closeness (MPQ-BF) 313 0.77 0.23 .17 .22 .19 .00 .21 .22 .25 .31Positive Temperament (SNAP-SRF) 178 4.44 0.81 .47 .48 .36 .23 .14 .46 .40 .57Entitlement (SNAP-SRF) 178 3.25 0.96 .26 .38 .42 .11 .02 .07 .09 .38Exhibitionism (SNAP-SRF) 178 3.46 1.17 .53 .62 .59 .26 .08 .35 .16 .64Detachment (SNAP-SRF) a 178 2.85 0.97 .33 .40 .39 .10 .17 .27 .22 .44Constructs related to ConstraintConscientiousness (MM) 315 6.09 1.29 .20 .07 .04 .32 .39 .08 .11 .34Agreeableness (MM) 315 7.01 1.07 .08 .09 .08 .07 .24 .17 .27 .26Control (MPQ-BF) 313 0.71 0.25 .42 .38 .26 .33 .20 .29 .07 .43Harm Avoidance (MPQ-BF) 313 0.58 0.24 .28 .32 .31 .18 .11 .09 .09 .33Traditionalism (MPQ-BF) 313 0.48 0.23 .02 .03 .03 .07 .13 .05 .13 .13Disinhibition (SNAP-SRF) a 178 2.53 1.00 .27 .20 .11 .28 .24 .17 .01 .30Impulsivity (SNAP-SRF) a 178 2.86 1.01 .42 .32 .17 .39 .28 .31 .08 .43Propriety (SNAP-SRF) 178 3.99 1.03 .11 .10 .09 .14 .19 .01 .16 .20Workaholism (SNAP-SRF) 178 3.78 0.98 .04 .04 .08 .03 .02 .11 .15 .13Drugs/Alcohol 137 — — .22 .34 .41 .13 .11 .04 .26 .40Sexual activity 137 — — .20 .30 .36 .14 .13 .05 .27 .37Constructs related to Openness to ExperienceOpenness (MM) 315 6.59 1.08 .41 .43 .40 .23 .06 .22 .03 .44Absorption (MPQ-BF) 432 0.59 0.25 .50 .36 .19 .46 .34 .34 .08 .50Eccentric Perceptions (SNAP-SRF) 178 2.00 1.22 .20 .15 .08 .17 .11 .15 .06 .20Social Adjustment <strong>Scale</strong> Self-ReportPaid Work 59 1.27 0.30 .26 .12 .01 .34 .47 .10 .19 .37Family 203 1.58 0.47 .19 .06 .15 .35 .45 .06 .14 .38School 203 1.92 0.45 .14 .03 .07 .31 .43 .02 .17 .36Spare Time 203 2.21 0.45 .20 .28 .29 .02 .17 .16 .13 .32Finances 137 1.47 0.84 .15 .12 .10 .22 .28 .01 .19 .27Note. Mean scores are mean item scores. Higher scores on <strong>the</strong> Social Adjustment <strong>Scale</strong> Self-Report indicate poor social adjustment. HPS <strong>Hypomanic</strong><strong>Personality</strong> <strong>Scale</strong>; Mult R Multiple R; MM Mini-Markers; MPQ-BF <strong>Multidimensional</strong> <strong>Personality</strong> <strong>Scale</strong>–Brief Form; SNAP-SRF Schedule forNonadaptive and Adaptive <strong>Personality</strong> Self-Reporting Form; PSWQ Penn State Worry Questionnaire; BAI Beck Anxiety Inventory; IDD Inventoryto Diagnose Depression.a <strong>Scale</strong> was reverse coded. p .05, two-tailed.emotional and behavioral patterns seen in borderline personalitydisorder (Clark, 1993; Morey et al., 2003). By contrast, <strong>the</strong> o<strong>the</strong>rtwo HPS clusters (Social Vitality and Excitement) seem to reflec<strong>the</strong>althier emotional patterns.PE. Cluster relationships to PE scales were also largely ashypo<strong>the</strong>sized for both zero-order and unique associations. TheSocial Vitality cluster correlations with PE measures (mean r .43, SD .17) were higher than <strong>the</strong> corresponding correlationsbetween Mood Volatility and PE (mean r .12, SD .10). Ofnote, MPQ-BF Social Potency was more strongly associated withSocial Vitality (r .66, .67, ps .05) than with MoodVolatility (r .20, .12, ps .05), fur<strong>the</strong>r suggesting a close
STRUCTURE OF THE HYPOMANIC PERSONALITY SCALE515kinship between <strong>the</strong> MPQ-BF Social Potency construct and <strong>the</strong>Social Vitality cluster. At <strong>the</strong> unique level, associations betweenPE and Social Vitality and Excitement mostly remain significant(and in <strong>the</strong> same direction), whereas <strong>the</strong> unique associations betweenPE and Mood Volatility tend to become more negative, withcorrelation coefficients generally positive and beta weights negative(mean .15, SD .10). In <strong>the</strong> case <strong>of</strong> MPQ-BF SocialPotency (as well as for Mini-Marker Extraversion), a significantpositive association with Mood Volatility actually becomes significantand negative once <strong>the</strong> shared variance due to <strong>the</strong> o<strong>the</strong>r twoHPS clusters is removed. These findings reveal that <strong>the</strong> negativeassociations between PE and <strong>the</strong> Mood Volatility cluster are suppressedby <strong>the</strong> o<strong>the</strong>r two HPS clusters.In contrast to Mood Volatility, <strong>the</strong> Excitement cluster associateduniquely and positively with Extraversion (r .41, .29, ps .05) and Well-Being (r .34, .40, ps .05). The Excitementcluster also showed unique positive associations with SocialCloseness (r .22, .25, p .05), SNAP-SRF PositiveTemperament (r .46, .40, ps .05), and reversed Detachment(r .27, .22, ps .05). The Excitement cluster was alsodistinguished from <strong>the</strong> Social Vitality cluster in that PE constructswith an element <strong>of</strong> dominance (MPQ-BF Social Potency, MPQ-BFAchievement, SNAP-SRF Entitlement, and SNAP-SRF Exhibitionism)correlated more strongly with Social Vitality (mean r .46, SD .23) than with Excitement (mean r .20, SD .15).Consistent with this, unlike <strong>the</strong> residualized Social Vitality cluster,<strong>the</strong> residualized Excitement cluster was unrelated to <strong>the</strong>se dominantPE traits, with betas ranging from .09 to .16.Given <strong>the</strong> central role that achievement motivation has beenproposed to play in premorbid manic vulnerability (Johnson,2005), it should be noted that MPQ-BF Achievement showed asurprisingly weak relationship with <strong>the</strong> HPS total score and <strong>the</strong>three clusters. This may, in part, be explained by <strong>the</strong> fact that <strong>the</strong>Achievement construct on <strong>the</strong> MPQ-BF is maximally distinct fromSocial Potency. Whereas MPQ-BF Social Potency represents anability and desire to influence o<strong>the</strong>rs and take on leadership orperformance roles, Achievement items describe a tendency towork hard and accomplish much (regardless <strong>of</strong> social visibility).Consistent with this, SNAP-SRF Workaholism was also unrelatedto <strong>the</strong> HPS and <strong>the</strong> clusters. Our results, which are based on ara<strong>the</strong>r broad range <strong>of</strong> PE measures, may be useful in identifyingwhich aspects <strong>of</strong> PE are primarily involved in hypomanic vulnerability.Constraint. In general, questionnaire measures related toConstraint were less strongly related to <strong>the</strong> HPS clusters than were<strong>the</strong> NE and PE measures. Mean correlation coefficients and betaweights suggest that Constraint is more negatively related to MoodVolatility than to Excitement. Excluding <strong>the</strong> drug and sex composites,<strong>the</strong> Constraint measures were most strongly correlatedwith Mood Volatility (mean r .19, SD .14), followed bySocial Vitality (mean r .14, SD .17), and Excitement (meanr .09, SD .15). Fur<strong>the</strong>rmore, residualized Mood Volatilitywas more closely related to Constraint (mean .20, SD .12)than was residualized Social Vitality (mean .09, SD .14)or Excitement (mean .05, SD .13). 4Mini-Marker Conscientiousness stood out as <strong>the</strong> only Constraintmeasure that was significantly and uniquely associated with onlyone HPS cluster, namely, Mood Volatility (r .32, .39,ps .05) and unrelated to <strong>the</strong> o<strong>the</strong>r clusters. This result isconsistent with research showing that, in five-factor models, Conscientiousnesshas a larger (negative) loading on <strong>the</strong> Neuroticismfactor compared with <strong>the</strong> MPQ-BF Constraint scales (Markon etal., 2005). This association between Conscientiousness and Neuroticism(and Mood Volatility) may be due to <strong>the</strong> nature <strong>of</strong> <strong>the</strong>Conscientiousness items, such that being organized implies a level<strong>of</strong> positive psychological adjustment that may be lacking in individualsscoring high on Mood Volatility. The fact that Mini-Marker Conscientiousness was unrelated to both Social Vitalityand Excitement may have been due to <strong>the</strong> fact that Mini-Markeritems such as efficient imply both cautiousness and self-efficacy;<strong>the</strong>se two attributes may relate in opposing directions to bothSocial Vitality and Excitement.Mini-Marker Agreeableness also stood out for <strong>the</strong> divergentpattern <strong>of</strong> its associations with <strong>the</strong> HPS clusters. Agreeablenesswas unrelated to <strong>the</strong> total HPS score (r .08, p .05) and SocialVitality (r .09, .08, ps .05), and showed opposite patterns<strong>of</strong> unique association for Excitement (r .17, .27, ps .05)and Mood Volatility (r .07, p .05; .24, p .05). Theunique associations with Agreeableness (and <strong>the</strong> aggressionscales) for <strong>the</strong> Mood Volatility cluster are also consistent with aborderline personality pr<strong>of</strong>ile (Morey et al., 2003).Drug and sex variables. Unlike <strong>the</strong> o<strong>the</strong>r Constraint measures,<strong>the</strong> sexual activity and drug/alcohol use composites weremost closely related to Social Vitality, ra<strong>the</strong>r than to Mood Volatility.Whereas <strong>the</strong> HPS total score was modestly related to <strong>the</strong>drug and sex composites (r .22 and r .20, respectively, ps .05), <strong>the</strong> HPS clusters differed in <strong>the</strong> magnitude <strong>of</strong> association,such that <strong>the</strong> multiple correlation coefficients were clearly larger(.40 and .37, respectively) than <strong>the</strong> total HPS correlation coefficients.The Social Vitality cluster was most highly related to bothdrug and sex composites (r .34 and r .30, respectively, ps .05), followed by Mood Volatility (r .13 and r .14, respectively,ps .05), and Excitement (r .04 and r .05,respectively, ps .05). The unique association for <strong>the</strong> SocialVitality cluster was significant and positive ( .41 and .36,respectively, ps .05), whereas for Excitement, <strong>the</strong> associationwas significantly negative ( .26 and .27, respectively,ps .05). Mood Volatility was not uniquely related to drug useand sexual activity. These relationships suggest that individualshigh on <strong>the</strong> Social Vitality cluster are most likely to engage insexual risk taking and drug and alcohol use, particularly in comparisonwith those who score high on Excitement.Openness and related constructs. Zero-order correlationsshow that all <strong>of</strong> <strong>the</strong> clusters were significantly related to Openness,though to varying degrees (.22 to .41, ps .05). However, only <strong>the</strong>Social Vitality cluster was uniquely related to Openness ( .40,p .05). This association with Openness may reflect not simply adesire to impact <strong>the</strong> social environment but a desire to do so in awide variety <strong>of</strong> arenas and pr<strong>of</strong>essions (see HPS Items 34, 23, 19,and 26).Zero-order correlations between Absorption (MPQ-BF) and <strong>the</strong>three cluster subscales were all significant and moderate (.34 to.46). Examining unique associations, <strong>the</strong> relationship betweenAbsorption and <strong>the</strong> Excitement cluster reduced to zero ( .08,4 In calculating mean correlation coefficients and beta weights, wereversed <strong>the</strong> direction <strong>of</strong> SNAP-SRF Impulsivity and Disinhibition.
516 SCHALET, DURBIN, AND REVELLEp .05). However, <strong>the</strong> Social Vitality cluster ( .19, p .05)and <strong>the</strong> Mood Volatility cluster ( .34, p .05) were uniquelyassociated with Absorption. Both Absorption and Mood Volatilitymay be more closely related to internalizing pathology than Opennessor <strong>the</strong> o<strong>the</strong>r two HPS clusters. In fact, factor analyses <strong>of</strong>personality traits in large samples show that MPQ-BF Absorptioncross-loads on <strong>the</strong> Neuroticism factor, whereas Big Five Opennessdoes not (Markon et al., 2005).Finally, given <strong>the</strong> pattern with Absorption, we expected <strong>the</strong>Eccentric Perceptions subscale <strong>of</strong> <strong>the</strong> SNAP-SRF to relate moreclosely to <strong>the</strong> Mood Volatility cluster than to <strong>the</strong> o<strong>the</strong>r subscales.Contrary to our expectation, this subscale showed equivalent smallzero-order associations with each cluster (.15 rs .17, ps .05). However, <strong>the</strong> Eccentric Perceptions subscale consisted <strong>of</strong> asingle item and was <strong>the</strong>refore ra<strong>the</strong>r unreliable compared with <strong>the</strong>Absorption and Openness measures. The correlations betweenEccentric Perceptions and Absorption and Openness were likewisesmall but significant (r .24 and r .23, respectively, ps .05).Social adjustment. Consistent with expectation, Mood Volatilitywas associated with poorer social adjustment, whereas <strong>the</strong>o<strong>the</strong>r clusters were ei<strong>the</strong>r unrelated or negatively related with pooradjustment. Specifically, Mood Volatility was significantly associatedwith problematic adjustment in <strong>the</strong> areas <strong>of</strong> work, family,school, and finances (mean r .30, SD .06), whereas SocialVitality (mean r .08, SD .04) and Excitement (mean r .04,SD .05) were unrelated to poor social adjustment in those areas.The unique associations showed a similar pattern: Mood Volatilityshowed significant associations (mean .41, SD .09),whereas Social Vitality (mean .03, SD .11) was unrelatedand Excitement was unrelated or negatively associated (mean .17, SD .02). Mood Volatility was unrelated to leisure timeproblems (r .02) but showed a small positive unique association( .17, p .05), indicating more social problems at <strong>the</strong> uniquelevel. By contrast, both Social Vitality (r .28, .29, ps .05) and Excitement (r .16, p .05; mean .13, p .05)were related to fewer leisure time problems.Summary <strong>of</strong> validity results. HPS subscales derived fromhierarchical cluster analysis (ICLUST) demonstrated considerablecriterion and discriminant validity, especially when considering<strong>the</strong>ir unique associations with measures <strong>of</strong> PE and NE. The MoodVolatility cluster was moderately related to measures <strong>of</strong> internalizingsymptoms and NE. In addition, it was uniquely and positivelyassociated with aggression and negatively related to Agreeableness(also known as <strong>the</strong> Disagreeable Disinhibition factor;Markon et al., 2005). By contrast, <strong>the</strong> Social Vitality cluster wasei<strong>the</strong>r unrelated or negatively related to measures <strong>of</strong> NE.With respect to <strong>the</strong> PE measures, <strong>the</strong> three-cluster solutionprovided a clear picture <strong>of</strong> how group clusters within <strong>the</strong> HPS maydampen <strong>the</strong> total HPS variance available to associate with o<strong>the</strong>rvariables. The Social Vitality cluster was positively related to allmeasures <strong>of</strong> PE, <strong>the</strong> strongest association being with Social Potency.The Mood Volatility cluster was uncorrelated or weaklycorrelated with PE. Residualized Mood Volatility, however,tended to be negatively associated with measures <strong>of</strong> PE, particularlyWell-Being. The Excitement cluster stood in particular contrastto Mood Volatility, showing significant positive associationswith those PE measures that lack a dominance component, both at<strong>the</strong> zero-order and residualized levels.Both <strong>the</strong> Social Vitality and <strong>the</strong> Mood Volatility clusters relatedto measures <strong>of</strong> Constraint, but each cluster related to somewhatcontrasting aspects <strong>of</strong> this trait. The Social Vitality cluster relatednegatively to Harm Avoidance, whereas <strong>the</strong> Mood Volatility clusterseemed to be more broadly related to Constraint. Of particularnote, Mood Volatility was negatively related to Conscientiousness(residualized Mood Volatility was also negatively related toAgreeableness), whereas Social Vitality was unrelated to both. Forindividuals high on Social Vitality, <strong>the</strong>se patterns might reflect amore narrow desire for risk taking, whereas individuals high onMood Volatility might exhibit a more general tendency towarddisorganized and inefficient behavior. This distinction betweenSocial Vitality and Mood Volatility may fur<strong>the</strong>r be seen in <strong>the</strong>irdifferential association with <strong>the</strong> drug use and sexual activity variables.The Social Vitality cluster was uniquely related to drug useand sexual activity (which may be viewed as a particular type <strong>of</strong>risk taking), whereas <strong>the</strong> Mood Volatility was not related to ei<strong>the</strong>r.The Excitement cluster was generally more weakly related toConstraint measures, particularly compared with Mood Volatility.Openness and Absorption showed a different pattern <strong>of</strong> associationwith <strong>the</strong> clusters that seemed to be in proportion to <strong>the</strong> level<strong>of</strong> highly extroverted behaviors reflected in each cluster. That is,<strong>the</strong> Social Vitality cluster was uniquely related to Openness,whereas <strong>the</strong> o<strong>the</strong>r clusters’ smaller associations with Opennesswere reduced to zero when residualized. This relationship mayreflect a tendency on <strong>the</strong> part <strong>of</strong> individuals high on Social Vitalityto be socially potent in a variety <strong>of</strong> diverse (and creative) contexts.We suspect that this link was due to items expressing a range <strong>of</strong>interests and a desire to succeed in a number <strong>of</strong> pr<strong>of</strong>essions.Individuals high on Volatility (who are also less extraverted) mayhave fewer opportunities to engage in a variety <strong>of</strong> social experiences.Finally, individuals high on Excitement may also be lessopen (compared with individuals high on Social Vitality) by virtue<strong>of</strong> <strong>the</strong>ir being less socially potent and exhibitionistic. In contrast toOpenness, <strong>the</strong> more pathological Absorption construct was moderatelyrelated to all clusters.General DiscussionHierarchical cluster analysis (ICLUST) <strong>of</strong> a large student samplerevealed that <strong>the</strong> HPS has a multidimensional structure, consistentwith earlier studies demonstrating it has a wide variety <strong>of</strong>correlates. Fur<strong>the</strong>rmore, estimates <strong>of</strong> reliability for <strong>the</strong> threeclustersubscales were at least as good, if not better, than <strong>the</strong>reliability estimates for <strong>the</strong> total HPS scale. Multiple regressionson validity measures produced multiple Rs <strong>of</strong> larger magnitudethan <strong>the</strong> total scale correlation coefficients in most cases. Thesevalidity measures cover a wide range <strong>of</strong> conceptually importantvariables: normal traits, personality pathology, internalizing symptoms,and externalizing behavior. The findings support <strong>the</strong> claimthat total score HPS correlations with related variables may beattenuated because <strong>of</strong> group factors within <strong>the</strong> HPS.Implications for Future ResearchOn <strong>the</strong> basis <strong>of</strong> <strong>the</strong>se results, we suggest that analyses based onHPS total scores should be interpreted very cautiously. Although<strong>the</strong> HPS subscales we examined were moderately correlated, <strong>the</strong>ynever<strong>the</strong>less contained variance that effectively suppressed total
STRUCTURE OF THE HYPOMANIC PERSONALITY SCALE517scale associations with o<strong>the</strong>r variables. Therefore, conclusionsbased on total score analyses may be unwarranted. For example,on <strong>the</strong> basis <strong>of</strong> modest total HPS correlations with depression(Klein et al., 1996), researchers might conclude that individualsscoring high on <strong>the</strong> HPS exhibit only slight depressive tendencies,leading <strong>the</strong>m to control for differences in depression (Krumm-Merabet & Meyer, 2005). However, zero-order effects for depressivesymptoms are significantly different on Mood Volatility comparedwith Social Vitality and Excitement. Individuals scoringhigh on Mood Volatility may, in fact, be quite vulnerable todepressive episodes, given Mood Volatility’s associations acrossNE measures. By contrast, some high scorers on <strong>the</strong> HPS (thosescoring high only on Social Vitality and Excitement items) mightactually be less likely to develop depression compared with averageHPS scorers.Our findings are important because <strong>of</strong> <strong>the</strong> stark contrast among<strong>the</strong> clusters with respect to overall mental health and measures <strong>of</strong>abnormal (vs. healthy) functioning. The Mood Volatility clusterwas clearly related to a range <strong>of</strong> pathological tendencies, whereas<strong>the</strong> Excitement cluster tends more toward positivity and adaptivefunctioning. On <strong>the</strong> basis <strong>of</strong> <strong>the</strong>se data, it would be inappropriateto characterize individuals scoring high on <strong>the</strong> Excitement clusteras pathologically vulnerable; ra<strong>the</strong>r, this cluster might reflect aspects<strong>of</strong> hypomanic personality that are, in fact, indicative <strong>of</strong>superior functioning. The Social Vitality cluster seemed to representa combination <strong>of</strong> mentally healthy and unhealthy traits. SocialVitality was ei<strong>the</strong>r not related or negatively related to a range <strong>of</strong>NE measures and was positively related to PE measures, includingmore pathological traits, such as Entitlement and Exhibitionism,suggesting a possible link with aspects <strong>of</strong> manic behavior. Itsrelationship with Constraint was not as broad as with MoodVolatility; however, <strong>the</strong> Social Vitality cluster did show moderatecorrelations with sexual activity and drug use.Predicting Risk for Bipolar Disorder From <strong>the</strong> HPSOur results raise a number <strong>of</strong> questions with respect to <strong>the</strong>power <strong>of</strong> <strong>the</strong> HPS to predict bipolar episodes (as well as o<strong>the</strong>rdisorders). The central question is whe<strong>the</strong>r elevations on <strong>the</strong> HPSin any given study reflect elevations only on particular subscales ormore broadly on all items (<strong>the</strong> general factor). It would be importantto know, for example, if only Mood Volatility (but not SocialVitality) can predict <strong>the</strong> development <strong>of</strong> manic episodes. Thiswould be a reasonable hypo<strong>the</strong>sis, given that <strong>the</strong> Mood Volatilityitems <strong>of</strong> racing thoughts, mood swings, and irritability are conceptuallysimilar to several criteria for a manic episode in <strong>the</strong>Diagnostic and Statistical Manual <strong>of</strong> Mental Disorders (4th ed.,text rev.; American Psychiatric Association, 2000).Achievement MotivationAn additional implication <strong>of</strong> this research concerns <strong>the</strong> role thatachievement motivation plays in <strong>the</strong>ories <strong>of</strong> bipolar disorder development(Johnson, 2005). If we are to assume that <strong>the</strong> HPS (andto varying levels <strong>the</strong> clusters <strong>the</strong>rein) are valid predictors <strong>of</strong> bipolardisorder, our results seem inconsistent with <strong>the</strong>ory and clinicalresearch evidence that achievement striving is a central premorbidtrait (Johnson, 2005; Lozano & Johnson, 2001). Achievementitems on <strong>the</strong> MPQ-BF were only weakly related to <strong>the</strong> HPS SocialVitality cluster and HPS total score, especially compared with <strong>the</strong>effects <strong>of</strong> MPQ-BF Social Potency, and SNAP-SRF Exhibitionismand Entitlement. These results are consistent with Eckblad andChapman’s (1986) assessment <strong>of</strong> high scorers on <strong>the</strong> HPS. Theyfound that high scorers were boastful and had high self-esteem buthad no more actual accomplishments than control participants.One alternative explanation, <strong>of</strong> course, is that actual achievementis still central to premorbid characteristics <strong>of</strong> bipolar disorder butthat <strong>the</strong> HPS simply does not capture it very well. It should benoted that our methodological limitations prevent us from concludinganything about <strong>the</strong> relative importance <strong>of</strong> premorbid traitsto <strong>the</strong> future development <strong>of</strong> manic episodes.Links to PsychopathologyMood Volatility was clearly <strong>the</strong> most pathological cluster,showing moderate to large positive effects for internalizing aspects<strong>of</strong> NE, moderate negative effects for Constraint, and modest(unique) effects for Aggression. In addition, it was <strong>the</strong> only clusterto exhibit a negative (unique) effect for Well-Being. Items on thiscluster included having high mental energy, irritability, and moodswings. The cluster bears a close relationship to <strong>the</strong> Big FiveVolatility aspect <strong>of</strong> NE (DeYoung, Quilty, & Peterson, 2007),which includes a tendency toward emotional lability, irritability,and difficulty controlling emotional impulses. This Volatility aspectmay be contrasted with <strong>the</strong> Withdrawal aspect, which representsnegative affect directed inward. In our data, <strong>the</strong> broad relationshipbetween <strong>the</strong> Mood Volatility cluster and Constraintmeasures supports this connection. Fur<strong>the</strong>rmore, few if any <strong>of</strong> <strong>the</strong>Mood Volatility items on <strong>the</strong> HPS may be characterized as reflectingwithdrawal, even though this cluster clearly covaried withwithdrawal symptoms (as represented by <strong>the</strong> Inventory to DiagnoseDepression, <strong>the</strong> Penn State Worry Questionnaire, and <strong>the</strong>Beck Anxiety Inventory) at both <strong>the</strong> zero-order and unique level.DeYoung, Quilty, and Peterson (2007) suggest that Volatility maybe governed by a separate brain system—<strong>the</strong> fight–flight–freezesystem—ra<strong>the</strong>r than Withdrawal, which is linked to <strong>the</strong> behavioralinhibition system (Gray & McNaughton, 2000).The Mood Volatility cluster also bears a close conceptual link to<strong>the</strong> emotional dysregulation that is characteristic <strong>of</strong> borderlinepersonality disorder. We suspect that this cluster <strong>of</strong> items wasprobably responsible for <strong>the</strong> elevations on borderline symptomsfound by Kwapil et al. (2000) in <strong>the</strong>ir longitudinal study <strong>of</strong> HPShigh scorers. Consistent with this hypo<strong>the</strong>sis, a meta-analysis <strong>of</strong>fight–flight–freeze system traits and personality disorders in bothclinical and nonclinical samples shows that borderline personalitydisorder was positively associated with Neuroticism and negativelyassociated with Agreeableness and Conscientiousness,though <strong>the</strong> effects <strong>of</strong> <strong>the</strong> later two were smaller (Saulsman & Page,2004). Similarly, in a study <strong>of</strong> SNAP scales (Clark, 1993) andpersonality disorders, individuals with borderline personality disorderwere distinguished from both depressed and o<strong>the</strong>r personalitydisorder groups by negative temperament, self-harm, and aggression(Morey et al., 2003). Given <strong>the</strong> likely close associationbetween <strong>the</strong> HPS Mood Volatility cluster and borderline personalitydisorder, HPS subscales may assist future research efforts indisentangling comorbidity among borderline personality disorder,depressive episodes, and manic episodes.
518 SCHALET, DURBIN, AND REVELLESocial Vitality was strongly related to a number <strong>of</strong> PE measures(Extraversion, Social Potency, and Exhibitionism). Among <strong>the</strong>se,Exhibitionism stands out as <strong>the</strong> most clearly pathological and isconceptually linked to features <strong>of</strong> histrionic personality disorder.Social Vitality was also positively related with SNAP-SRF PositiveTemperament, Entitlement, and Impulsivity, which is in turnconsistent with Clark’s (1993) SNAP pr<strong>of</strong>ile <strong>of</strong> histrionic personalitydisorder. This histrionic personality disorder–hypomania hypo<strong>the</strong>sisis also consistent with longitudinal research <strong>of</strong> Shahar,Scotti, Rudd, and Joiner (2008), who found that hypomanic symptoms(as assessed by <strong>the</strong> Millon Clinical Multiaxial Inventory;Millon, 1987) predicted increases in histrionic and narcissistic (butnot borderline) features in a suicidal sample. However, SocialVitality differs from histrionic personality disorder with respect toshallowness, which is considered a core feature <strong>of</strong> histrionic personalitydisorder (Blagov, Fowler, & Lilienfeld, 2007). Accordingly,although Social Vitality was robustly related to Openness inour data, histrionic personality disorder is unrelated to Openness(Samuel & Widiger, 2008). Thus, although <strong>the</strong> Social Vitalitycluster may be related to some aspects <strong>of</strong> disordered personality,its links to PE measures suggests it may also tap <strong>the</strong> high end <strong>of</strong>normal agentic Extraversion.Diverging Results for ConstraintThe results with respect to Constraint broadly support <strong>the</strong> hypo<strong>the</strong>sisthat both Social Vitality and Mood Volatility are negativelyrelated to elements <strong>of</strong> Constraint (whereas Excitement isei<strong>the</strong>r positively related or unrelated). However, <strong>the</strong> results show adiverging pattern for <strong>the</strong> clusters—<strong>the</strong> most striking difference isthat Mood Volatility is related to Mini-Marker Conscientiousness(and Social Vitality is not), whereas Social Vitality is related todrug use and sexual activity (and Mood Volatility is not). Consideringthat <strong>the</strong> Social Vitality cluster is also negatively related toHarm Avoidance, <strong>the</strong> difference might be explained by risk-takingversus disorganization components <strong>of</strong> Constraint: Individuals highon Mood Volatility may be disorganized and careless, whereasindividuals high on Social Vitality like to do risky things. Analternative interpretation might be that Mood Volatility is morebroadly related to measures <strong>of</strong> Constraint than Social Vitality,whereas <strong>the</strong> drug use and sexual activity variables in this sampleare too limited in <strong>the</strong> upper range to adequately tap externalizingtendencies. If we were to recast <strong>the</strong> drug use and sexual activityvariables as manifestations <strong>of</strong> experimentation and sensation seeking,<strong>the</strong>ir association with <strong>the</strong> Social Vitality cluster is consistent.Contrast With Factor <strong>Structure</strong> Found by Rawlingset al. (2000)In light <strong>of</strong> our divergent findings with validity measures, it isimportant to consider whe<strong>the</strong>r <strong>the</strong> alternative structure identifiedby Rawlings et al. (2000) would show <strong>the</strong> same pattern <strong>of</strong> associations.As noted earlier, <strong>the</strong> four factors found by Rawlings et al.overlap to varying degrees with our three clusters. Given thatRawlings et al.’s first factor essentially merged our Mood Volatilityand Excitement clusters into one, it is clear that none <strong>of</strong> <strong>the</strong>diverging effects for <strong>the</strong> relatively healthy Excitement clusterwould have been uncovered with this four-factor structure. Never<strong>the</strong>less,we would expect <strong>the</strong> first factor to show <strong>the</strong> samedivergent pattern for NE and PE measures, though perhaps withsmaller differences. Although it is unclear how <strong>the</strong> second factorreported by Rawlings et al. may have differed from <strong>the</strong> largerSocial Vitality cluster, <strong>the</strong> third factor clearly reflects a narrowerexhibitionist tendency, and <strong>the</strong> fourth factor reflects ordinariness(or entitlement) items that form a subcluster within Social Vitality.However, <strong>the</strong> Social Vitality cluster correlated highly with SNAP-SRF Exhibitionism (r .62), so it is unknown whe<strong>the</strong>r Rawlingset al.’s third factor would prove more useful than <strong>the</strong> larger cluster.In addition, given that <strong>the</strong> scores on <strong>the</strong> fourth factor’s subscaleshow lower estimates <strong>of</strong> common factor variance, especially whenmeasured dichotomously, <strong>the</strong> proportion <strong>of</strong> variance available forassociation with ano<strong>the</strong>r measure is smaller. Never<strong>the</strong>less, <strong>the</strong>narrower constructs implied by <strong>the</strong> third and fourth factors fromRawlings et al.’s analysis are <strong>the</strong>oretically cohesive and could beuseful to researchers interested in <strong>the</strong>se constructs.LimitationsSeveral limitations to this study should be noted. One potentiallimitation involves <strong>the</strong> use <strong>of</strong> multiple regression analysis to exploreunique associations <strong>of</strong> subscales. When unique (or residual)associations are quite different from <strong>the</strong> zero-order associations (in<strong>the</strong> case <strong>of</strong> suppression), it is problematic to interpret <strong>the</strong> residualassociation in terms <strong>of</strong> <strong>the</strong> original construct (Lynam et al., 2006;Miller & Chapman, 2001). This is especially problematic when <strong>the</strong>predictors are highly correlated, heterogeneous in content, andhave low internal consistency (ensuring that <strong>the</strong> residual scores aremore unreliable). Under <strong>the</strong>se circumstances, suppressor effectsare difficult to interpret (Lynam et al., 2006) and are <strong>of</strong>ten consideredspurious, even though <strong>the</strong>y do occur in personality psychologyand may reveal important distinctions between relatedconstructs (Paulhus, Robins, Trzesniewski, & Tracy, 2004).We have tried to minimize <strong>the</strong> problems <strong>of</strong> interpreting partialsin <strong>the</strong> present study. First, we have made an effort to ensure <strong>the</strong>conceptual distinctness <strong>of</strong> <strong>the</strong> subscales, as ICLUST maximizesestimates <strong>of</strong> internal consistency (alpha) and <strong>of</strong> homogeneity(beta). Each cluster identified distinct domains <strong>of</strong> social behavior,positive mood, and negative/dsyregulated emotions and cognition.Second, <strong>the</strong> pattern <strong>of</strong> unique associations we found frequentlyshows a larger discrepancy among <strong>the</strong> unique portions <strong>of</strong> <strong>the</strong>variables compared with <strong>the</strong> differences already apparent in <strong>the</strong>zero-order correlations. Admittedly, <strong>the</strong> correlation between Excitementand Mood Volatility in <strong>the</strong> three-cluster solution was high(.51), with internal consistencies that were adequate (.79 for both).In addition, substantial covariance with two o<strong>the</strong>r subscales waspartialled out to calculate unique associations for each cluster. It is<strong>the</strong>refore unclear how representative subscale items can be <strong>of</strong> <strong>the</strong>residual associations. Never<strong>the</strong>less, Excitement items were highlyhomogeneous, suggesting that diverging unique associations wereprobably not due to <strong>the</strong> variance <strong>of</strong> a conceptually distinct subset<strong>of</strong> items. Although we should be cautious about interpreting <strong>the</strong>unique (and small) associations between Excitement and <strong>the</strong> validityvariables not reflected in <strong>the</strong> zero-order associations (e.g.,associations with <strong>the</strong> drugs/sex variables, Agreeableness, and aggressionscales), <strong>the</strong>se associations suggest that some portion <strong>of</strong><strong>the</strong> Excitement cluster corresponds to superior health and socialwell-being, which was already implied by zero-order associationswith Well-Being and Positive Temperament. Given <strong>the</strong> less ho-
STRUCTURE OF THE HYPOMANIC PERSONALITY SCALE519mogeneous nature <strong>of</strong> <strong>the</strong> Mood Volatility/Social Vitality clusters,however, <strong>the</strong> unique associations for <strong>the</strong>se clusters should beinterpreted cautiously in terms <strong>of</strong> original scale content.A second limitation is <strong>the</strong> fact that our data are not longitudinal;<strong>the</strong>refore, we do not know to what extent <strong>the</strong> subscales representpremorbid vulnerability and how <strong>the</strong>y might differentially predictaspects <strong>of</strong> bipolar spectrum disorders. This would be an importantline <strong>of</strong> future research. It is possible that only some clusters arepredictive <strong>of</strong> <strong>the</strong> development <strong>of</strong> psychopathology. Fur<strong>the</strong>rmore,some clusters (such as Excitement) may actually be negativepredictors <strong>of</strong> mental problems generally, and internalizing disordersspecifically.Although some <strong>of</strong> <strong>the</strong> HPS items reflect symptoms <strong>of</strong> mania, <strong>the</strong>bulk <strong>of</strong> its content does not assess frank symptoms <strong>of</strong> bipolardisorder; <strong>the</strong> multidimensional structure <strong>of</strong> <strong>the</strong> HPS and <strong>the</strong> variety<strong>of</strong> its correlates indicate that hypomanic personality is not synonymouswith <strong>the</strong> clinical syndrome <strong>of</strong> hypomania. Thus, ano<strong>the</strong>rlimitation <strong>of</strong> our study is that we did not include o<strong>the</strong>r measures <strong>of</strong>frank manic symptoms. Therefore, we do not know how eachsubscale may be specifically related to or predictive <strong>of</strong> mania.Although it appears from our data that Mood Volatility wouldpredict depressive episodes (and <strong>the</strong> o<strong>the</strong>r clusters would not), <strong>the</strong>relationship between mania and each cluster is unclear. Futureresearch may address <strong>the</strong> following possibilities: (a) Mood Volatilitypredicts depressive episodes, whereas Social Vitality predictsmanic episodes; (b) Mood Volatility predicts both depressive andmanic episodes, whereas Social Vitality predicts only manic episodes;(c) Mood Volatility predicts both types <strong>of</strong> bipolar episodes,but Social Vitality predicts nei<strong>the</strong>r; and (d) Mood Volatility andSocial Vitality predict different aspects <strong>of</strong> mania. We suspect thatExcitement might predict manic episodes at <strong>the</strong> zero-order levelbut that it would not predict mania (and may even be a negativepredictor) once its shared variance with Mood Volatility is removed.Finally, our sample, though large, was drawn from a nonclinicaland relatively well-adjusted and homogeneous population. Although<strong>the</strong> sample size may have resulted in relatively large rangeswith respect to personality variables and internalizing symptoms,<strong>the</strong> variability for externalizing behavior may have been limited.As indicated earlier, compared with a sample drawn from a communityor clinical population, our sample was probably limited to<strong>the</strong> extent that externalizing behavior was socially and physicallydangerous or o<strong>the</strong>rwise dysfunctional.ReferencesAkiskal, K. K., & Akiskal, H. S. (2005). The <strong>the</strong>oretical underpinnings <strong>of</strong>affective temperaments: Implications for evolutionary foundations <strong>of</strong>bipolar disorder and human nature. Journal <strong>of</strong> Affective Disorders, 85,231–239. doi:10.1016/j.jad.2004.08.002American Psychiatric Association. (2000). Diagnostic and statistical manual<strong>of</strong> mental disorders. (4th ed., text rev.). Washington, DC: Author.Bacon, D. (2001). An evaluation <strong>of</strong> cluster analytic approaches to initialmodel specification. Structural Equation Modeling, 8, 397–429. doi:10.1207/S15328007SEM0803_4Beck, A. T., Epstein, N., Brown, G., & Steer, R. A. (1988). An inventoryfor measuring clinical anxiety: Psychometric properties. Journal <strong>of</strong>Consulting and Clinical Psychology, 56, 893–897. doi:10.1037/0022-006X.56.6.893Blagov, P. S., Fowler, K. A., & Lilienfeld, S. O. (2007). Histrionicpersonality disorder. In W. O’Donohue, K. A. Fowler, & S. O. Lilienfeld(Eds.), <strong>Personality</strong> disorders: Toward <strong>the</strong> DSM–V (pp. 203–232). ThousandOaks, CA: Sage.Carver, C. S., & White, T. L. (1994). Behavioral inhibition, behavioralactivation, and affective responses to impending reward and punishment:The BIS/BAS scales. Journal <strong>of</strong> <strong>Personality</strong> and Social Psychology, 67,319–333. doi:10.1037/0022-3514.67.2.319Cattell, R. B. (1966). The scree test for <strong>the</strong> number <strong>of</strong> factors. MultivariateBehavioral Research, 1, 245–276. doi:10.1207/s15327906mbr0102_10Clark, L. A. (1993). Manual for <strong>the</strong> Schedule for Nonadaptive and Adaptive<strong>Personality</strong>. Minneapolis, MN: University <strong>of</strong> Minnesota Press.Clark, L. A. (2005). Temperament as a unifying basis for personality andpsychopathology. Journal <strong>of</strong> Abnormal Psychology, 114, 505–521. doi:10.1037/0021-843X.114.4.505Clark, L. A., Watson, D., & Mineka, S. (1994). Temperament, personality,and <strong>the</strong> mood and anxiety disorders. Journal <strong>of</strong> Abnormal Psychology,103, 103–116. doi:10.1037/0021-843X.103.1.103Cooksey, R. W., & Soutar, G. N. (2006). Coefficient beta and hierarchicalitem clustering: An analytical procedure for establishing and displaying<strong>the</strong> dimensionality and homogeneity <strong>of</strong> summated scales. OrganizationalResearch Methods, 9, 78–98. doi:10.1177/1094428105283939Depue, R. A., & Iacono, W. G. (1989). Neurobehavioral aspects <strong>of</strong> affectivedisorders. Annual Review <strong>of</strong> Psychology, 40, 457–492.DeYoung, C. G., Quilty, L. C., & Peterson, J. B. (2007). Between facetsand domains: 10 aspects <strong>of</strong> <strong>the</strong> Big Five. Journal <strong>of</strong> <strong>Personality</strong> andSocial Psychology, 93, 880–896. doi:10.1037/0022-3514.93.5.880Divgi, D. R. (1979). Calculation <strong>of</strong> <strong>the</strong> tetrachoric correlation coefficient.Psychometrika, 44, 169–172. doi:10.1007/BF02293968Durbin, C. E., Schalet, B. D., Hayden, E. P., Simpson, J., & Jordan, P. L.(2009). <strong>Hypomanic</strong> personality traits: A multi-method exploration <strong>of</strong><strong>the</strong>ir association with normal and abnormal dimensions <strong>of</strong> personality.Journal <strong>of</strong> Research in <strong>Personality</strong>, 43, 898–905. doi:10.1016/j.jrp.2009.04.010Eckblad, M., & Chapman, L. J. (1986). Development and validation <strong>of</strong> ascale for hypomanic personality. Journal <strong>of</strong> Abnormal Psychology, 95,214–222. doi:10.1037/0021-843X.95.3.214Ferguson, G. (1941). The factorial interpretation <strong>of</strong> test difficulty. Psychometrika,6, 323–329. doi:10.1007/BF02288588Fox, J. (2010). polycor: Polychoric and polyserial correlations (R PackageVersion 0.7–8) [Computer s<strong>of</strong>tware]. Retrieved from http://CRAN.Rproject.org/packagepolycorFurnham, A., Batey, M., Anand, K., & Manfield, J. (2008). <strong>Personality</strong>,hypomania, intelligence and creativity. <strong>Personality</strong> and Individual Differences,44, 1060–1069. doi:10.1016/j.paid.2007.10.035Glisky, M. L., Tataryn, D. J., Tobias, B. A., Kihlstrom, J. F., & McConkey,K. M. (1991). Absorption, openness to experience, and hypnotizability.Journal <strong>of</strong> <strong>Personality</strong> and Social Psychology, 60, 263–272. doi:10.1037/0022-3514.60.2.263Goldberg, L. R. (1993). The structure <strong>of</strong> phenotypic personality traits.American Psychologist, 48, 26–34. doi:10.1037/0003-066X.48.1.26Gray, J. A., & McNaughton, N. (2000). The neuropsychology <strong>of</strong> anxiety:An enquiry into <strong>the</strong> functions <strong>of</strong> <strong>the</strong> sept-hippocampal system (2nd ed.).Oxford, England: Oxford University Press.Guttman, L. (1954). Some necessary conditions for common-factor analysis.Psychometrika, 19, 149–161. doi:10.1007/BF02289162Harlan, E., & Clark, L. A. (1999). Short-forms <strong>of</strong> <strong>the</strong> Schedule forNonadaptive and Adaptive <strong>Personality</strong> (SNAP) for self and collateralratings: Development, reliability, and validity. Assessment, 6, 131–145.doi:10.1177/107319119900600203Hoyle, R. H., Fejfar, M. C., & Miller, J. D. (2000). <strong>Personality</strong> and sexualrisk taking: A quantitative review. Journal <strong>of</strong> <strong>Personality</strong>, 68, 1203–1231. doi:10.1111/1467-6494.00132Johnson, S. L. (2005). Mania and dysregulation <strong>of</strong> goal pursuit: A review.
520 SCHALET, DURBIN, AND REVELLEClinical Psychology Review, 25, 241–262. doi:10.1016/j.cpr.2004.11.002Kaiser, H. F. (1960). The application <strong>of</strong> electronic computers to factoranalysis. Educational and Psychological Measurement, 20, 141–151.doi:10.1177/001316446002000116Kendler, K. S., Kuhn, J., & Prescott, C. A. (2004). The interrelationship <strong>of</strong>neuroticism, sex, and stressful life events in <strong>the</strong> prediction <strong>of</strong> episodes <strong>of</strong>major depression. American Journal <strong>of</strong> Psychiatry, 161, 631–636. doi:10.1176/appi.ajp.161.4.631Kendler, K. S., Prescott, C. A., Myers, J., & Neale, M. C. (2003). Thestructure <strong>of</strong> genetic and environmental risk factors for common psychiatricand substance use disorders in men and women. Archives <strong>of</strong>General Psychiatry, 60, 929–937. doi:10.1001/archpsyc.60.9.929Klein, D. N., Durbin, C. E., & Shankman, S. (2009). <strong>Personality</strong> and mooddisorders. In I. H. Gotlib & C. L. Hammen (Eds.), Handbook <strong>of</strong> depression(2nd ed., pp. 93–112). New York, NY: Guilford Press.Klein, D. N., Lewinsohn, P. M., & Seeley, J. R. (1996). <strong>Hypomanic</strong>personality traits in a community sample <strong>of</strong> adolescents. Journal <strong>of</strong>Affective Disorders, 38, 135–143. doi:10.1016/0165-0327(96)00005-5Krueger, R. F. (1999). The structure <strong>of</strong> common mental disorders. Archives<strong>of</strong> General Psychiatry, 56, 921–926. doi:10.1001/archpsyc.56.10.921Krumm-Merabet, C., & Meyer, T. D. (2005). Leisure activities, alcohol,and nicotine consumption in people with a hypomanic/hyperthymictemperament. <strong>Personality</strong> and Individual Differences, 38, 701–712. doi:10.1016/j.paid.2004.05.024Kwapil, T. R., Miller, M. B., Zinser, M. C., Chapman, L. J., Chapman, J.,& Eckblad, M. (2000). A longitudinal study <strong>of</strong> high scorers on <strong>the</strong><strong>Hypomanic</strong> <strong>Personality</strong> <strong>Scale</strong>. Journal <strong>of</strong> Abnormal Psychology, 109,222–226. doi:10.1037/0021-843X.109.2.222Lance, C., Butts, M., & Michels, L. (2006). The sources <strong>of</strong> four commonlyreported cut<strong>of</strong>f criteria: What did <strong>the</strong>y really say? Organizational ResearchMethods, 9, 202–220. doi:10.1177/1094428105284919Lozano, B. E., & Johnson, S. L. (2001). Can personality traits predictincreases in manic and depressive symptoms? Journal <strong>of</strong> AffectiveDisorders, 63, 103–111. doi:10.1016/S0165-0327(00)00191-9Lynam, D. R., Hoyle, R. H., & Newman, J. P. (2006). The perils <strong>of</strong>partialling: Cautionary tales from aggression and psychopathy. Assessment,13, 328–341. doi:10.1177/1073191106290562Markon, K. E., Krueger, R. F., & Watson, D. (2005). Delineating <strong>the</strong>structure <strong>of</strong> normal and abnormal personality: An integrative hierarchicalapproach. Journal <strong>of</strong> <strong>Personality</strong> and Social Psychology, 88, 139–157. doi:10.1037/0022-3514.88.1.139Meads, D. M., & Bentall, R. P. (2008). Rasch analysis and item reduction<strong>of</strong> <strong>the</strong> <strong>Hypomanic</strong> <strong>Personality</strong> <strong>Scale</strong>. <strong>Personality</strong> and Individual Differences,44, 1772–1783. doi:10.1016/j.paid.2008.02.009Meyer, B., Johnson, S. L., & Carver, C. S. (1999). Exploring behavioralactivation and inhibition sensitivities among college students at risk forbipolar-spectrum symptomatology. Journal <strong>of</strong> Psychopathology and BehavioralAssessment, 21, 275–292. doi:10.1023/A:1022119414440Meyer, B., Johnson, S. L., & Winters, R. (2001). Responsiveness to threatand incentive in bipolar disorder: Relations <strong>of</strong> <strong>the</strong> BIS/BAS scales withsymptoms. Journal <strong>of</strong> Psychopathology and Behavioral Assessment, 23,133–143. doi:10.1023/A:1010929402770Meyer, B., Rahman, R., & Shepherd, R. (2007). <strong>Hypomanic</strong> personalityfeatures and addictive tendencies. <strong>Personality</strong> and Individual Differences,42, 801–810. doi:10.1016/j.paid.2006.08.024Meyer, T. D. (2002). The <strong>Hypomanic</strong> <strong>Personality</strong> <strong>Scale</strong>, <strong>the</strong> Big Five, and<strong>the</strong>ir relationship to depression and mania. <strong>Personality</strong> and IndividualDifferences, 32, 649–660. doi:10.1016/S0191-8869(01)00067-8Meyer, T. J., Miller, M. L., Metzger, R. L., & Borkovec, T. D. (1990).Development and validation <strong>of</strong> <strong>the</strong> Penn State Worry Questionnaire.Behaviour Research and Therapy, 28, 487–495. doi:10.1016/0005-7967(90)90135-6Miller, G. A., & Chapman, J. P. (2001). Misunderstanding analysis <strong>of</strong>covariance. Journal <strong>of</strong> Abnormal Psychology, 110, 40–48. doi:10.1037/0021-843X.110.1.40Millon, T. (1987). Millon Clinical Multiaxial Inventory–II, manual(MCMI-II) (2nd ed.). Minneapolis, MN: National Computer Systems.Morey, L. C., Warner, M. B., Shea, M., Gunderson, J. G., Sanislow, C. A.,Grilo, C., . . . McGlashan, T. H. (2003). The representation <strong>of</strong> fourpersonality disorders by <strong>the</strong> Schedule for Nonadaptive and Adaptive<strong>Personality</strong> dimensional model <strong>of</strong> personality. Psychological Assessment,15, 326–332. doi:10.1037/1040-3590.15.3.326Ormel, J., Oldehinkel, A. J., & Vollebergh, W. (2004). Vulnerabilitybefore, during, and after a major depressive episode: A 3-wavepopulation-based study. Archives <strong>of</strong> General Psychiatry, 61, 990–996.doi:10.1001/archpsyc.61.10.990Panter, A. T., Swygert, K. A., Dahlstrom, W. G., & Tanaka, J. S. (1997).Factor analytic approaches to personality item-level data. Journal <strong>of</strong><strong>Personality</strong> Assessment, 68, 561–589. doi:10.1207/s15327752jpa6803_6Patrick, C. J., Curtin, J., & Tellegen, A. (2002). Development and validation<strong>of</strong> a brief form <strong>of</strong> <strong>the</strong> <strong>Multidimensional</strong> <strong>Personality</strong> Questionnaire.Psychological Assessment, 14, 150–163. doi:10.1037/1040-3590.14.2.150Paulhus, D. L., Robins, R. W., Trzesniewski, K. H., & Tracy, J. L. (2004).Two replicable suppressor situations in personality research. MultivariateBehavioral Research, 39, 303–328. doi:10.1207/s15327906mbr3902_7Rawlings, D., Barrantes-Vidal, N., Claridge, G., McCreery, C., & Galanos,G. (2000). A factor analytic study <strong>of</strong> <strong>the</strong> <strong>Hypomanic</strong> <strong>Personality</strong> <strong>Scale</strong> inBritish, Spanish and Australian samples. <strong>Personality</strong> and IndividualDifferences, 28, 73–84. doi:10.1016/S0191-8869(99)00081-1R Core Development Team. (2010). R: A language and environment forstatistical computing [Computer s<strong>of</strong>tware]. Vienna, Austria: R Foundationfor Statistical Computing. Retrieved from http://www.Rproject.org/Revelle, W. (1979). Hierarchical cluster-analysis and <strong>the</strong> internal structure<strong>of</strong> tests. Multivariate Behavioral Research, 14, 57–74. doi:10.1207/s15327906mbr1401_4Revelle, W. (2009). psych: Procedures for personality and psychologicalresearch (R Package Version 1.0-73) [Computer s<strong>of</strong>tware]. Evanston, IL:Northwestern University. Retrieved from http://cran.opensourceresources.org/web/packages/psych/psych.pdfRevelle, W., & Rocklin, T. (1979). Very simple structure: An alternativeprocedure for estimating <strong>the</strong> optimal number <strong>of</strong> interpretable factors.Multivariate Behavioral Research, 14, 403–414.Revelle, W., & Zinbarg, R. E. (2009). Coefficients alpha, beta, omega, and<strong>the</strong> glb: Comments on Sijtsma. Psychometrika, 74, 145–154. doi:10.1007/s11336-008-9102-zRo, E., & Clark, L. (2009). Psychosocial functioning in <strong>the</strong> context <strong>of</strong>diagnosis: Assessment and <strong>the</strong>oretical issues. Psychological Assessment,21, 313–324. doi:10.1037/a0016611Samuel, D. B., & Widiger, T. A. (2008). A meta-analytic review <strong>of</strong> <strong>the</strong>relationships between <strong>the</strong> five-factor model and DSM–IV–TR personalitydisorders: A facet level analysis. Clinical Psychology Review, 28, 1326–1342. doi:10.1016/j.cpr.2008.07.002Saucier, G. (1994). Mini-Markers: A brief version <strong>of</strong> Goldberg’s unipolarBig-Five markers. Journal <strong>of</strong> <strong>Personality</strong> Assessment, 63, 506–516.doi:10.1207/s15327752jpa6303_8Saulsman, L. M., & Page, A. C. (2004). The five-factor model andpersonality disorder empirical literature: A meta-analytic review. ClinicalPsychology Review, 23, 1055–1085. doi:10.1016/j.cpr.2002.09.001Schmid, J. J., & Leiman, J. M. (1957). The development <strong>of</strong> hierarchicalfactor solutions. Psychometrika, 22, 53–61. doi:10.1007/BF02289209Shahar, G., Scotti, M.-A., Rudd, M. D., & Joiner, T. E. (2008). <strong>Hypomanic</strong>symptoms predict an increase in narcissistic and histrionic personalitydisorder features in suicidal young adults. Depression and Anxiety, 25,892–898. doi:10.1002/da.20363
STRUCTURE OF THE HYPOMANIC PERSONALITY SCALE521Tackett, J. L., Quilty, L. C., Selbom, M., Rector, N. A., & Bagby, R. M.(2008). Additional evidence for a quantitative hierarchical model <strong>of</strong>mood and anxiety disorders for DSM–IV: The context <strong>of</strong> personalitystructure. Journal <strong>of</strong> Abnormal Psychology, 117, 812–825. doi:10.1037/a0013795Tang, T. Z., DeRubeis, R., Hollon, S., Amsterdam, J., Shelton, R., &Schalet, B. (2009). <strong>Personality</strong> change during depression treatment: Aplacebo-controlled trial. Archives <strong>of</strong> General Psychiatry, 66, 1322–1330.doi:10.1001/archgenpsychiatry.2009.166Tate, R. (2003). A comparison <strong>of</strong> selected empirical methods for assessing<strong>the</strong> structure <strong>of</strong> responses to test items. Applied Psychological Measurement,27, 159–203. doi:10.1177/0146621603027003001Tellegen, A. (1985). <strong>Structure</strong> <strong>of</strong> mood and personality and <strong>the</strong>ir relevanceto assessing anxiety, with an emphasis on self-report. In A. H. Tuma &J. D. Maser (Eds.), Anxiety and <strong>the</strong> anxiety disorders (pp. 681–706).Hillsdale, NJ: Erlbaum.van Abswoude, A., Vermunt, J., Hemker, B., & van der Ark, L. (2004).Mokken scale analysis using hierarchical clustering procedures. AppliedPsychological Measurement, 28, 332–354. doi:10.1177/0146621604265510Vollebergh, W. A. M., Iedema, J., Bijl, R. V., de Graaf, R., Smit, F., &Ormel, J. (2001). The structure and stability <strong>of</strong> common mental disorders:The NEMESIS study. Archives <strong>of</strong> General Psychiatry, 58, 597–603. doi:10.1001/archpsyc.58.6.597Watson, D., & Clark, L. A. (1992). On traits and temperament: General andspecific factors <strong>of</strong> emotional experience and <strong>the</strong>ir relations to <strong>the</strong> fivefactormodel. Journal <strong>of</strong> <strong>Personality</strong>, 60, 441–476. doi:10.1111/j.1467-6494.1992.tb00980.xWatson, D., Clark, L. A., & Chmielewski, M. (2008). <strong>Structure</strong>s <strong>of</strong> personalityand <strong>the</strong>ir relevance to psychopathology: II. Fur<strong>the</strong>r articulation<strong>of</strong> a comprehensive unified trait structure. Journal <strong>of</strong> <strong>Personality</strong>, 76,1545–1586. doi:10.1111/j.1467-6494.2008.00531.xWeissman, M. M. (1978). Social adjustment by self-report in a communitysample and in psychiatric outpatients. Journal <strong>of</strong> Nervous and MentalDisease, 166, 317–326. doi:10.1097/00005053-197805000-00002Weissman, M. M., & Bothwell, S. (1976). Assessment <strong>of</strong> social adjustmentby patient self-report. Archives <strong>of</strong> General Psychiatry, 33, 1111–1115.Wherry, R. J., & Gaylord, R. H. (1944). Factor pattern <strong>of</strong> test items andtests as a function <strong>of</strong> <strong>the</strong> correlation coefficient: Content, difficulty, andconstant error factors. Psychometrika, 9, 237–244. doi:10.1007/BF02288734Zimmerman, M., Coryell, W., Corenthal, C., & Wilson, S. (1986). Aself-report scale to diagnose major depressive disorder. Archives <strong>of</strong>General Psychiatry, 43, 1076–1081.Zinbarg, R. E., Revelle, W., Yovel, I., & Li, W. (2005). Cronbach’s ,Revelle’s , and Mcdonald’s -sub(H): Their relations with each o<strong>the</strong>rand two alternative conceptualizations <strong>of</strong> reliability. Psychometrika, 70,123–133. doi:10.1007/s11336-003-0974-7(Appendix follows)
522 SCHALET, DURBIN, AND REVELLEAppendixItem Loadings on General and Group Factors Following Schmid–Leiman Transformation<strong>Scale</strong> item g Factor 1 Factor 2 Factor 3 h 232. Hyper person 0.69 0.01 0.03 0.65 0.893. Friends say I’m hyper 0.67 0.10 0.02 0.59 0.8133. Happy, energetic, giddy 0.55 0.14 0.12 0.40 0.5046. Impossible to stop talking 0.53 0.26 0.07 0.33 0.4711. High spirits, can’t concentrate 0.52 0.27 0.12 0.28 0.4417. Average mood 0.48 0.17 0.18 0.28 0.376. Not center <strong>of</strong> attention 0.43 0.12 0.51 0.24 0.528. Impossible to sit still 0.43 0.41 0.07 0.22 0.4020. No need to sleep 0.42 0.41 0.04 0.15 0.3740. Life <strong>of</strong> party 0.41 0.11 0.58 0.18 0.569. Amusing, eccentric 0.40 0.29 0.04 0.20 0.2822. Get into mood to do everything 0.40 0.36 0.21 0.08 0.3421. Moods do not fluctuate 0.39 0.51 0.05 0.12 0.4338. Thoughts racing 0.39 0.54 0.05 0.05 0.4518. Feel I can outperform anyone 0.37 0.23 0.38 0.05 0.3415. Excited happy, no reason 0.35 0.07 0.15 0.23 0.2029. Have persuaded o<strong>the</strong>rs to be adventurous, crazy 0.35 0.10 0.43 0.08 0.3331. Can slow down 0.35 0.39 0.03 0.13 0.2910. Extreme intense emotion 0.34 0.41 0.00 0.09 0.3026. Good actor 0.34 0.13 0.41 0.06 0.305. Ideas and insights too fast to express 0.33 0.45 0.18 0.02 0.347. Assertive, sociable 0.32 0.02 0.51 0.08 0.3744. Speeded-up and irritable 0.32 0.57 0.10 0.03 0.4419. Range <strong>of</strong> interests 0.31 0.28 0.26 0.02 0.2435. Mood rules don’t apply 0.31 0.46 0.23 0.07 0.362. Nervous about playing <strong>the</strong> clown 0.30 0.14 0.44 0.16 0.3343. Excited about project 0.30 0.36 0.14 0.02 0.2442. Persuade and inspire o<strong>the</strong>rs 0.29 0.02 0.62 0.02 0.4745. Happy and irritable at <strong>the</strong> same time 0.29 0.40 0.01 0.05 0.244. Good comedian 0.28 0.01 0.41 0.08 0.2625. Social discomfort 0.28 0.18 0.55 0.11 0.4327. Normal person 0.28 0.20 0.24 0.04 0.1837. Mood up and down 0.26 0.54 0.24 0.06 0.4241. Brief periods <strong>of</strong> inspiration 0.26 0.39 0.05 0.01 0.2224. Excited and happy, know why 0.25 0.20 0.01 0.12 0.1239. Good at controlling o<strong>the</strong>rs 0.23 0.18 0.48 0.10 0.3247. Ra<strong>the</strong>r be ordinary 0.21 0.24 0.36 0.10 0.2412. Nothing can happen to me 0.20 0.23 0.19 0.03 0.1336. Can elicit sexual interest 0.20 0.01 0.51 0.05 0.3028. Write down creative thinking 0.18 0.36 0.14 0.09 0.1934. Succeed 0.18 0.15 0.43 0.11 0.2516. No book about my life 0.17 0.12 0.46 0.11 0.2723. Succeed in several domains 0.17 0.17 0.37 0.10 0.2148. Achievements will be forgotten 0.17 0.06 0.36 0.03 0.171. Average person 0.16 0.13 0.39 0.10 0.2113. Have clever ideas 0.16 0.02 0.43 0.06 0.2230. Politician 0.14 0.02 0.46 0.07 0.2414. No more self-aware 0.12 0.19 0.22 0.09 0.11Note. Maximum-likelihood factor analysis, followed by oblimin rotation and Schmid–Leiman transformation, was basedon <strong>the</strong> tetrachoric correlation matrix. Items 12, 24, and 28 were included in <strong>the</strong> analysis. Items listed are truncated versions.Received October 14, 2009Revision received July 8, 2010Accepted October 22, 2010