Study of Water Distribution Network Using EPANET - ijcer
Study of Water Distribution Network Using EPANET - ijcer
Study of Water Distribution Network Using EPANET - ijcer
- No tags were found...

Create successful ePaper yourself
Turn your PDF publications into a flip-book with our unique Google optimized e-Paper software.
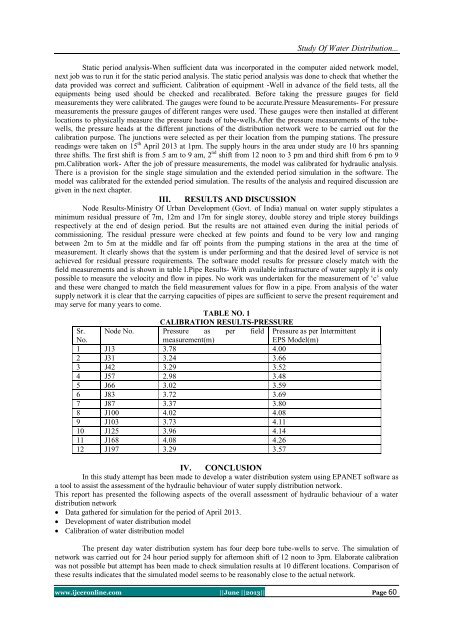
<strong>Study</strong> Of <strong>Water</strong> <strong>Distribution</strong>...Static period analysis-When sufficient data was incorporated in the computer aided network model,next job was to run it for the static period analysis. The static period analysis was done to check that whether thedata provided was correct and sufficient. Calibration <strong>of</strong> equipment -Well in advance <strong>of</strong> the field tests, all theequipments being used should be checked and recalibrated. Before taking the pressure gauges for fieldmeasurements they were calibrated. The gauges were found to be accurate.Pressure Measurements- For pressuremeasurements the pressure gauges <strong>of</strong> different ranges were used. These gauges were then installed at differentlocations to physically measure the pressure heads <strong>of</strong> tube-wells.After the pressure measurements <strong>of</strong> the tubewells,the pressure heads at the different junctions <strong>of</strong> the distribution network were to be carried out for thecalibration purpose. The junctions were selected as per their location from the pumping stations. The pressurereadings were taken on 15 th April 2013 at 1pm. The supply hours in the area under study are 10 hrs spanningthree shifts. The first shift is from 5 am to 9 am, 2 nd shift from 12 noon to 3 pm and third shift from 6 pm to 9pm.Calibration work- After the job <strong>of</strong> pressure measurements, the model was calibrated for hydraulic analysis.There is a provision for the single stage simulation and the extended period simulation in the s<strong>of</strong>tware. Themodel was calibrated for the extended period simulation. The results <strong>of</strong> the analysis and required discussion aregiven in the next chapter.III. RESULTS AND DISCUSSIONNode Results-Ministry Of Urban Development (Govt. <strong>of</strong> India) manual on water supply stipulates aminimum residual pressure <strong>of</strong> 7m, 12m and 17m for single storey, double storey and triple storey buildingsrespectively at the end <strong>of</strong> design period. But the results are not attained even during the initial periods <strong>of</strong>commissioning. The residual pressure were checked at few points and found to be very low and rangingbetween 2m to 5m at the middle and far <strong>of</strong>f points from the pumping stations in the area at the time <strong>of</strong>measurement. It clearly shows that the system is under performing and that the desired level <strong>of</strong> service is notachieved for residual pressure requirements. The s<strong>of</strong>tware model results for pressure closely match with thefield measurements and is shown in table I.Pipe Results- With available infrastructure <strong>of</strong> water supply it is onlypossible to measure the velocity and flow in pipes. No work was undertaken for the measurement <strong>of</strong> „c‟ valueand these were changed to match the field measurement values for flow in a pipe. From analysis <strong>of</strong> the watersupply network it is clear that the carrying capacities <strong>of</strong> pipes are sufficient to serve the present requirement andmay serve for many years to come.TABLE NO. 1CALIBRATION RESULTS-PRESSURESr. Node No. Pressure as per fieldNo.measurement(m)1 J13 3.78 4.002 J31 3.24 3.663 J42 3.29 3.524 J57 2.98 3.485 J66 3.02 3.596 J83 3.72 3.697 J87 3.37 3.808 J100 4.02 4.089 J103 3.73 4.1110 J125 3.96 4.1411 J168 4.08 4.2612 J197 3.29 3.57Pressure as per IntermittentEPS Model(m)IV. CONCLUSIONIn this study attempt has been made to develop a water distribution system using <strong>EPANET</strong> s<strong>of</strong>tware asa tool to assist the assessment <strong>of</strong> the hydraulic behaviour <strong>of</strong> water supply distribution network.This report has presented the following aspects <strong>of</strong> the overall assessment <strong>of</strong> hydraulic behaviour <strong>of</strong> a waterdistribution network Data gathered for simulation for the period <strong>of</strong> April 2013. Development <strong>of</strong> water distribution model Calibration <strong>of</strong> water distribution modelThe present day water distribution system has four deep bore tube-wells to serve. The simulation <strong>of</strong>network was carried out for 24 hour period supply for afternoon shift <strong>of</strong> 12 noon to 3pm. Elaborate calibrationwas not possible but attempt has been made to check simulation results at 10 different locations. Comparison <strong>of</strong>these results indicates that the simulated model seems to be reasonably close to the actual network.www.<strong>ijcer</strong>online.com ||June ||2013|| Page 60