Barclays 2012 CEO Energy/Power Conference - Peabody Energy
Barclays 2012 CEO Energy/Power Conference - Peabody Energy
Barclays 2012 CEO Energy/Power Conference - Peabody Energy
- No tags were found...

Create successful ePaper yourself
Turn your PDF publications into a flip-book with our unique Google optimized e-Paper software.
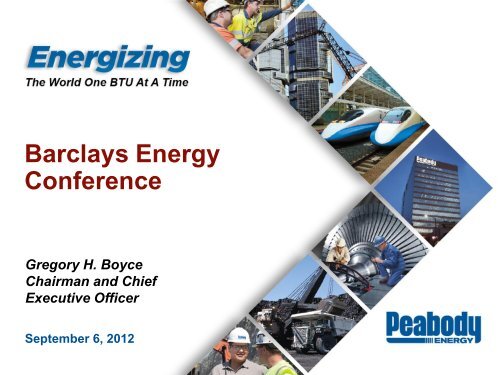
<strong>Barclays</strong> <strong>Energy</strong><strong>Conference</strong>Gregory H. BoyceChairman and ChiefExecutive OfficerSeptember 6, <strong>2012</strong>
<strong>Peabody</strong> Responding toNear-Term Market Conditions● Completing late-stage development projects– Deferring future growth projects until economy strengthens● Reducing <strong>2012</strong> capital to $1.0 billion – $1.1 billion– Capex midpoint $250 million below original <strong>2012</strong> target– Expect 2013 capital at or below <strong>2012</strong> levels● Slowing pace of Australia volume growth● Closing Air Quality Mine in Indiana due tomarket conditions● Aggressively managing cost structure● Focusing on optimizing cash flows and reducing debt4
Global CoalMarkets5
Tonnes in MillionsGlobal Seaborne Demand Increasing,Multiple Countries Growing ImportsMetThermalChina Net Coal ImportsIndia Coal ImportsEurope Coal Imports160+65%80+7%60+17%1407050120601005040804030604020302010201002011YTD<strong>2012</strong>YTD02011YTD<strong>2012</strong>YTD02011YTD<strong>2012</strong>YTDSource: <strong>Peabody</strong> Global Analytics, China customs data, India Coal Market Watch, McCloskey.China net imports through July YTD; India imports through July YTD; Europe imports represent UK, Germany, Spain, France and Turkey through May YTD.6
Annual World Coal Demand Expected toGrow ~1.3 Billion Tonnes in Five Years10,0008,0006,0004,0002,000Expected Global Coal Demand07,6006003,845Source: <strong>Peabody</strong> Global Analytics.(Tonnes in Millions)7,9006404,0903,175 3,140 3,2902011 <strong>2012</strong>P 2016PROW China India8,9008404,795● New coal-fueledgeneration of 390+ GWexpected by 2016● Steel production expectedto grow 20%, requiringadditional 200 MTPY ofmetallurgical coal● More than 85% of globaldemand growth inChina/India● Seaborne demandexpected to grow at8% CAGR8
Kg/CapitaChina, India and Brazil Have LargeUpside to Steel Intensity Potential● Emerging countries drivingmet coal demand throughgreater urbanization andhigher steel consumption● Significant steel increasesrequired to reach levelsof developed Asiaeconomies● Stable stage intensitymay take 20 – 40 yearsto reach● Greater imports requiredto meet met coal needsSource: <strong>Peabody</strong> Global Analytics.1,4001,2001,0002011 Steel Consumption Per Capita8006004002000~1.2 Billion Tonnes ofMet Coal Required toReach Stable StageSteel Intensity of900 Kg/Capita59India1734668519241,402Brazil China Japan Taiwan Korea9
China Demand Expected to Grow~1.0 Billion Tonnes by 2016Tonnes in MillionsImports Expected to Double From 2011 to 2016● 240 GW of coal-fueledgeneration expected tocome on line by 2016– Much of buildout occurring incoastal areas– Represents >800 MTPY ofthermal coal use over time● China NDRC seeks cokingcoal production limits for“special and scarce”resource● China reducing domesticproduction; continuing toclose small inefficient mines5004504003503002502001501005003734China Gross Coal ImportsMet32008Thermal1253590200918647139201022345178201129055235<strong>2012</strong>P400 - 450100-110300-3502016PSource: <strong>Peabody</strong> Global Analytics, China National Bureau of Statistics. 2008, 2009 imports exclude „other lignite‟ product, now reported in total import figures.Projections assume 7.5% China GDP growth, as outlined in 12 th Five-Year Plan.10
Tonnes in MillionsIndia Likely to be World’s FastestGrowing Coal Importer● 70 GW of new coal generationexpected to start over five years– Requires additional ~250 MTPYof thermal coal use over time● Thermal demand expected tooutpace production by>150 MTPY within five years– Coal India ordered to increasecoal imports to meet shortfalls● Blackouts highlight need forincreased coal imports andimproved power grid● Multiple new port projects underway to enable increased imports200150100500India Coal Imports7443MetThermal1006331 371188813010030 30200 - 220150-16050-602009 2010 2011 <strong>2012</strong>P 2016PSource: <strong>Peabody</strong> Global Analytics and other industry sources.11
Global Seaborne Supply: Australia andIndonesia Expected to Lead Growth2011 Total Exports2011-2016Growth2016ExportsIndonesia319130 – 160450 – 480AustraliaMetallurgical Thermal 281140 – 160420 – 440U.S.9330 – 50120 – 140Russia8815 – 25105 – 115Colombia7735 – 45110 – 120South Africa6710 – 1575 – 80CanadaMongolia2433Total 2011 Exports:1,040 Million Tonnes0 – 535 – 5035 – 4060 – 75China14(15 – 5)0 – 10Other440 50 100 150 200 250 300 3505 – 10 50 – 55385 – 5151,425 – 1,555Source: <strong>Peabody</strong> Global Analytics; McCloskey and Wood Mackenzie.Data shown in million tonnes. Excludes land-based exports, except Mongolia.12
Australia Coal: Multiple AdvantagesOver Other Regions● Supplies 60% of world‟s seaborne metallurgical coal● Major competitive advantage with mines close toport; Ports close to high-growth markets● Largest exporter of high-CV thermal coal● <strong>Peabody</strong>‟s Australian marginsgreater than averageU.S. peer margins● Australian coal assets earnvaluations significantlyhigher thanU.S. counterparts13
U.S. Markets: Rising Gas Prices andStrong Burn Driving Recovery● Natural gas priceoutlook favorablefor PRB and ILB● U.S. summerstockpile declinegreater thanaverage– Coal inventorieslowest for PRBgenerators● Expect rebound in2013 coal use$5$4$3$2U.S. NaturalGas Prices($/mmBtu)FuturesILB CompetitivePRB Competitive-12$1-162011 <strong>2012</strong> 2013 2014 2015 2016 201712840-4-8U.S. MonthlyInventory Change(Tons in Millions)7-6-25699710-Year Average<strong>2012</strong>5-1-3-4-10-12Jan Feb Mar Apr May Jun JulSource: Pricing per Bloomberg, CME Group; prices quoted as of 8/29/12. Inventory data per EIA, <strong>Peabody</strong> Global Analytics.14
U.S. Coal Plant Retirements LargelyOffset by New Plants, Capacity UtilizationGW of Coal Capacity & Related Coal BurnExpected to Retire 2011 – 2016Cumulative Generation Changes(Tons in Millions)1 GW3 MT2 GW3 MT3 GW8 MT2 GW5 MT5 GW9 MT10 GW11 MT11 GW13 MT5 GW5 MT1 GW1 MTNew GenerationSPRB/ILB 30Other 10Total 40RetirementsSPRB/ILB (25)Other (35)Total (60)Capacity Utilization & SwitchingSPRB/ILB 45Other (45)Total -Demand ChangesSPRB/ILB 50Other (70)Total (20)Majority of 40 GW of Expected Retirements in Eastern U.S.Source: <strong>Peabody</strong> Global Analytics and Ventyx. 15
Significant Demand Shift TowardPRB and Illinois BasinPRB advantage● Low end of cost curve● Primary source for new plants● Benefits from basin switching● Asian export potentialILBExpected U.S. ProductionChange 2011 – 2016(Tons in Millions)Illinois Basin advantage● Major source for new plants● Benefits from new scrubbersand basin switching● Transport advantage to GulfCAPP● Challenged to compete withnatural gas generation andPRB/Illinois BasinSource: <strong>Peabody</strong> Global Analytics and industry reports.SPRBCOOtherCAPP-80 -60 -40 -20 0 20 4016
Million Tonnes of Oil Equivalent200920202035Coal: The World’s FastestGrowing Major Fuel60%50%56%Growth 2001 – 2011 Growth to 20355,0004,00040%30%35%31%3,00020%10%13%2,0001,0000%Coal Hydro NaturalGasOil0%NuclearLargest Share of Global <strong>Energy</strong> Since 19690Coal Oil N. Gas Nuclear Hydro OtherCoal Expected to Pass Oil by 2035Source: BP Statistical Review of World <strong>Energy</strong> <strong>2012</strong>; International <strong>Energy</strong> Agency, World <strong>Energy</strong> Outlook 2011 „Current Policies‟ scenario. 17
<strong>Peabody</strong>’sGlobalPlatform
<strong>Peabody</strong>’s Global Platform ProvidesGrowth and Earnings DiversificationWorld’s Only Global Pure-Play Coal InvestmentLondonEssenUlaanbaatarUrumqiNew DelhiBeijingSt .LouisDTASingaporeBalikpapanInternational OfficesBrisbane New DelhiNewcastle BeijingLondon UrumqiUlaanbaatar SingaporeEssen JakartaBalikpapanJakartaNCIGMining OperationsPosition Sales ReservesS. PRB #1 148 2.7Midwest #1 30 3.6Southwest #1 18 1.1Colorado #1 8 0.2Australia #5 25 1.2Mining position and sales based on 2011 reported sales volumes in millions of tons. Reserves based on 2011 10-K filing in billions of tons.19
<strong>Peabody</strong> Delivering Strong ResultsAmid Market Challenges● Rising U.S. AdjustedEBITDA YTD and increasingAustralia volumes● Operating cash flows increase10% YTD to $676 million● Q3 Adjusted EBITDA targetsof $350 – $450 million● Targeting <strong>2012</strong> volumes of:– 185 – 195 million tons from U.S.– 31 – 34 million tonsfrom Australia– 230 – 250 million tons in totalYTD values as of June 30, <strong>2012</strong>.20
Gross Margins<strong>Peabody</strong> Mining OperationsU.S. Peer Average<strong>Peabody</strong> Consistently DeliversSuperior Margins<strong>Peabody</strong>’s Gross Margins Average Nearly 30% Above NYSE Peers33%32%25% 25%29%23%● Leading producer inlow-cost regions inthe U.S. with highmarginoperations inAustralia● Global expansiondrives earningsdiversification2010 2011 YTD <strong>2012</strong><strong>Peabody</strong> Australia results include impact of PEA-PCI since acquisition. U.S. peers include ACI, ANR, CNX, CLD, PCX, WLT, ICO, and MEEin years of operation. YTD <strong>2012</strong> results shown through June 30, <strong>2012</strong>.21
<strong>Peabody</strong> U.S. Platform: Continued Focuson Success at Low End of Cost Curve● Current-year U.S. position fully priced since late 2011– 70% – 75% priced for 2013 based on <strong>2012</strong> production levels● Continued operational focus on cost containment:reducing overtime, use of contractors,discretionary spending● Closure of Air Quality Mine in Q3 <strong>2012</strong>– 1.2 MTPY of sales; among <strong>Peabody</strong>‟s highest-cost U.S. mines● Lowering 2013 capital for Twentymile Sage Creek andGateway North extensions while matching new volumeswith current production profileUnpriced position as of June 30, <strong>2012</strong>. Air Quality sales based on 2011 reported sales volumes.22
U.S. Exports Bright Spot forMarket and <strong>Peabody</strong> GrowthTons in Millions● <strong>Peabody</strong> exporting PRB,Illinois Basin and Coloradocoals through Canada, Gulfand East coasts– Targeting 10 million tons of<strong>2012</strong> exports following~6 million tons in 2011● 38% ownership of DTATerminal on East Coast● Secured long-term capacitywith Kinder Morgan for coalexports through Gulf● Advancing West Coastexport capacity throughCherry Point project180160140120100806040200Projected U.S. Industry Exports59161123110881128120101134150 – 17034 - 4442 - 4762 65 65 -702007 2011 <strong>2012</strong>P 2017PEast Coast Gulf Coast West Coast Other8West Coast includes land and seaborne exports.Sources: National Mining Association, <strong>Energy</strong> Information Administration and <strong>Peabody</strong> Global Analytics.23
<strong>Peabody</strong>’s Australia Platform Expandingto Meet Rising Asian Market DemandTons in MillionsTargeted Australia VolumesMetThermalPortBurtonNorth GoonyellaEaglefieldCoppabellaMoorvaleMillenniumMiddlemountQueenslandNew South WalesMetropolitanAbbotPointWambo UndergroundWilpinjongWambo Open CutDalrymple BayPort KemblaGladstoneBrisbanePWCSNCIG4030201008.35.82.525.39.310.15.931 – 3413 –1411 –127 – 840<strong>2012</strong>2005 2011 <strong>2012</strong>P 2015PDomestic Thermal Seaborne Thermal Met8<strong>Peabody</strong> Now Targeting 40 Million Tons by 2015Middlemount attributable ownership tonnages included in 2015 targets.24
Conversion to Owner Operator on Targetat Millennium and Wilpinjong MinesMoving Additional ~40% of Australia Production to Owner Operator● 15% – 20% gross costimprovement overcomes othercost pressures● Increased control over mining● Sharing best practices from other<strong>Peabody</strong> operations● ~75% of Australian production tobe owner operated upon transitionin April 2013● Flexibility to lease someequipment needs to reducecapital outlay● Evaluation under way for otheroperations25
<strong>Peabody</strong> Advancing Late-StageProjects to Completion● Wilpinjong expansion completed on time and on budget– Expanded BTU‟s lowest-cost Australia thermal mine capacity by30% to ~13 MTPY● Millennium expansion near completion– Doubling mine capacity to ~3 – 4 MTPY– Includes SHCC/PCI and adding HCC to mine mix● Burton widening/extension nearingcompletion– Moving to new HCC mining area in Q3– Extends mine life and expands production● North Goonyella longwall top coal cavingtechnology to add HQHCC volumes● Eaglefield co-development extendingmine life, HQHCC production● Middlemount permit received foreventual increase to4 MTPY (100% basis)26
Re-Evaluating Future ProjectPortfolio to Match Market Demand● Metropolitan modernizationunder way; expansiontargeted for 2014 – 15 athigher volumes● Codrilla Mine developmentdeferred– Mine to add 2 – 3 MTPY(attributable ownership) to LV PCI platform– Undergoing drilling and addedvalue engineering● Wambo Open-Cut expansion now outside ofplanning horizon27
Acquisition IntegrationRemains on Track● Upgrading operationsto <strong>Peabody</strong> standards– Increasing equipmentutilization, efficienciesand prep plant yields– Significant improvement inmonthly overburden removalrates at Coppabella, Moorvale● Synergies on track: marketing, blending, logistics,operating, technical and financial areas– $60 to $80 million per year on target to begin in 2013– Total synergy NPV target of $750 million to $1 billion over time● Exploration portfolio more robust than originally expected28
Acquisition SignificantlyStrengthens Bowen Basin Position<strong>Peabody</strong> <strong>Energy</strong> AustraliaBowen BasinPositioning BeforeAcquisitionExisting Mines:– North Goonyella– Eaglefield– Burton– Millennium29
Acquisition SignificantlyStrengthens Bowen Basin PositionNew Bowen Basin Portfolio● New mines include:– Coppabella– Moorvale– Middlemount● Synergies betweenMoorvale and Millennium● Developmental complexwith potential forcentralized infrastructure● Additional projects withcoking coal and PCIpotential includeWest Burton tenement30
<strong>Peabody</strong> Focused onStrengthening the Balance Sheet● Continued focus ondeleveraging– Debt-to-capital at 52%– Repurchased $242 million ofbonds in second quarter– No significant maturities until 2015– Best coal company credit rating● Significant liquidity of$1.9 billion at June 30● Capital spending discipline– Further reduced target capex to $1.0 billion – $1.1 billion for <strong>2012</strong>– Low maintenance capex needs of $1.25 – $1.75 per ton605040302057Total Debt-to-Capital %5247423755522006* 2007 2008 2009 2010 2011 Q2<strong>2012</strong>*Ratio reflects post-Excel acquisition. YTD reflects results through June 30, <strong>2012</strong>. 31
<strong>Peabody</strong> Positioned for Success inAll Market Conditions● Rising metallurgical and thermal coal exportsfrom Australia● Leading position in low-cost PRB and Illinois Basin● Managing through near-term headwinds andtempering growth projects● Aggressive focus on cost control across platform● Solid operating cash flows, low maintenance capexneeds and focus on debt reduction32
<strong>Barclays</strong> <strong>Energy</strong><strong>Conference</strong>Gregory H. BoyceChairman and ChiefExecutive OfficerSeptember 6, <strong>2012</strong>
Appendix:Reconciliation of Non-GAAP MeasuresReconcilation of Adjusted EBITDA to Income from Continuing Operations, Net of Income Taxes (Unaudited)Quarter EndedJune 30,<strong>2012</strong> 2011 2010Year Ended December 31,2009 2008 2007(Dollars in millions)Adjusted EBITDA $ 453.4 $ 2,128.7 $ 1,838.7 $ 1,262.8 $ 1,728.2 $ 958.2Depreciation, depletion and amortization 157.3 482.2 437.1 400.5 397.8 342.9Amortization of basis difference related to equity affiliates 0.9 - - - - -Asset retirement obligation expense 17.3 53.1 47.2 39.9 48.1 23.7Interest expense, net 100.4 219.7 212.4 193.0 217.1 228.8Income tax (benefit) provision (37.8) 363.2 315.4 186.2 159.8 (73.1)Income from continuing operations, net of income taxes $ 215.3 $ 1,010.5 $ 826.6 $ 443.2 $ 905.4 $ 435.9Reconcilation of Adjusted EBITDA to Income from Continuing Operations, Net of Income Taxes - Targets for the Quarter Ending September 30, <strong>2012</strong> (Unaudited)Quarter Ending September 30, <strong>2012</strong>Targeted ResultsLowHigh(Dollars in millions)Adjusted EBITDA $ 350 $450Depreciation, depletion and amortization 155 170Asset retirement obligation expense 18 16Interest expense, net 100 94Income tax provision 19 42Income from continuing operations, net of income taxes $ 58 $128Adjusted EBITDA is defined as income from continuing operations before deducting net interest expense, income taxes, asset retirement obligation expense, depreciation, depletion and amortization andamortization of basis difference associated with equity method investments. Adjusted EBITDA, which is not calculated identically by all companies, is not a substitute for operating income, net income orcash flow as determined in accordance with United States generally accepted accounting principles. Management uses Adjusted EBITDA as a key measure of operating performance and also believes it isa useful indicator of the company's ability to meet debt service and capital expenditure requirements.This information is intended to be reviewed in conjunction with the company’s filings with the Securities and Exchange Commission. 34