Monthly Treasury Statement - Financial Management Service ...
Monthly Treasury Statement - Financial Management Service ...
Monthly Treasury Statement - Financial Management Service ...

Create successful ePaper yourself
Turn your PDF publications into a flip-book with our unique Google optimized e-Paper software.
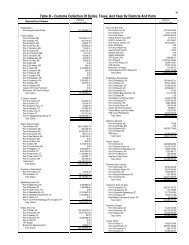
Table 6. Means of Financing the Deficit or Disposition of Surplus by the U.S. Government, July 2001 and Other Periods[$ millions]Assets and LiabilitiesDirectly Related toBudget Off-budget ActivityNet Transactions(−) denotes net reduction of eitherliability or asset accountsThis MonthFiscal Year to DateAccount BalancesCurrent Fiscal YearBeginning ofThis Year Prior Year This Year This MonthClose ofThis monthLiability accounts:Borrowing from the public:<strong>Treasury</strong> securities, issued under general Financing authorities:Debt held by the public . . . . . . . . . . . . . . . . . . . . . . . . . . . . . . . . . . . . . . . . . . . . . . . −8,550 −183,775 −203,572 3,449,998 3,274,773 3,266,222Intragovernmental holdings . . . . . . . . . . . . . . . . . . . . . . . . . . . . . . . . . . . . . . . . . . . . 39 227,900 206,108 2,224,180 2,452,042 2,452,081Total <strong>Treasury</strong> securities outstanding . . . . . . . . . . . . . . . . . . . . . . . . . . . . . . −8,512 44,125 2,536 5,674,178 5,726,815 5,718,303Plus premium on <strong>Treasury</strong> securities . . . . . . . . . . . . . . . . . . . . . . . . . . . . −35 131 −67 2,699 2,865 2,830Less discount on <strong>Treasury</strong> securities . . . . . . . . . . . . . . . . . . . . . . . . . . . . −2,645 −3,670 −5,503 75,541 74,516 71,871Total <strong>Treasury</strong> securities net of Premium and discount . . . . . −5,902 47,926 7,973 5,601,336 5,655,165 5,649,262Agency securities, issued under special financing authorities (seeSchedule B. for other Agency borrowing, see Schedule C) . . . . . . . . . −162 −735 −781 27,672 27,099 26,937Total federal securities . . . . . . . . . . . . . . . . . . . . . . . . . . . . . . . . . . . . . . . . . . . . . . . . −6,064 47,191 7,192 5,629,009 5,682,264 5,676,200Deduct:Federal securities held as investments of governmentaccounts (see Schedule D) . . . . . . . . . . . . . . . . . . . . . . . . . . . . . . . . . . . . . −281 216,595 207,799 2,235,763 2,452,639 2,452,358Less discount on federal securities held as investments ofgovernment accounts . . . . . . . . . . . . . . . . . . . . . . . . . . . . . . . . . . . . . . . . . −1,380 3,486 275 16,867 21,733 20,353Net federal securities held as investments of governmentaccounts . . . . . . . . . . . . . . . . . . . . . . . . . . . . . . . . . . . . . . . . . . . . . . . . . . . . . 1,099 213,109 207,524 2,218,896 2,430,906 2,432,005Total borrowing from the public . . . . . . . . . . . . . . . . . . . . . . . . . . −7,163 −165,918 −200,332 3,410,113 3,251,358 3,244,195Accrued interest payable to the public . . . . . . . . . . . . . . . . . . . . . . . . . . . . . . . . . . . 1,504 −697 5,032 44,211 42,011 43,514Allocations of special drawing rights . . . . . . . . . . . . . . . . . . . . . . . . . . . . . . . . . . . . . . 64 −192 −364 6,359 6,103 6,167Deposit funds . . . . . . . . . . . . . . . . . . . . . . . . . . . . . . . . . . . . . . . . . . . . . . . . . . . . . . . . . . . . . . . −175 4,833 889 2,625 7,633 7,458Miscellaneous liability accounts (includes checks outstanding etc.) . . . . . 1,781 1,861 −4,151 4,140 4,221 6,001Total liability accounts . . . . . . . . . . . . . . . . . . . . . . . . . . . . . . . . . . . . . . . . . . . . . . −3,990 −160,112 −198,927 3,467,448 3,311,326 3,307,336Asset accounts (deduct)Cash and monetary assets:U.S. <strong>Treasury</strong> operating cash: 1Federal Reserve account . . . . . . . . . . . . . . . . . . . . . . . . . . . . . . . . . . . . . . . . . . . . . −1,596 −2,868 −1,249 8,459 7,188 5,592Tax and loan note accounts . . . . . . . . . . . . . . . . . . . . . . . . . . . . . . . . . . . . . . . . . . −18,992 −26,693 −21,156 44,199 36,498 17,506Balance . . . . . . . . . . . . . . . . . . . . . . . . . . . . . . . . . . . . . . . . . . . . . . . . . . . . . . . . . . . . . . −20,588 −29,560 −22,405 52,659 43,687 23,098Special drawing rights:Total holdings . . . . . . . . . . . . . . . . . . . . . . . . . . . . . . . . . . . . . . . . . . . . . . . . . . . . . . . . . . 109 202 −26 10,316 10,409 10,518SDR certificates issued to Federal Reserve Banks . . . . . . . . . . . . . . . . . . . . . . . 1,000 3,000 −3,200 −2,200 −2,200Balance . . . . . . . . . . . . . . . . . . . . . . . . . . . . . . . . . . . . . . . . . . . . . . . . . . . . . . . . . . . . . . 109 1,202 2,974 7,116 8,209 8,318Reserve position on the U.S. quota in the IMF:U.S. subscription to International Monetary Fund:Direct quota payments . . . . . . . . . . . . . . . . . . . . . . . . . . . . . . . . . . . . . . . . . . . . . . . . . . . . . . . . . . . . . . . . 46,525 46,525 46,525Maintenance of value adjustments . . . . . . . . . . . . . . . . . . . . . . . . . . . . . . . . . 486 −1,455 −2,762 1,691 −250 236Letter of credit issued to IMF . . . . . . . . . . . . . . . . . . . . . . . . . . . . . . . . . . . . . . . . 206 3,980 −3,965 −35,827 −32,053 −31,847Dollar deposits with the IMF . . . . . . . . . . . . . . . . . . . . . . . . . . . . . . . . . . . . . . . . . . −16 −18 5 −117 −119 −135Receivable/Payable (−) for interim maintenance of valueadjustments . . . . . . . . . . . . . . . . . . . . . . . . . . . . . . . . . . . . . . . . . . . . . . . . . . . . . . . . . . . −331 −1,230 1,828 1,418 520 188Balance . . . . . . . . . . . . . . . . . . . . . . . . . . . . . . . . . . . . . . . . . . . . . . . . . . . . . . . . . . . . . . 345 1,278 −4,894 13,690 14,623 14,968Loans to International Monetary Fund . . . . . . . . . . . . . . . . . . . . . . . . . . . . . . . . . . . . . . . . . . . . . . . . . . . . . . . . . . . . . . . . . . . . . .Other cash and monetary assets . . . . . . . . . . . . . . . . . . . . . . . . . . . . . . . . . . . . . . . 3,091 7,627 −98 24,937 29,473 32,564Total cash and monetary assets . . . . . . . . . . . . . . . . . . . . . . . . . . . . . . . . . . . . . −17,043 −19,453 −24,423 98,401 95,992 78,949Net Activity, Guaranteed Loan Financing . . . . . . . . . . . . . . . . . . . . . . . . . . . . . . . . . 631 1,313 −2,195 −22,956 −22,274 −21,643Net Activity, Direct Loan Financing . . . . . . . . . . . . . . . . . . . . . . . . . . . . . . . . . . . . . . . 12,387 20,745 8,834 105,459 113,818 126,204Miscellaneous asset accounts . . . . . . . . . . . . . . . . . . . . . . . . . . . . . . . . . . . . . . . . . . . . . 1,402 107 −2,168 −107 −1,402 (* *)Total asset accounts . . . . . . . . . . . . . . . . . . . . . . . . . . . . . . . . . . . . . . . . . . . . . . . . −2,624 2,712 −19,952 180,798 186,134 183,510Excess of liabilities (+) or assets (−) . .. .. .. .. .. ... .. .. .. .. .. ... .. .. .. .. .. −1,366 −162,824 −178,975 +3,286,651 +3,125,192 +3,123,826Transactions not applied to current year’s surplus or deficit (seeSchedule A for Details) . . . . . . . . . . . . . . . . . . . . . . . . . . . . . . . . . . . . . . . . . . . . . . . . . . . . . −1,155 −8,640 −2,623 . . . . . . −7,486 −8,640Total budget and off-budget federal entities(financing of deficit (+) or disposition ofsurplus (−)) . ............................................................... −2,520 −171,465 −181,597 +3,286,651 +3,117,706 +3,115,1861 Major sources of information used to determine <strong>Treasury</strong>’s operating cash income include ... No Transactions.Federal Reserve Banks, the <strong>Treasury</strong> Regional Finance Centers, the Internal Revenue <strong>Service</strong> (* *) Less than $500,000.Centers, the Bureau of the Public Debt and various electronic systems. Deposits are reflected asNote: Details may not add to totals due to rounding.received and withdrawals are reflected as processed.20