PDF (483.4 KB) - Animal Research - EDP Sciences
PDF (483.4 KB) - Animal Research - EDP Sciences
PDF (483.4 KB) - Animal Research - EDP Sciences

You also want an ePaper? Increase the reach of your titles
YUMPU automatically turns print PDFs into web optimized ePapers that Google loves.
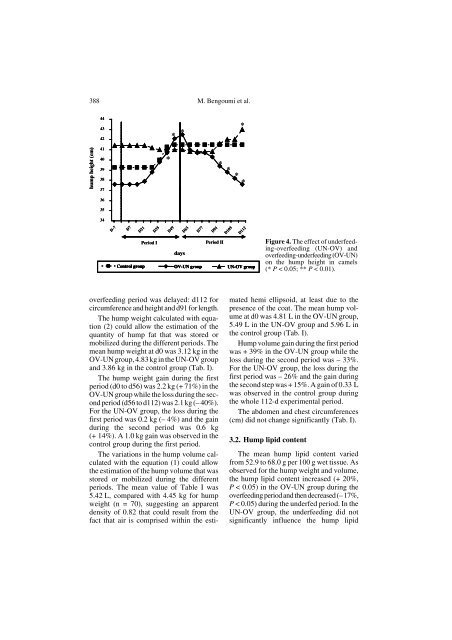
388 M. Bengoumi et al.Figure 4. The effect of underfeeding-overfeeding(UN-OV) andoverfeeding-underfeeding (OV-UN)on the hump height in camels(* P < 0.05; ** P < 0.01).overfeeding period was delayed: d112 forcircumference and height and d91 for length.The hump weight calculated with equation(2) could allow the estimation of thequantity of hump fat that was stored ormobilized during the different periods. Themean hump weight at d0 was 3.12 kg in theOV-UN group, 4.83 kg in the UN-OV groupand 3.86 kg in the control group (Tab. I).The hump weight gain during the firstperiod (d0 to d56) was 2.2 kg (+ 71%) in theOV-UN group while the loss during the secondperiod (d56 to d112) was 2.1 kg (– 40%).For the UN-OV group, the loss during thefirst period was 0.2 kg (– 4%) and the gainduring the second period was 0.6 kg(+ 14%). A 1.0 kg gain was observed in thecontrol group during the first period.The variations in the hump volume calculatedwith the equation (1) could allowthe estimation of the hump volume that wasstored or mobilized during the differentperiods. The mean value of Table I was5.42 L, compared with 4.45 kg for humpweight (n = 70), suggesting an apparentdensity of 0.82 that could result from thefact that air is comprised within the estimatedhemi ellipsoid, at least due to thepresence of the coat. The mean hump volumeat d0 was 4.81 L in the OV-UN group,5.49 L in the UN-OV group and 5.96 L inthe control group (Tab. I).Hump volume gain during the first periodwas + 39% in the OV-UN group while theloss during the second period was – 33%.For the UN-OV group, the loss during thefirst period was – 26% and the gain duringthe second step was + 15%. A gain of 0.33 Lwas observed in the control group duringthe whole 112-d experimental period.The abdomen and chest circumferences(cm) did not change significantly (Tab. I).3.2. Hump lipid contentThe mean hump lipid content variedfrom 52.9 to 68.0 g per 100 g wet tissue. Asobserved for the hump weight and volume,the hump lipid content increased (+ 20%,P < 0.05) in the OV-UN group during theoverfeeding period and then decreased (– 17%,P < 0.05) during the underfed period. In theUN-OV group, the underfeeding did notsignificantly influence the hump lipid