PDF (483.4 KB) - Animal Research - EDP Sciences
PDF (483.4 KB) - Animal Research - EDP Sciences
PDF (483.4 KB) - Animal Research - EDP Sciences

Create successful ePaper yourself
Turn your PDF publications into a flip-book with our unique Google optimized e-Paper software.
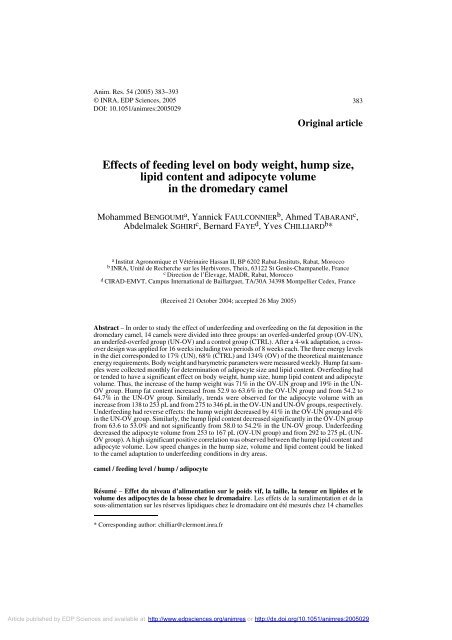
Anim. Res. 54 (2005) 383–393© INRA, <strong>EDP</strong> <strong>Sciences</strong>, 2005DOI: 10.1051/animres:2005029383Original articleEffects of feeding level on body weight, hump size,lipid content and adipocyte volumein the dromedary camelMohammed BENGOUMI a , Yannick FAULCONNIER b , Ahmed TABARANI c ,Abdelmalek SGHIRI c , Bernard FAYE d , Yves CHILLIARD b *a Institut Agronomique et Vétérinaire Hassan II, BP 6202 Rabat-Instituts, Rabat, Moroccob INRA, Unité de Recherche sur les Herbivores, Theix, 63122 St Genès-Champanelle, Francec Direction de l’Élevage, MADR, Rabat, Moroccod CIRAD-EMVT, Campus International de Baillarguet, TA/30A 34398 Montpellier Cedex, France(Received 21 October 2004; accepted 26 May 2005)Abstract – In order to study the effect of underfeeding and overfeeding on the fat deposition in thedromedary camel, 14 camels were divided into three groups: an overfed-underfed group (OV-UN),an underfed-overfed group (UN-OV) and a control group (CTRL). After a 4-wk adaptation, a crossoverdesign was applied for 16 weeks including two periods of 8 weeks each. The three energy levelsin the diet corresponded to 17% (UN), 68% (CTRL) and 134% (OV) of the theoretical maintenanceenergy requirements. Body weight and barymetric parameters were measured weekly. Hump fat sampleswere collected monthly for determination of adipocyte size and lipid content. Overfeeding hador tended to have a significant effect on body weight, hump size, hump lipid content and adipocytevolume. Thus, the increase of the hump weight was 71% in the OV-UN group and 19% in the UN-OV group. Hump fat content increased from 52.9 to 63.6% in the OV-UN group and from 54.2 to64.7% in the UN-OV group. Similarly, trends were observed for the adipocyte volume with anincrease from 138 to 253 pL and from 275 to 346 pL in the OV-UN and UN-OV groups, respectively.Underfeeding had reverse effects: the hump weight decreased by 41% in the OV-UN group and 4%in the UN-OV group. Similarly, the hump lipid content decreased significantly in the OV-UN groupfrom 63.6 to 53.0% and not significantly from 58.0 to 54.2% in the UN-OV group. Underfeedingdecreased the adipocyte volume from 253 to 167 pL (OV-UN group) and from 292 to 275 pL (UN-OV group). A high significant positive correlation was observed between the hump lipid content andadipocyte volume. Low speed changes in the hump size, volume and lipid content could be linkedto the camel adaptation to underfeeding conditions in dry areas.camel / feeding level / hump / adipocyteRésumé – Effet du niveau d’alimentation sur le poids vif, la taille, la teneur en lipides et levolume des adipocytes de la bosse chez le dromadaire. Les effets de la suralimentation et de lasous-alimentation sur les réserves lipidiques chez le dromadaire ont été mesurés chez 14 chamelles* Corresponding author: chilliar@clermont.inra.frArticle published by <strong>EDP</strong> <strong>Sciences</strong> and available at http://www.edpsciences.org/animres or http://dx.doi.org/10.1051/animres:2005029
384 M. Bengoumi et al.divisées en trois lots : un lot suralimenté – sous-alimenté (OV-UN), un lot sous-alimenté –suralimenté (UN-OV) et un lot témoin (CTRL). Après 4 semaines d’adaptation un schémaexpérimental croisé a été appliqué pendant 16 semaines comprenant 2 périodes de 8 semaineschacune. L’apport énergétique des 3 niveaux d’alimentation représentait 17, 68 et 134 % des besoinsénergétiques théoriques d’entretien respectivement pour le régime sous-alimentation, témoin etsuralimentation. Le poids vif et les paramètres barymétriques ont été mesurés chaque semaine. Lesbiopsies de la bosse pour la détermination de la taille des adipocytes et la teneur en lipides ont étéréalisées mensuellement. La suralimentation a un effet significatif sur le poids vif, la taille de la bosseet sa teneur en lipides ainsi que sur le volume des adipocytes. Le poids de la bosse augmente de 71 %pour le lot OV-UN et de 19 % pour le lot UN-OV. La teneur en matière grasse augmente de 52,9 à63,6 % pour le lot OV-UN et de 54,2 à 64,7 % pour le lot UN-OV. Des évolutions similaires sontobservées pour le volume des adipocytes qui augmente de 138 à 253 pL et de 275 à 346 pL pour leslots OV-UN et UN-OV, respectivement. La sous-alimentation a un effet inverse avec une diminutiondu poids de la bosse de 41 % pour le lot OV-UN et de 4 % pour le lot UN-OV. La teneur en lipidesde la bosse diminue également significativement de 63,6 à 53,0 % pour le lot OV-UN et de manièrenon significative de 58,0 à 54,2 % pour le lot UN-OV. De même, la sous-alimentation diminuesignificativement le volume des adipocytes de 253 à 167 et de 292 à 275 pL pour les lots OV-UNet UN-OV, respectivement. Une corrélation hautement significative est observée entre le volumedes adipocytes de la bosse et sa teneur en lipides. La faible vitesse de variation de la taille de la bosse,de sa teneur en lipides et de la taille de ses adipocytes sont probablement des particularités liées auxmécanismes d’adaptation du dromadaire à la sous alimentation dans les zones arides.dromadaire / niveau d’alimentation / bosse / adipocytes1. INTRODUCTIONThe camel is well known for its adaptationto dehydration and underfeeding [3, 31,32]. The mechanisms of resistance to dehydration,or to mineral deficiency have beenstudied [4, 14]. Reports concerning themechanisms of adaptation to the extremevariation of feeding in camels and body fatchanges during underfeeding are rare [10,13, 17]. During underfeeding periods, ruminantsuse their fat stores to maintain theirproductivity, and/or to survive, by mobilizingadipose tissue accumulated during overfeedingperiods [8, 11]. Simultaneously tofat mobilization, the camel as for othermammals [11] is probably able to mobilizeproteins, particularly visceral and muscularproteins. However, we are not aware of anypublished data on that subject in camels. Inthe dromedary camel, the main fat reservesare located in the hump and secondarilyaround the kidney, mesentery and sternum[18]. Previous studies have demonstrated apositive relationship between the hump andkidney fat weight and their respective adipocytesizes, and also between the volumeof the hump and the body condition score[15, 16]. Those studies were performed oncamels with an unknown nutritional status.The aim of the present work was to studythe effect of different levels of energyintake, especially during overfeeding andunderfeeding periods, on hump lipid contentand size, adipocyte size and some bodymeasurements in the dromedary camel.2. MATERIALS AND METHODS2.1. <strong>Animal</strong>sThe experiment was carried out at theinsemination center of Ain Jemaa (Casablanca,Morocco) from March to August2000 on fourteen 10 to 15-year old femalecamels (Camelus dromedarius).The animals were treated for external andinternal parasites by ivermectine (IVOMEC®)injection during the first day of the adaptationperiod at the dosage of 0.2 mg per kgof body weight. They were fed daily withthe same control diet including 2 kg ofwheat straw and 0.5 kg per 100 kg BW perday of barley for one month. Water was
Feeding level and camel hump size and cellularity 385provided ad libitum. After one month, theanimals were divided into three groups: overfed-underfed(OV-UN), underfed-overfed(UN-OV) and control (CTRL) groups containingrespectively 5, 5 and 4 animals. Thecontrol group received the basal diet providing68% of the maintenance energyrequirements as estimated by Wardeh [30].This basal diet level has been chosenaccording to the usual feeding practices ofthe camel herders in Morocco. During the4-month experimental period, a cross overdesign was applied to the two other groups.The OV-UN group was overfed with thebasal diet and a daily supplement of 0.5 kgper 100 kg BW of barley providing 134%of the maintenance energy requirements for2 months and then for another 2 months theywere fed a restricted diet with 2 kg per dayof wheat straw, providing 17% of the maintenanceenergy requirements. The UN-OVgroup was fed a restricted diet with 2 kg perday of wheat straw for 2 months and thenthey were overfed with the basal diet and adaily supplement of 0.5 kg per 100 kg BWof barley for 2 months.At the beginning of the experiment (at d-7), the mean body weights were 383 ± 33,374 ± 55 and 340 ± 39 kg in the control, UN-OV and OV-UN groups, respectively.2.2. Body weight and humpmeasurementsThe animals were weighed weekly in themorning before diet distribution during theexperimental period using a dump scale.The measurement of the hump size (length,height, and circumference) was performedweekly according to the method describedby Faye et al. [16]. The hump volume (HV)and hump weight (HW) were estimatedusing the equations:(1) HV = 0.07 L × B × H(2) HW (kg) = 0.45 H (cm) – 13.8where L is the length of the hump (half-circumferencefrom the forehead to the backthrough the top), B is the basal half-circumferenceof the hump (from the forehead tothe back through the base of the hump) andH is the height of the hump (half-circumferencefrom one side to the other throughthe top). Formula (1) was calculated consideringthe hump as a hemi ellipsoid. Formula(2) was calculated (ε = 0.571, n = 64,P < 0.001) from data at slaughter collectedin southern Morocco [22].2.3. BiopsiesHump biopsies were performed monthlyby collecting one cm 3 of adipose tissue. Theanimal was stood and did not receive a generalsedative. The skin of the puncture wasshaved and disinfected with iodine dye.After a local anaesthesia by subcutaneousinjection of 2 mL of xylocaïne, two smallincisions (2 cm) were carried out. The skinwas rolled off and the adipose tissue wascollected using slender bistouries. After thebiopsy, the wound was disinfected andsutured. The preparation of the adipose tissuefor adipocyte size measurements wasdescribed in previous studies [23, 24]. Briefly,adipose tissue cellularity was measured on tissuefixed with osmium tetroxide and digestedin urea solution. Cell diameters > 25 µm weremeasured with Optimas software (OptimasCorporation, Bothell, WA) and the meanvolume was calculated from the individualcell volumes. The lipid content of biopsysamples was determined using petroleumether extraction in a Soxhlet apparatus [1].2.4. Statistical analysisThe results were analyzed using ANOVAon repeated measures for the comparisonbetween and within groups. The Studentpairwise t test was used to compare themean values between phases within groups.Only within-group variations were testedbecause the analyzed parameters werestrongly heterogeneous between the groupsat the beginning of the trial. Correlationsbetween parameters were studied using thePearson method. The software R was usedfor all the statistical analyses [20].
386 M. Bengoumi et al.Figure 1. The effect of underfeeding-overfeeding (UN-OV) and overfeeding-underfeeding (OV-UN) on the body weight in camels.3. RESULTS3.1. Body weight and hump sizeThe body weight of some animalsincreased and decreased weekly accordingto the “sawtooth waveform”. However, themean trends of the body weight in the OV-UN and UN-OV groups, respectively, wereopposite (Fig. 1 and Tab. I). In the controlgroup, the body weight did not vary significantly,despite unexpected variations at thebeginning and end of the experiment.Mean hump dimensions are shown inFigures 2, 3 and 4. In the control group,there was no significant change in the humpdimensions.Table I. Changes in body weight, hump volume, hump weight, abdomen and chest circumferencesin the different groups of camels.Measurements Groups DaysD0 D56 D112Body weight (kg)OV-UNUN-OVControl345 ± 42354 ± 42384 ± 27374 ± 39329 ± 17384 ± 15292 ± 53387 ± 13401 ± 39Hump volume (L)Hump weight (kg)Abdomen circumference(cm)Chest circumference (cm)OV-UNUN-OVControlOV-UNUN-OVControlOV-UNUN-OVControlOV-UNUN-OVControl4.81 ± 1.005.49 ± 0.725.96 ± 1.083.12 ± 1.704.83 ± 2.393.86 ± 1.62220 ± 11215 ± 7224 ± 5177 ± 4186 ± 16179 ± 56.66 ± 0.814.08 ± 0.656.21 ± 1.285.32 ± 1.964.65 ± 2.574.87 ± 1.63238 ± 12212 ± 6225 ± 5180 ± 4182 ± 13179 ± 54.49 ± 1.124.76 ± 0.856.28 ± 1.233.12 ± 1.375.55 ± 2.554.88 ± 1.63229 ± 12210 ± 6225 ± 5176 ± 4179 ± 4182 ± 5
Feeding level and camel hump size and cellularity 387Figure 2. The effect of underfeeding-overfeeding(UN-OV)and overfeeding-underfeeding(OV-UN) on the hump basalhalfcircumference in camels(* P < 0.05; ** P < 0.01).Figure 3. The effect of underfeeding-overfeeding(UN-OV)and overfeeding-underfeeding(OV-UN) on the hump length incamels (* P < 0.05; ** P < 0.01).In the OV-UN group, a significant (P
388 M. Bengoumi et al.Figure 4. The effect of underfeeding-overfeeding(UN-OV) andoverfeeding-underfeeding (OV-UN)on the hump height in camels(* P < 0.05; ** P < 0.01).overfeeding period was delayed: d112 forcircumference and height and d91 for length.The hump weight calculated with equation(2) could allow the estimation of thequantity of hump fat that was stored ormobilized during the different periods. Themean hump weight at d0 was 3.12 kg in theOV-UN group, 4.83 kg in the UN-OV groupand 3.86 kg in the control group (Tab. I).The hump weight gain during the firstperiod (d0 to d56) was 2.2 kg (+ 71%) in theOV-UN group while the loss during the secondperiod (d56 to d112) was 2.1 kg (– 40%).For the UN-OV group, the loss during thefirst period was 0.2 kg (– 4%) and the gainduring the second period was 0.6 kg(+ 14%). A 1.0 kg gain was observed in thecontrol group during the first period.The variations in the hump volume calculatedwith the equation (1) could allowthe estimation of the hump volume that wasstored or mobilized during the differentperiods. The mean value of Table I was5.42 L, compared with 4.45 kg for humpweight (n = 70), suggesting an apparentdensity of 0.82 that could result from thefact that air is comprised within the estimatedhemi ellipsoid, at least due to thepresence of the coat. The mean hump volumeat d0 was 4.81 L in the OV-UN group,5.49 L in the UN-OV group and 5.96 L inthe control group (Tab. I).Hump volume gain during the first periodwas + 39% in the OV-UN group while theloss during the second period was – 33%.For the UN-OV group, the loss during thefirst period was – 26% and the gain duringthe second step was + 15%. A gain of 0.33 Lwas observed in the control group duringthe whole 112-d experimental period.The abdomen and chest circumferences(cm) did not change significantly (Tab. I).3.2. Hump lipid contentThe mean hump lipid content variedfrom 52.9 to 68.0 g per 100 g wet tissue. Asobserved for the hump weight and volume,the hump lipid content increased (+ 20%,P < 0.05) in the OV-UN group during theoverfeeding period and then decreased (– 17%,P < 0.05) during the underfed period. In theUN-OV group, the underfeeding did notsignificantly influence the hump lipid
Feeding level and camel hump size and cellularity 389Table II. Changes in hump lipid content and adipocyte mean volume in the different groups of camels(* value differs at P < 0.05 from other values within the same group).Measurements Groups DaysD0 D28 D56 D84 D112Hump lipid content(g per 100 g wet tissue)OV-UNUN-OVControl52.9 ± 6.758.0 ± 8.364.0 ± 5.153.9 ± 4.956.2 ± 7.964.4 ± 3.363.6 ± 8.8*54.2 ± 8.363.7 ± 4.955.0 ± 4.961.6 ± 10.164.7 ± 4.053.0 ± 4.764.7 ± 9.768.0 ± 3.0Adipocyte volume (pL)OV-UNUN-OVControl138 ± 92292 ± 164314 ± 111159 ± 96275 ± 185326 ± 72253 ± 140*275 ± 196298 ± 104160 ± 48344 ± 223339 ± 111167 ± 86346 ± 226351 ± 54content while the overfeeding induced a nonsignificantincrease (+ 19%) of this content.No change was observed in the controlgroup (Tab. II).According to changes in the hump weight(or volume with a theoretical density of0.82) and lipid content, the estimated fatmobilization from the hump during theunderfeeding period was 1.68 (or 1.55) kgin the OV-UN group and 0.28 (or 0.80) kgin the UN-OV group. The estimated fat storageduring the overfeeding period was 1.73(or 1.41) kg and 0.90 (or 0.68) kg in the OV-UN and the UN-OV groups, respectively.3.3. Adipocyte volumeThe initial mean (D0) volume for theOV-UN group was 138 pL which was quitelower than for the UN-OV group (292 pL)and for the control group (314 pL) (Tab. II).The changes in adipocyte volume showeda significant increase (+ 83%, P < 0.05) inthe OV-UN group during the overfeedingperiod and then a decrease (– 34%, P < 0.05)during the underfeeding period.In the UN-OV group, changes in meanadipocyte volume were in the same way asexpected: a decrease (– 6%) in the underfeedingperiod and an increase (+ 26%) inthe overfeeding period, but these changeswere not significant.In the control group, there was no significantvariation in the mean adipocyte volume.Table III. Pearson correlation matrix betweenadipocyte volume, hump volume, hump weightand hump lipid rate calculated on 14 animals for5 samplings (n = 70; * P < 0.05, ** P < 0.001).AdipocytevolumeHumpvolume3.4. Relationship between adipocytevolume, hump size and lipidcontentHumpweightAdipocyte volume – – –Hump volume – 0.026 – –Hump weight 0.635** 0.262* –Lipid content 0.755** 0.129 0.438**No significant correlation between humpvolume and adipocyte volume or humplipid content was observed (Tab. III). However,significant relationships were observedbetween hump weight and adipocyte volume(r = 0.635), lipid content (r = 0.438) orhump volume (r = 0.262).The correlation between hump adipocytevolume and lipid content (independentlymeasured in 2 different laboratories)was highly significant when calculated on70 biopsied samples (Fig. 5), and alsowithin groups: 0.929 in the OV-UN group,0.932 in the UN-OV group and 0.864 in thecontrol group (P < 0.001).
390 M. Bengoumi et al.Figure 5. The relationship betweenadipocyte volume (in pL) and lipid content(in %) in camel hump adiposetissue (r = 0.77 for the linear adjustment,y = 12.1x – 453 and r = 0.82 forthe non-linear adjustment, y = 0.0003x 3.349 ; n = 70; P < 0.001).4. DISCUSSION4.1. Body weight, hump size and lipidcontentMost of the camels in our trial had lowbody weight and hump dimensions in allgroups at the beginning of the trial. Themean weight of the animals (359 + 39 kg)at D0 was indeed in the lower part of therange of body weight of the adult Moroccanbreeds, which ranged from 280 to 600 kgaccording to the breed and body score [2].In this trial, the estimated hump weight variedfrom 0.15 to 8.25 kg while it was 0 to90 kg with an average of 18 kg in the literature.This difference could be related eitherto the breed [13] or to a poor nutritional statusof the animals in the present study.The proposed diet for the control groupcovered in theory only 68% of the requirementsin energy. In spite of that hypo-energeticdiet, the control group did not showany notable variation of the studied parameters(except for one animal, which presenteda significant increase of hump heightbetween d0 and d56).Overfeeding induced a significant increasein the body weight. However, the effect ofunderfeeding seemed to be more significantafter an overfeeding period. The apparentrandom variation of the body weight couldbe attributed to the irregular water intake.Indeed, the quantity of drinking water couldvary extremely in the camel even if thewater was available daily ad libitum. Sincethe camel is adapted to drink great quantitiesof water, body weight can change suddenly.In spite of the high individualvariation, body weight loss during underfeedingwas more important in the OV-UNgroup than in the UN-OV group, suggestingthat the effects of previous recent overfeedingcould be more rapidly reversed thanwhen the animals were already adapted fora long period to a lower “maintenance” diet.The decrease of the hump size due to theunderfeeding attests to the fat mobilizationaccording to the nature of the hump essentiallyconstituted of adipose tissue. In thecamel, the hump represents 44% of total lipids[18]. The lipid content (wet weight basis)in the hump is over 60% in adult camels,64.2% in less than one-year-olds, 84.8% in1- to 3-year-olds and 83.1% in more than3-year-olds [21]. These values are higherthan the figures attained in this study, whichcould be attributed to the low body conditionof the camels. The lipids in the camelhump, as for the cattle zebu hump or forsheep fat tail, are mobilizable forms ofenergy to ensure the needs for maintenance,production and adaptation to a harsh environment[10]. This mobilization already
Feeding level and camel hump size and cellularity 391seemed important after 4 weeks of underfeedingin this study and, conversely, theoverfeeding induced an increase of the humpsize that was significant after one month.However, the small extent of quantitativechanges could indicate that other types offat depots are implicated, probably the fataround the kidney as suggested in a previousstudy [16]. Furthermore, this suggeststhat the mobilization of body reserves duringunderfeeding occurred at a low rate,reflecting a global adaptation form of thecamel to long term energy deficiency.4.2. Adipocyte sizeThe mean hump adipocyte volume in thethree groups at the beginning of the experimentwas lower (248 pL) than that reportedpreviously (341 pL) [16]. This differencecould be attributed to the high body conditionof the animals in that study that werefattened for slaughter. The average of humpadipocytes was lower than that observed insubcutaneous adipose tissue in well-fed cattleand sheep, but similar or higher to thatobserved in sharply underfed adult cattle [7]and sheep [27].Overfeeding had a positive effect, especiallyin the OV-UN group, on the adipocytesize as reported in cattle [7] and sheep [28].However, a high individual within-groupdifference was observed, especially in theUN-OV group. This effect was not statisticallysignificant in that group. As discussedin the previous section, the negative effectof underfeeding on the adipocyte volumecould be more important after an overfeedingperiod (OV-UN group), even if thiseffect was not significant. The small size ofthe adipocytes at the beginning of the trialcould explain the non-significant effect ofunderfeeding, because lipolysis is morecommon in fat animals [12].It generally takes a long time after achange in feeding levels of ruminants toobserve any significant change in adipocytesize. For example, it was observed [29] thatafter 4 months of an experiment in growingcattle a difference occurred between 1.74and 0.76 × maintenance levels, but not with1.43 × maintenance. In adult sheep, no differencewas observed after 2 weeks at either0.22 or 1.90 × maintenance [5]. Thus, the2-month duration of the periods in thepresent trial could be too short to allowobserving fully potential changes in adipocytevolume.4.3. Correlations between parametersThe absence of correlation between calculatedhump volume and either lipid contentor adipocyte volume could be partlyattributed to the uncertainty in the humpvolume calculation, especially when thehump was small. Indeed, the volume of thehump was estimated in considering itsshape as a hemi-ellipsoid [16]. With smallhumps, this hypothesis could be debatable.On the contrary, the hump weight of liveanimals was estimated simply from theheight (easier to measure) and using anequation calibrated in the slaughterhousewith a good precision [22]. However, thehump volume gave quantitative estimationsof hump changes (Tab. I) that were morestable when comparing a given feedinglevel for the three groups, probably becausethe use of 3 independent dimensions wasmore robust than only one dimension.The mean adipocyte volume was closelyassociated to the hump weight (or height)and, more markedly, to the hump lipid content(r = 0.82 for the non-linear adjustmentof the sigmoid curve, Fig. 5). In other ruminants,adipocyte size was related to the totalbody lipids of the animals, in cattle [9, 25]and sheep [6]. Indeed, the growth of adiposetissue in the adult ruminant was essentiallydue to the accumulation of lipids in adipocytevacuoles. Thus, the volume of adiposetissue is related to the change in the sizeof adipocytes [19, 26].In conclusion, fat mobilization duringunderfeeding of low body condition camelswas of limited extent, suggesting an adaptationof this species to energy deprivation
392 M. Bengoumi et al.by decreasing the energy expenses. In otherrespects, the results confirm that in the camelchanges in the fat storage level are insured,at least in part, by changes in the volume ofhump adipocytes, which result in simultaneouschanges in the hump lipid content.Since the hump is the main fat storage in thecamel, estimations of its weight and lipidcontent could be used as good indicators ofadiposity in this animal species.ACKNOWLEDGEMENTSThis study was achieved in the frame of thePRAD project (No. 01/04) supported by French-Moroccan cooperation. The authors thank especiallyDr. A. Touré, S. Grech and A. Marouanefor their contribution and D. Bany for adipocytevolume measurements.REFERENCES[1] AOAC, Official methods of analysis (15thed.), Association of Official Analytical chemists,Washington DC, 1989.[2] Achaabane M.R., Ouassat M., Études etrecherches appliquées sur l’élevage camelin,Rapport annuel n° 2, IAV Hassan II, Rabat,Morocco, 1994, 2 p.[3] Bengoumi M., Riad F., Giry J., De La FargeF., Davicco M.J., Safwate A., Barlet JP., Hormonalcontrol of water and sodium in plasmaand urine of camels during dehydration andrehydration, Gen. Comp. Endocrinol. 89(1993) 378–386.[4] Bengoumi M., Faye B., Adaptation du dromadaireà la déshydratation, Revue Sécheresse13 (2102) 121–129.[5] Bocquier F., Bonnet M., Faulconnier Y.,Guerre-Millo M., Martin P., Chilliard Y.,Effects of photoperiod and feeding level onadipose tissue metabolic activity and leptinsynthesis in the ovariectomized ewe, Reprod.Nutr. Dev. 38 (1998) 489–498.[6] Bocquier F., Guillouet Ph., Barillet F.,Chilliard Y., Comparison of three methods forthe in vivo estimation of body composition indairy ewes, Ann. Zootech. 48 (1999) 297–308.[7] Chilliard Y., Robelin J., Activité lipoprotéinelipasiquede différents dépots adipeux et sesrelations avec la taille des adipocytes chez lavache tarie, au cours d’engraissement ou endébut de lactation, Reprod. Nutr. Dev. 25(1985) 287–293.[8] Chilliard Y., Revue bibliographique. Variationsquantitatives et métabolisme des lipidesdans le tissu adipeux et le foie au cours ducycle gestation-lactation chez la brebis et lavache, Reprod. Nutr. Dev. 26 (1987) 327–398.[9] Chilliard Y., Rémond B., Agabriel J., RobelinJ., Vérité R., Variations du contenu digestif etdes réserves corporelles au cours du cycle gestationlactation, Bull. Tech. CRZV Theix 70(1987) 117–131.[10] Chilliard Y., Particularités du métabolismedes lipides et du métabolisme énergétiquechez le dromadaire, Options méditerranéennes,série séminaires n° 2 (1989) 101–110.[11] Chilliard Y., Bocquier F., Doreau M., Digestiveand metabolic adaptation of ruminants onundernutrition and consequences on reproduction,Reprod. Nutr. Dev. 38 (1998) 131–152.[12] Chilliard Y., Ferlay A., Faulconnier Y., BonnetM., Rouel J., Bocquier F., Adipose tissuemetabolism and its role in adaptations toundernutrition in ruminants, Proc. Nutr. Soc.59 (2000) 127–134.[13] Faye B., Le guide de l’élevage du dromadaire,Sanofi ed., Libourne, France, 1997, 126 p.[14] Faye B., Bengoumi M., Le dromadaire face àla sous-nutrition minérale: un aspect méconnude son adaptabilité aux conditions désertiques,Revue Sécheresse 11 (2000) 155–161.[15] Faye B., Bengoumi M., Viateau E., TourretM., Chilliard Y., Adipocyte patterns of adiposetissue in camel hump and kidney, J.Camel Pract. Res. 8 (2001) 29–33.[16] Faye B., Bengoumi M., Messad S., ChilliardY., Estimation des réserves corporelles chez ledromadaire, Rev. Élev. Méd. Vét. Pays Trop.55 (2002) 69–78.[17] Guerouali A., Wardeh M.F., Assessing nutrientsrequirements and limits to production ofthe camel under simulated natural environment,Camel Newsletter 15 (1998) 32–42.[18] Hidane K., Moujjani Z., Zardoune M., KaribH., Bengoumi M., Camel meat quality.Advance course: Improvement of camel production,CIHEAM-IAV Hassan II, Rabat,Morocco, 2002, 45 p.[19] Hood R.L., Relationship among growth, adiposecell size and lipid metabolism in ruminantadipose tissue, Fed. Proc. 41 (1982)2555–2561.
Feeding level and camel hump size and cellularity 393[20] Ihaka R., Genleman R., A language for dataanalysis and graphics, J. Comput. Graph. 5(1996) 299–314.[21] Kadim I.T., Mahgoub O., Al-Maqbaly R.S.,Annamalai K., Al-Ajmi D.S., Effects of ageon fatty acid composition of the hump andabdomen depot fats of the arabian camel(Camelus dromedarius), Meat Sci. 62 (2002)245–251.[22] Kamili A., Étude de la relation entre certainesmesures barymétriques, le poids vif et le poidsde la bosse et de certains organes chez le dromadaire,Thèse Méd. Vét., IAV Hassan II,Rabat, Morocco, 2003, 134 p.[23] Robelin J., Cellularity of bovine adipose tissues:developmental changes from 15 to 65percent mature weight, J. Lipid. Res. 22(1981) 452–457.[24] Robelin J., Agabriel J., Estimation de l’étatd’engraissement des bovins vivants et de lataille des cellules adipeuses, Bull. Tech.CRZV Theix 66 (1986) 34–41.[25] Robelin J., Chilliard Y., Agabriel J., Estimationof body lipids and proteins of HolsteinCharolaise and Limousine cows by dilutiontechnique and adipose cell size, in: Van derHoning Y., Close W.H. (Eds.), Proceedings ofthe 11th Symposium Energy Metabolism ofFarm <strong>Animal</strong>s, EAAP Publication, Pudoc,Wageningen, 1989, Vol. 43, pp. 370–373.[26] Robelin J., Casteilla L., Différenciation,croissance et développement du tissu adipeux,INRA Prod. Anim. 3 (1990) 243–252.[27] Sebastian I., Chilliard Y., Jaime C., Purroy A.,Variations du volume des adipocytes et de lanote d'état corporel chez la brebis RasaAragonesa pendant la lactation et après letarissement, Ann. Zootech. 38 (1989) 83–90.[28] Sebastian I., Chilliard Y., Purroy A., Jaime C.,Supplémentation en céréales, état corporel etenzymes lipogéniques du tissu adipeux chez labrebis Aragonesa, Ann. Zootech. 42 (1993)299–313.[29] Smith S.B., Prior R.L., Koong L.J., MersmannH.J., Nitrogen and lipid metabolism in heifersfed at increasing levels of intake, J. Anim. Sci.70 (1992) 152–160.[30] Wardeh M.F., The nutrients requirements ofthe dromedary camels, The camel appliedresearch and development network, CARDN/ACSAD/ CAMEL/p29/1997, Damascus (Syria),1997, 97 p.[31] Wilson R.T., Ecophysiology of the camelidaeand desert ruminants, Springer Verlag, Berlin,1989, 120 p.[32] Yagil R., The desert camel: comparative physiologicaladaptation, in: Karger (Ed.), Comparativeanimal nutrition, Basel, 1985, 163 p.To access this journal online:www.edpsciences.org