Financial Review - Annual Report 2012 - Vedanta Resources
Financial Review - Annual Report 2012 - Vedanta Resources
Financial Review - Annual Report 2012 - Vedanta Resources

Create successful ePaper yourself
Turn your PDF publications into a flip-book with our unique Google optimized e-Paper software.
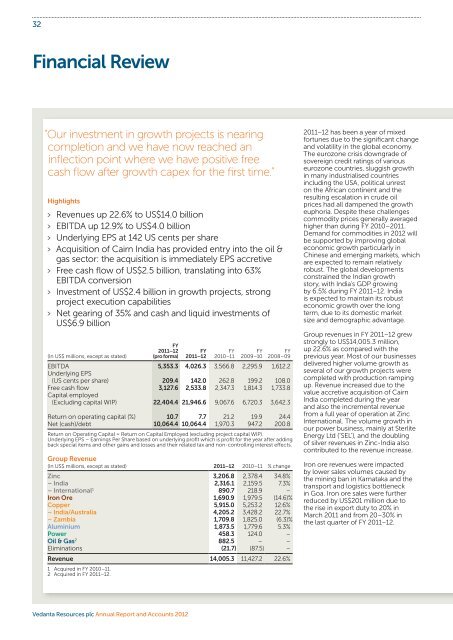
32<strong>Financial</strong> <strong>Review</strong>“Our investment in growth projects is nearingcompletion and we have now reached aninflection point where we have positive freecash flow after growth capex for the first time.”Highlights> Revenues up 22.6% to US$14.0 billion> EBITDA up 12.9% to US$4.0 billion> Underlying EPS at 142 US cents per share> Acquisition of Cairn India has provided entry into the oil &gas sector: the acquisition is immediately EPS accretive> Free cash flow of US$2.5 billion, translating into 63%EBITDA conversion> Investment of US$2.4 billion in growth projects, strongproject execution capabilities> Net gearing of 35% and cash and liquid investments ofUS$6.9 billion(In US$ millions, except as stated)FY2011–12(pro forma)FY2011–12FY2010–11FY2009–10FY2008–09EBITDA 5,353.3 4,026.3 3,566.8 2,295.9 1,612.2Underlying EPS(US cents per share) 209.4 142.0 262.8 199.2 108.0Free cash flow 3,127.6 2,533.8 2,347.3 1,814.3 1,733.8Capital employed(Excluding capital WIP) 22,404.4 21,946.6 9,067.6 6,720.3 3,642.3Return on operating capital (%) 10.7 7.7 21.2 19.9 24.4Net (cash)/debt 10,064.4 10,064.4 1,970.3 947.2 200.8Return on Operating Capital = Return on Capital Employed (excluding project capital WIP).Underlying EPS – Earnings Per Share based on underlying profit which is profit for the year after addingback special items and other gains and losses and their related tax and non-controlling interest effects.Group Revenue(In US$ millions, except as stated) 2011–12 2010–11 % changeZinc 3,206.8 2,378.4 34.8%– India 2,316.1 2,159.5 7.3%– International 1 890.7 218.9 –Iron Ore 1,690.9 1,979.5 (14.6)%Copper 5,915.0 5,253.2 12.6%– India/Australia 4,205.2 3,428.2 22.7%– Zambia 1,709.8 1,825.0 (6.3)%Aluminium 1,873.5 1,779.6 5.3%Power 458.3 124.0 –Oil & Gas 2 882.5 – –Eliminations (21.7) (87.5) –Revenue 14,005.3 11,427.2 22.6%1 Acquired in FY 2010–11.2 Acquired in FY 2011–12.2011–12 has been a year of mixedfortunes due to the significant changeand volatility in the global economy.The eurozone crisis downgrade ofsovereign credit ratings of variouseurozone countries, sluggish growthin many industrialised countriesincluding the USA, political unreston the African continent and theresulting escalation in crude oilprices had all dampened the growtheuphoria. Despite these challengescommodity prices generally averagedhigher than during FY 2010–2011.Demand for commodities in <strong>2012</strong> willbe supported by improving globaleconomic growth particularly inChinese and emerging markets, whichare expected to remain relativelyrobust. The global developmentsconstrained the Indian growthstory, with India’s GDP growingby 6.5% during FY 2011–12. Indiais expected to maintain its robusteconomic growth over the longterm, due to its domestic marketsize and demographic advantage.Group revenues in FY 2011–12 grewstrongly to US$14,005.3 million,up 22.6% as compared with theprevious year. Most of our businessesdelivered higher volume growth asseveral of our growth projects werecompleted with production rampingup. Revenue increased due to thevalue accretive acquisition of CairnIndia completed during the yearand also the incremental revenuefrom a full year of operation at ZincInternational. The volume growth inour power business, mainly at SterliteEnergy Ltd (‘SEL’), and the doublingof silver revenues in Zinc-India alsocontributed to the revenue increase.Iron ore revenues were impactedby lower sales volumes caused bythe mining ban in Karnataka and thetransport and logistics bottleneckin Goa. Iron ore sales were furtherreduced by US$201 million due tothe rise in export duty to 20% inMarch 2011 and from 20–30% inthe last quarter of FY 2011–12.<strong>Vedanta</strong> <strong>Resources</strong> plc <strong>Annual</strong> <strong>Report</strong> and Accounts <strong>2012</strong>
33 OVERVIEW STRATEGY PERFORMANCE GOVERNANCE FINANCIALSGroup EBITDA(In US$ millions, except as stated)Turbulence in the global market andthe cost-inflationary environmentprevailing in the metal and miningindustry impacted our profitabilityin FY 2011–12. During the year, totalcash costs increased due to miningsector inflation stemming fromincreased energy and fuel coststogether with higher maintenance,labour and contractor costs, in linewith the mining industry in general.The EBITDA margin in our aluminiumbusiness reduced by 10.1%, dueto an 11.3% increase in cost ofproduction mainly due to higheralumina, carbon and coal costs. TheEBITDA margin also reduced in ourpower business due to an 18.6%reduction in the sales price per unit.Despite these tough conditions, wereported EBITDA of US$4.0 billion,12.9% higher when compared withthe previous year, underpinnedby our diversified businessportfolio which helps to insulateus from adverse performancein any one of our businesses.Our diversification into the highmargin oil & gas sector through ouracquisition of Cairn India duringthe year and the full year benefit ofoperations from the Zinc-Internationalbusiness acquired in FY 2010–11,combined with our continuedfocus on cost control measuresand operational improvements alsocontributed to the improvementin EBITDA for FY 2011–12.FY2011–12FY2010–11 % changeEBITDAMargin %2011–12However, EBITDA growth did notkeep pace with revenue growthas operating costs rose, mainlydue to higher coal costs andcommodity linked costs. Lowersales of iron ore coupled with thehike in export duty also impactedEBITDA during the financial year.EBITDAMargin %2010–11Zinc 1,610.8 1,320.9 21.9% – –– India 1,244.8 1,219.6 2.1% 53.7% 56.7%– International 1 366.0 101.3 – 41.1% 46.3%Iron Ore 721.4 1,174.1 (38.6)% 42.7% 59.3%Copper 685.9 681.4 0.7% – –– India/Australia 298.0 241.5 23.4% 7.1% 7.0%– Zambia 387.9 439.9 (11.8)% 22.7% 24.1%Aluminium 182.5 352.7 (48.3)% 9.7% 19.8%Power 122.0 43.9 177.9% 26.6% 35.4%Oil & Gas 2 713.0 0.0 – 80.8% –Others (9.3) (6.2) (50%) – –Total 4,026.3 3,566.8 12.9% 28.7% 31.2%1 Acquired in FY 2010–11.2. Acquired in FY 2011–12.EBITDA margin was 28.7% in FY2011–12 compared with 31.2% inFY 2010–11. Excluding our coppercustom smelting operations, ourEBITDA margin in FY 2011–12 was40.6% (FY 2010–11: 44.6%).Conversion of EBITDA to free cashflow for the financial year wasmarginally lower at 62.9% comparedwith 65.8% in FY 2010–11. Thisreduction is mainly attributable tohigher interest on borrowing for theCairn India acquisition and higherongoing capital expenditure.We continued to maintain our strongbalance sheet and funding position,with cash and liquid investmentstotalling US$6.9 billion. We generatedfree cash flow of US$2.5 billion whichmet the growth capital expenditurerequirement of US$2.4 billion. Ourinvestment in growth projects isnearing completion and we have nowreached an inflection point wherewe have positive free cash flow aftergrowth capex for the first time.After investing US$8.7 billion inacquisitions, net debt as at 31March <strong>2012</strong> was US$10.1 billion(31 March 2011: US$1.97 billion)and our gearing ratio was 35%.During the year depreciationand amortisation increased byUS$539.3 million to US$1.4 billion.Depreciation charges during theyear increased by US$372.7 millionmainly due to additional depreciationof US$180.2 million for Cairn,US$90.7 million due to the full year ofoperation for Zinc International andthe commissioning of the SEL powerplant accounting for the balance.Amortisation charges during theyear increased by US$166.6 millionmainly due to additional amortisationof reserves of US$166.5 millionat Cairn, US$92.4 million at ZincInternational, partially mitigatedby a decrease at Sesa Goa due tolower output. Oil & gas assets areamortised on a unit of productionbasis over the total remainingproven and probable reserves.Special items comprises of US$21million spent on voluntary redundancycharges at some of our operations.A provision of US$89 million wasmade by Sterlite towards possibleincidental damages payable toASARCO as per the verdict of thebankruptcy court of the SouthernDistrict of Texas, US. We also spentUS$73 million on costs relating tothe acquisition of Cairn India andIPO expenses of US$13 million,for our subsidiary Konkola CopperMines were also written off duringthe year. US$31 million was due toloss on revaluation of previously heldinterest in Cairn India as associate.As explained above, the operatingprofit for the year was US$2.4 billion,marginally lower than in the previousyear reflecting higher depreciation,amortisation charges and specialitems, despite the increase in EBITDA.<strong>Vedanta</strong> <strong>Resources</strong> plc <strong>Annual</strong> <strong>Report</strong> and Accounts <strong>2012</strong>vedantaresources.com
34<strong>Financial</strong> <strong>Review</strong> continuedGroup Operating ResultsGroup operating results for FY 2011–12 are set out below:FY(In US$ millions, except as stated)2011–12(pro forma)FY2011–12FY2010–11 % changeRevenue 15,615.9 14,005.3 11,427.2 22.6EBITDA 5,353.3 4,026.3 3,566.8 12.9EBITDA margin (%) 34.3% 28.7% 31.2% –EBITDA margin without custom smelting (%) 46.7% 40.6% 44.7% –Special items (230.2) (230.2) (163.4) (40.9)Depreciation (1,220.7) (927.3) (554.6) (67.2)Amortisation (736.8) (481.1) (314.5) (53.0)Operating profit 3,165.6 2,387.7 2,534.3 (5.8)Net interest expense (617.1) (420.3) (103.1) (307.7)Other gains and (losses) (314.2) (314.2) 252.1 (224.6)Income from associate – 92.2 – –Profit before taxation 2,234.3 1,745.4 2,683.3 (35.0)Income tax expense (547.4) (516.7) (649.5) (20.4)Effective tax rate (%) 24.5% 29.6% 24.2% -Profit for the year 1,686.9 1,228.7 2,033.8 (39.6)Minority interest 1,478.9 1,168.9 1,263.0 (7.5)Minority interest (%) 87.7% 95.1% 62.1% –Attributable profit 208.0 59.8 770.8 (92.2)Basic earnings per share(US cents per share) 76.3 21.9 283.2 (92.3)Underlying earnings per share(US cents per share) 209.4 142.0 262.8 (46.0)By contrast, we experienced a markto-marketgains on our embeddedderivatives of US$97.1 millionprimarily on the foreign currencyconvertible bonds at Sterlite andSesa Goa. Since the issue of thesebonds the cumulative gain has beenUS$211.0 million. The gain is primarilycorrelated with the movement in therespective subsidiary’s share priceand may reverse in the future.Profit before taxation also decreasedby 35.0% to US$1.7 billion comparedagainst US$2.7 billion achievedduring FY 2010–11. Profit after taxdecreased by 39.6% to US$1.2 billiondue to higher interest costs, mark-tomarketlosses on our foreign currencyborrowings and higher tax rates. Oureffective tax rate increased from 24.2%in FY 2010–11 to 29.6% during FY2011–12 as a result of changes in profitmix at the operating companies duringthe year and also due to losses at VAL.The tax charge decreased to US$516.7million in FY 2011–12, 20% downfrom US$649.5 million in FY 2010–11reflecting the lower profit before tax.Gross finance costs increased toUS$1,170.5 million in FY 2011–12,up from US$718.0 million in FY2010–11. Costs increased as aresult of higher average debt atUS$13,750.4 million in FY 2011–12,up from US$8,895.7 million in theprevious year. Gross debt during theyear increased mainly to finance theCairn India acquisition and to fundour growth projects. Interest costsalso increased due to a higher interestrate for rupee borrowing in India.Of the total interest cost, US$224.8million relating to our ongoing capitalexpansion projects was capitalised ascompared with US$183.3 million inFY 2010–11, reflecting the increasedcapitalisation in our ongoingprojects at <strong>Vedanta</strong> Aluminium Ltd(VAL), BALCO and Talwandi Sabo.Investment income in FY 2011–12was US$525.4 million, comparedwith US$431.6 million in FY2010–11, mainly due to the higherinterest rate environment.We recognised a loss of US$314.2million as a result of mark-to-marketlosses on our foreign currencyborrowings primarily at our Indianentities, and following changesin the fair value of embeddedderivatives relating to foreign currencyconvertible bonds at Sterlite andSesa Goa. During FY 2011–12, themark-to-market loss on borrowingswas US$411.3 million against a gainof US$63.7 million in the previousyear. These mark-to-market losseswere caused by volatility in theIndian rupee/dollar exchange rate,which depreciated sharply by 14.7%in the year, moving from US$1 =Rs44.65 to US$1 = Rs51.16. The rupeedepreciation impacted the uncoveredloans denominated in US dollars.Attributable profit for the year atUS$59.8 million is significantlylower than the US$770.8 millionin the previous year which wasimpacted by increased amortisationand depreciation charges, interestexpenses related to funding forthe Cairn India acquisition, markto-marketlosses on foreigncurrency borrowings at our Indianentities and losses at VAL.Basic Earnings per Share (‘EPS) forFY 2011–12 was 21.9 US cents pershare compared to 283.2 US centsper share in FY 2010–11, reflectingthe fall in attributable profit. Fullydiluted EPS was 21.6 US cents pershare (FY 2010–11: 270.2 US cents pershare). Underlying EPS was 142.0 UScents per share as against 262.8 UScents per share in the previous year.These factors, combined with thefact that Cairn India only contributedto profitability for less than fourmonths, resulted in returns generatedon operating capital reducing to7.7%. Using 12 month proformaearnings from Cairn, our return onoperating capital would be 10.7%.<strong>Vedanta</strong> <strong>Resources</strong> plc <strong>Annual</strong> <strong>Report</strong> and Accounts <strong>2012</strong>
35 OVERVIEW STRATEGY PERFORMANCE GOVERNANCE FINANCIALSBalance Sheet and Cash FlowWe continue to have a strongbalance sheet with capital employedof US$18.4 billion and net debt ofUS$10.1 billion. Net debt compriseddebt of US$17.0 billion offset byUS$6.9 billion of cash and liquidinvestments. Anticipated futurecash flows and undrawn committedfacilities of US$2,897.3 million,together with cash and liquidinvestments of US$6,885.3 millionas at 31 March <strong>2012</strong>, are expectedto be sufficient to meet the ongoingcapital investment programme andliquidity requirements of the Groupin the near future. The Companycontinued to maintain its ratingsfrom Standard & Poor’s, Moody’s &Fitch Ratings are BB, Ba1 and BB+respectively. The Company generallymaintains a healthy net debt-equityratio and retains flexibility to raisefunds as and when required. Eventhough FY 2011–12 witnessed arise in debt of US$7.2 billion to fundthe Cairn India acquisition andplanned expansion programme,our balance sheet remained strongwith net gearing of 35.3%.The movement in net (debt)/cash in FY 2011–12 is set out below.FY(In US$ millions, except as stated)2011–12FY2010–11EBITDA 4,026.3 3,566.8Operating exceptional items (230.2) (163.4)Working capital movements 439.2 (652.0)Increase in operational buyer’s credit 60.1 12.5Increase/(decrease) in supplier’s credit (124.2) 335.3Changes in long-term creditors and non-cash items 35.8 128.8Sustaining capital expenditure (386.2) (239.5)Sale of tangible fixed assets 23.6 28.3Net interest paid and dividend received (394.8) 87.1Tax paid (915.8) (756.6)Free cash flow 2,533.8 2,347.3Expansion capital expenditure 1 (2,398.2) (2,517.2)Sale/(purchase) of fixed assets investments (3.9) (25.9)Acquisition of minorities (60.3) (122.0)Acquisitions, net of cash & liquid investments acquired (7,115.7) (1,036.7)Purchase of mining assets (131.8) –Buyback of shares of <strong>Vedanta</strong> <strong>Resources</strong> plc – (128.0)Dividends paid to equity shareholders (144.0) (129.9)Dividends paid to minority shareholders (219.7) (87.4)Convertible Bond transfer and conversion – 430.2Other movement 2 (554.3) 246.5Movement in net (debt)/cash (8,094.1) (1,023.1)1 On an accrual basis.2 Includes foreign exchange movements.On a proforma basis, as at 31 March<strong>2012</strong>, we had a multiple of 1.9xnet debt/EBITDA, 4.5x EBITDA/gross interest expenses and 2.5xnet asset/debt, which reflects arobust and strong balance sheet.Of our total gross debt of US$17.0billion, debt at our subsidiaries isUS$7.7 billion with the balancein the holding company.Following the Group structuresimplification, debt liability at theholding company reduced by65% to US$3.2 billion and debtservice costs reduced significantly.Dividend policies at subsidiarieswill result in significantly higherdividends at the holding companywhich will cover debt servicing.Finance StrategyThe Company’s capital managementobjectives are to safeguard continuity,maintain a strong credit rating andhealthy capital ratios in order tosupport its business and provideadequate return to shareholdersthrough continuing growth.The Company sets the amount ofcapital required on the basis of annualbusiness and long-term operatingplans which include capital andother strategic investments. Thefunding requirement is met througha mixture of equity, internal accruals,convertible bonds and other longtermand short-term borrowings.The Company monitors capital usinga gearing ratio, (the ratio of net debtas a percentage of total capital)which at 31 March <strong>2012</strong> was 35.3%.Our investments are consistent withour policy of investing in funds andbanks with a low credit risk and highcredit ratings. Investment portfoliosof our Indian subsidiaries have beenindependently reviewed by the ratingagency CRISIL as “Very Good”.We believe our strengtheningpresence across diverse businessesshould further strengthenour credit profile and we areworking towards improving ourratings to investment grade.Post the acquisition of Cairn India,our priority is to reduce the debt atthe holding company level. We arecommitted to maintain net debt toEBITDA at less than 2.75 times and netgearing below 40% through the cycle,as a prudent measure in our cyclicalindustry. We achieved net debt toEBITDA of 2.5 times and net gearingof 35% at the end of FY 2011–12. In aneffort to further reduce these metrics,we continue to focus on higherEBITDA-free cash flow conversion byprioritising cost control and reviewingthe capital expenditure programme.We have also announced a newsimplified corporate structure, whichonce approved by stake holders andregulatory authorities, should yieldsignificant benefits through a moreefficient capital structure, increasedflexibility to allocate capital, broaderaccess to markets and enhancedvisibility of earnings and cash flow.<strong>Vedanta</strong> <strong>Resources</strong> plc <strong>Annual</strong> <strong>Report</strong> and Accounts <strong>2012</strong>vedantaresources.com
36<strong>Financial</strong> <strong>Review</strong> continuedProject CapexSector Project Production volume Country Completion date Project costAlumina Lanjigarh I Alumina Refinery 1.0mtpa India Completed 1,015.3Debottlenecking Lanjigarh I 1.0mtpa India On hold 150.0Lanjigarh II Alumina Refinery 3.0mtpa India On hold 1,570.0Aluminium Korba III Smelter 325 KT India 1st metal tapping by Q3 FY <strong>2012</strong>–13 720.01200MW CPP1st unit synchronisation in Q1 FY1,100.0<strong>2012</strong>–13Jharsuguda I Smelter 0.5mtpa & 1215MW CPP India Completed 2,400.0Jharsuguda II Smelter 1.25mtpa India Progressively by Q3 FY 2013–14 2,920.0Balco Coal Block 211mt India Progressively by FY <strong>2012</strong>–13 150.0Power Talwandi Sabo Power Project 1,980MW India FY 2013–14 (1st unit synchronisation in 2,150.0Q4 FY <strong>2012</strong>–13)HZL WPP Project 150MW India Completed 190.0SEL IPP 2,400MW India 4th unit synchronised in Q4 FY 2011–12 1,900.0Zinc Smelting 210ktpa Zinc India Completed 900.0100ktpa Lead India Completed160MW CPP India CompletedMining RA 5 to 6mtpa India CompletedSK –2mtpa India ProgressiveCopper KCM KDMP Project 7.5mtpa Zambia Q3 FY <strong>2012</strong>–13 973.0KCM Nchanga Smelter 311ktpa Zambia Completed 473.0SIIL Expansion Project 400ktpa India EC awaited 367.2160MW CPP India 1st unit in Q1 FY <strong>2012</strong>–13, 2nd unit inQ2 FY <strong>2012</strong>–13132.8Iron Ore Pig Iron Expansion 375ktpa India Q1 FY 2013 150.0Sesa Iron Ore Mine Expansion 36mt India FY <strong>2012</strong>–13 500.0Infrastructure Vizag Coal Berth India FY <strong>2012</strong>–13 150.0Paradeep Port India – 88.0Total 17,999.3Other projectsTotal 17,999.3The conversion of EBITDA to freecash was at the rate of 62.9% in FY2011–12 as compared to 65.8% inFY 2010–11. This decline, despitethe release of working capital ofapproximately US$375.1 million,was due to higher routine capitalexpenditure and interest payments.Investing in Organic GrowthWe spent US$2,398.2 million oncapital expenditure for growthprojects in FY 2011–12 whichwas in line with our projectcapital expenditure spend in FY2010–11. During the last fiveyears we have invested US$12.6billion in growth projects.In its Power business, theCompany has decided to pursueonly the 1,980MW (3x660MW)thermal coal based power plantat Talwandi Sabo and the projectwork is progressing well.We also spent US$386.2 million onroutine capital expenditure in FY2011–12, higher than the previousyear’s expenditure of US$239.5million. This expenditure is for theupkeep of our plant and equipment,to continually optimise and improveoperational standards and to increasethe scale of our operations.Return on Operating Capital (‘ROOC’)during FY 2011–12 was 7.7%, lowerthan the 21.2% generated during FY2010–11. This reflected the fact thatthe investment in Cairn generatedreturns for a period of less thanfour months (as a subsidiary from 8December 2011). On an annualisedbasis, the returns from Cairn stoodat 10.7% during the year. ROOCis an important Key PerformanceIndicator (‘KPI’) for our businesses.Capital productivity is a high priorityand we plan to enhance this ratioby optimising asset performance.<strong>Vedanta</strong> <strong>Resources</strong> plc <strong>Annual</strong> <strong>Report</strong> and Accounts <strong>2012</strong>
37 OVERVIEW STRATEGY PERFORMANCE GOVERNANCE FINANCIALSSpent inFY12Spent to31 March 12Unspent on31 March 12– 982.0 33.31.4 73.7 76.320.6 825.2 744.8248.4 596.1 123.9128.3 803.8 296.2– 2,324.4 75.6305.5 2,280.8 639.27.2 12.0 138.0612.0 973.5 1,176.5113.9 190.0 –136.1 1,651.7 248.346.6 799.8 100.233.4 830.2 142.811.8 472.3 0.72.7 109.8 257.4– 150.0 –54.3 138.7 11.351.9 128.9 371.139.0 58.7 91.3– – 88.01,889.7 13,377.0 4,622.3508.5 558.92,398.2 13,935.9Based on the expansion projectscurrently under way, approximatelyUS$4.6 billion of funds are requiredto complete these projects over thenext three years. This will be financedfrom existing cash resources, internalaccruals and project financing.Our debt maturity now averages 3.46 years as at 31 March <strong>2012</strong>, as comparedwith three years as at 31 March 2011. Our current debt maturity profile inUS$ million is outlined below:Debt at Plc Debt atParticularsCompanies Subsidiaries TotalFY <strong>2012</strong>–13 996 3,156 4,152FY 2013–14 1,950 456 2,406FY 2014–15 1,383 1,079 2,462FY 2015–16 310 410 720FY 2016–17 2,515 269 2,784FY 2017–18 onwards 2,121 2,310 4,431Total 9,275 7,680 16,955AcquisitionsOn 8 December 2011 we completedthe acquisition of Cairn India Limitedby acquiring 59% for an aggregateconsideration of US$8.67 billion.A 39% stake is held by <strong>Vedanta</strong><strong>Resources</strong> plc with the balancing20% stake held through the Group’ssubsidiary Sesa Goa. Roughly 50%of the acquisition consideration wasfunded through internally generatedcash flows, and only U$4.43 billionwas funded through external debt.In accordance with the requirement ofthe reverse takeover rules prescribedunder the UK Listing Authority (‘UKLA’),an application was made to the UKLAand the London Stock Exchangefor readmission to listing of theCompany’s shares on the official list.During the FY 2011–12, Sesa Goaacquired Iron Ore deposits in Liberia inWestern Africa for a total considerationof US$90 million. In addition US$25million of licence fees was paid tothe Government of Liberia. This ironore project comprises three depositsin Bomi Hills, Bea Mountain andMano River with estimated depositsof over 1 billion tonnes of iron ore.On 1 March <strong>2012</strong>, <strong>Vedanta</strong> <strong>Resources</strong>plc, through its subsidiary SesaGoa, acquired a 100% stake in GoaEnergy Private Limited (‘GEPL’) fromVideocon Industries at a considerationof US$9.5 million. The operating andfinancial results of GEPL have beenconsolidated from 1 March <strong>2012</strong>. GEPLis in the business of power generation.We continue to focus on enhancingthe returns to our shareholdersthrough periodic buyback ofshares. During FY 2011–12 wehad spent US$60.3 million onbuying back shares in Sterlite.The Government of India (‘GoI’)holds the minority stake in twoof our Group companies – HZL(29.5%) and BALCO (49%). In linewith our commitment to enhancethe returns to our shareholders, weapproached the GoI communicatingour desire to purchase its stake inboth companies. Whilst the GoI didnot respond, we believe purchasingthis stake would further improvethe returns to our stakeholders.In the coming year, US$4,152 millionof debt falls due for repayment. Ourcash and liquid investments, free cashgeneration and funds investment aresufficient to meet our capital anddebt commitments. We have cashand liquid investments of US$6,885.3million as at 31 March <strong>2012</strong> along withunused funding facilities of US$2,897.3million, providing good liquidity.<strong>Vedanta</strong> <strong>Resources</strong> plc <strong>Annual</strong> <strong>Report</strong> and Accounts <strong>2012</strong>vedantaresources.com