Financial Review - Annual Report 2012 - Vedanta Resources
Financial Review - Annual Report 2012 - Vedanta Resources
Financial Review - Annual Report 2012 - Vedanta Resources

Create successful ePaper yourself
Turn your PDF publications into a flip-book with our unique Google optimized e-Paper software.
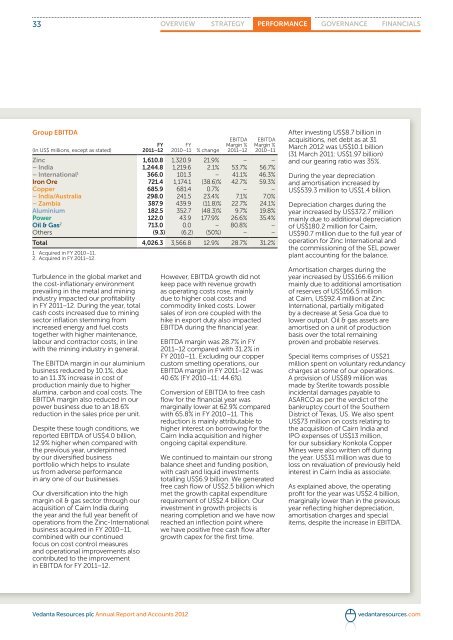
33 OVERVIEW STRATEGY PERFORMANCE GOVERNANCE FINANCIALSGroup EBITDA(In US$ millions, except as stated)Turbulence in the global market andthe cost-inflationary environmentprevailing in the metal and miningindustry impacted our profitabilityin FY 2011–12. During the year, totalcash costs increased due to miningsector inflation stemming fromincreased energy and fuel coststogether with higher maintenance,labour and contractor costs, in linewith the mining industry in general.The EBITDA margin in our aluminiumbusiness reduced by 10.1%, dueto an 11.3% increase in cost ofproduction mainly due to higheralumina, carbon and coal costs. TheEBITDA margin also reduced in ourpower business due to an 18.6%reduction in the sales price per unit.Despite these tough conditions, wereported EBITDA of US$4.0 billion,12.9% higher when compared withthe previous year, underpinnedby our diversified businessportfolio which helps to insulateus from adverse performancein any one of our businesses.Our diversification into the highmargin oil & gas sector through ouracquisition of Cairn India duringthe year and the full year benefit ofoperations from the Zinc-Internationalbusiness acquired in FY 2010–11,combined with our continuedfocus on cost control measuresand operational improvements alsocontributed to the improvementin EBITDA for FY 2011–12.FY2011–12FY2010–11 % changeEBITDAMargin %2011–12However, EBITDA growth did notkeep pace with revenue growthas operating costs rose, mainlydue to higher coal costs andcommodity linked costs. Lowersales of iron ore coupled with thehike in export duty also impactedEBITDA during the financial year.EBITDAMargin %2010–11Zinc 1,610.8 1,320.9 21.9% – –– India 1,244.8 1,219.6 2.1% 53.7% 56.7%– International 1 366.0 101.3 – 41.1% 46.3%Iron Ore 721.4 1,174.1 (38.6)% 42.7% 59.3%Copper 685.9 681.4 0.7% – –– India/Australia 298.0 241.5 23.4% 7.1% 7.0%– Zambia 387.9 439.9 (11.8)% 22.7% 24.1%Aluminium 182.5 352.7 (48.3)% 9.7% 19.8%Power 122.0 43.9 177.9% 26.6% 35.4%Oil & Gas 2 713.0 0.0 – 80.8% –Others (9.3) (6.2) (50%) – –Total 4,026.3 3,566.8 12.9% 28.7% 31.2%1 Acquired in FY 2010–11.2. Acquired in FY 2011–12.EBITDA margin was 28.7% in FY2011–12 compared with 31.2% inFY 2010–11. Excluding our coppercustom smelting operations, ourEBITDA margin in FY 2011–12 was40.6% (FY 2010–11: 44.6%).Conversion of EBITDA to free cashflow for the financial year wasmarginally lower at 62.9% comparedwith 65.8% in FY 2010–11. Thisreduction is mainly attributable tohigher interest on borrowing for theCairn India acquisition and higherongoing capital expenditure.We continued to maintain our strongbalance sheet and funding position,with cash and liquid investmentstotalling US$6.9 billion. We generatedfree cash flow of US$2.5 billion whichmet the growth capital expenditurerequirement of US$2.4 billion. Ourinvestment in growth projects isnearing completion and we have nowreached an inflection point wherewe have positive free cash flow aftergrowth capex for the first time.After investing US$8.7 billion inacquisitions, net debt as at 31March <strong>2012</strong> was US$10.1 billion(31 March 2011: US$1.97 billion)and our gearing ratio was 35%.During the year depreciationand amortisation increased byUS$539.3 million to US$1.4 billion.Depreciation charges during theyear increased by US$372.7 millionmainly due to additional depreciationof US$180.2 million for Cairn,US$90.7 million due to the full year ofoperation for Zinc International andthe commissioning of the SEL powerplant accounting for the balance.Amortisation charges during theyear increased by US$166.6 millionmainly due to additional amortisationof reserves of US$166.5 millionat Cairn, US$92.4 million at ZincInternational, partially mitigatedby a decrease at Sesa Goa due tolower output. Oil & gas assets areamortised on a unit of productionbasis over the total remainingproven and probable reserves.Special items comprises of US$21million spent on voluntary redundancycharges at some of our operations.A provision of US$89 million wasmade by Sterlite towards possibleincidental damages payable toASARCO as per the verdict of thebankruptcy court of the SouthernDistrict of Texas, US. We also spentUS$73 million on costs relating tothe acquisition of Cairn India andIPO expenses of US$13 million,for our subsidiary Konkola CopperMines were also written off duringthe year. US$31 million was due toloss on revaluation of previously heldinterest in Cairn India as associate.As explained above, the operatingprofit for the year was US$2.4 billion,marginally lower than in the previousyear reflecting higher depreciation,amortisation charges and specialitems, despite the increase in EBITDA.<strong>Vedanta</strong> <strong>Resources</strong> plc <strong>Annual</strong> <strong>Report</strong> and Accounts <strong>2012</strong>vedantaresources.com