35 OVERVIEW STRATEGY PERFORMANCE GOVERNANCE FINANCIALSBalance Sheet and Cash FlowWe continue to have a strongbalance sheet with capital employedof US$18.4 billion and net debt ofUS$10.1 billion. Net debt compriseddebt of US$17.0 billion offset byUS$6.9 billion of cash and liquidinvestments. Anticipated futurecash flows and undrawn committedfacilities of US$2,897.3 million,together with cash and liquidinvestments of US$6,885.3 millionas at 31 March <strong>2012</strong>, are expectedto be sufficient to meet the ongoingcapital investment programme andliquidity requirements of the Groupin the near future. The Companycontinued to maintain its ratingsfrom Standard & Poor’s, Moody’s &Fitch Ratings are BB, Ba1 and BB+respectively. The Company generallymaintains a healthy net debt-equityratio and retains flexibility to raisefunds as and when required. Eventhough FY 2011–12 witnessed arise in debt of US$7.2 billion to fundthe Cairn India acquisition andplanned expansion programme,our balance sheet remained strongwith net gearing of 35.3%.The movement in net (debt)/cash in FY 2011–12 is set out below.FY(In US$ millions, except as stated)2011–12FY2010–11EBITDA 4,026.3 3,566.8Operating exceptional items (230.2) (163.4)Working capital movements 439.2 (652.0)Increase in operational buyer’s credit 60.1 12.5Increase/(decrease) in supplier’s credit (124.2) 335.3Changes in long-term creditors and non-cash items 35.8 128.8Sustaining capital expenditure (386.2) (239.5)Sale of tangible fixed assets 23.6 28.3Net interest paid and dividend received (394.8) 87.1Tax paid (915.8) (756.6)Free cash flow 2,533.8 2,347.3Expansion capital expenditure 1 (2,398.2) (2,517.2)Sale/(purchase) of fixed assets investments (3.9) (25.9)Acquisition of minorities (60.3) (122.0)Acquisitions, net of cash & liquid investments acquired (7,115.7) (1,036.7)Purchase of mining assets (131.8) –Buyback of shares of <strong>Vedanta</strong> <strong>Resources</strong> plc – (128.0)Dividends paid to equity shareholders (144.0) (129.9)Dividends paid to minority shareholders (219.7) (87.4)Convertible Bond transfer and conversion – 430.2Other movement 2 (554.3) 246.5Movement in net (debt)/cash (8,094.1) (1,023.1)1 On an accrual basis.2 Includes foreign exchange movements.On a proforma basis, as at 31 March<strong>2012</strong>, we had a multiple of 1.9xnet debt/EBITDA, 4.5x EBITDA/gross interest expenses and 2.5xnet asset/debt, which reflects arobust and strong balance sheet.Of our total gross debt of US$17.0billion, debt at our subsidiaries isUS$7.7 billion with the balancein the holding company.Following the Group structuresimplification, debt liability at theholding company reduced by65% to US$3.2 billion and debtservice costs reduced significantly.Dividend policies at subsidiarieswill result in significantly higherdividends at the holding companywhich will cover debt servicing.Finance StrategyThe Company’s capital managementobjectives are to safeguard continuity,maintain a strong credit rating andhealthy capital ratios in order tosupport its business and provideadequate return to shareholdersthrough continuing growth.The Company sets the amount ofcapital required on the basis of annualbusiness and long-term operatingplans which include capital andother strategic investments. Thefunding requirement is met througha mixture of equity, internal accruals,convertible bonds and other longtermand short-term borrowings.The Company monitors capital usinga gearing ratio, (the ratio of net debtas a percentage of total capital)which at 31 March <strong>2012</strong> was 35.3%.Our investments are consistent withour policy of investing in funds andbanks with a low credit risk and highcredit ratings. Investment portfoliosof our Indian subsidiaries have beenindependently reviewed by the ratingagency CRISIL as “Very Good”.We believe our strengtheningpresence across diverse businessesshould further strengthenour credit profile and we areworking towards improving ourratings to investment grade.Post the acquisition of Cairn India,our priority is to reduce the debt atthe holding company level. We arecommitted to maintain net debt toEBITDA at less than 2.75 times and netgearing below 40% through the cycle,as a prudent measure in our cyclicalindustry. We achieved net debt toEBITDA of 2.5 times and net gearingof 35% at the end of FY 2011–12. In aneffort to further reduce these metrics,we continue to focus on higherEBITDA-free cash flow conversion byprioritising cost control and reviewingthe capital expenditure programme.We have also announced a newsimplified corporate structure, whichonce approved by stake holders andregulatory authorities, should yieldsignificant benefits through a moreefficient capital structure, increasedflexibility to allocate capital, broaderaccess to markets and enhancedvisibility of earnings and cash flow.<strong>Vedanta</strong> <strong>Resources</strong> plc <strong>Annual</strong> <strong>Report</strong> and Accounts <strong>2012</strong>vedantaresources.com
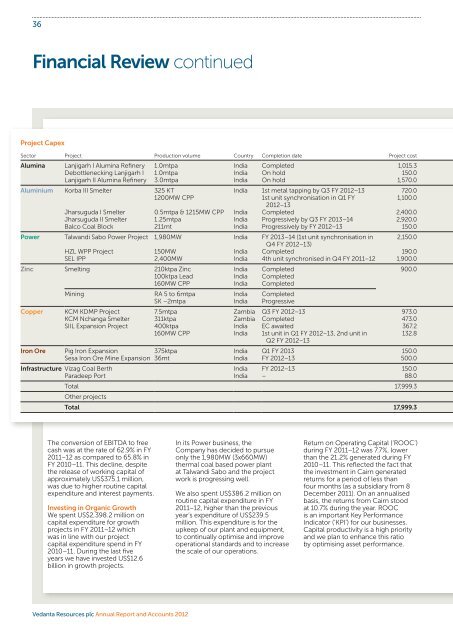
36<strong>Financial</strong> <strong>Review</strong> continuedProject CapexSector Project Production volume Country Completion date Project costAlumina Lanjigarh I Alumina Refinery 1.0mtpa India Completed 1,015.3Debottlenecking Lanjigarh I 1.0mtpa India On hold 150.0Lanjigarh II Alumina Refinery 3.0mtpa India On hold 1,570.0Aluminium Korba III Smelter 325 KT India 1st metal tapping by Q3 FY <strong>2012</strong>–13 720.01200MW CPP1st unit synchronisation in Q1 FY1,100.0<strong>2012</strong>–13Jharsuguda I Smelter 0.5mtpa & 1215MW CPP India Completed 2,400.0Jharsuguda II Smelter 1.25mtpa India Progressively by Q3 FY 2013–14 2,920.0Balco Coal Block 211mt India Progressively by FY <strong>2012</strong>–13 150.0Power Talwandi Sabo Power Project 1,980MW India FY 2013–14 (1st unit synchronisation in 2,150.0Q4 FY <strong>2012</strong>–13)HZL WPP Project 150MW India Completed 190.0SEL IPP 2,400MW India 4th unit synchronised in Q4 FY 2011–12 1,900.0Zinc Smelting 210ktpa Zinc India Completed 900.0100ktpa Lead India Completed160MW CPP India CompletedMining RA 5 to 6mtpa India CompletedSK –2mtpa India ProgressiveCopper KCM KDMP Project 7.5mtpa Zambia Q3 FY <strong>2012</strong>–13 973.0KCM Nchanga Smelter 311ktpa Zambia Completed 473.0SIIL Expansion Project 400ktpa India EC awaited 367.2160MW CPP India 1st unit in Q1 FY <strong>2012</strong>–13, 2nd unit inQ2 FY <strong>2012</strong>–13132.8Iron Ore Pig Iron Expansion 375ktpa India Q1 FY 2013 150.0Sesa Iron Ore Mine Expansion 36mt India FY <strong>2012</strong>–13 500.0Infrastructure Vizag Coal Berth India FY <strong>2012</strong>–13 150.0Paradeep Port India – 88.0Total 17,999.3Other projectsTotal 17,999.3The conversion of EBITDA to freecash was at the rate of 62.9% in FY2011–12 as compared to 65.8% inFY 2010–11. This decline, despitethe release of working capital ofapproximately US$375.1 million,was due to higher routine capitalexpenditure and interest payments.Investing in Organic GrowthWe spent US$2,398.2 million oncapital expenditure for growthprojects in FY 2011–12 whichwas in line with our projectcapital expenditure spend in FY2010–11. During the last fiveyears we have invested US$12.6billion in growth projects.In its Power business, theCompany has decided to pursueonly the 1,980MW (3x660MW)thermal coal based power plantat Talwandi Sabo and the projectwork is progressing well.We also spent US$386.2 million onroutine capital expenditure in FY2011–12, higher than the previousyear’s expenditure of US$239.5million. This expenditure is for theupkeep of our plant and equipment,to continually optimise and improveoperational standards and to increasethe scale of our operations.Return on Operating Capital (‘ROOC’)during FY 2011–12 was 7.7%, lowerthan the 21.2% generated during FY2010–11. This reflected the fact thatthe investment in Cairn generatedreturns for a period of less thanfour months (as a subsidiary from 8December 2011). On an annualisedbasis, the returns from Cairn stoodat 10.7% during the year. ROOCis an important Key PerformanceIndicator (‘KPI’) for our businesses.Capital productivity is a high priorityand we plan to enhance this ratioby optimising asset performance.<strong>Vedanta</strong> <strong>Resources</strong> plc <strong>Annual</strong> <strong>Report</strong> and Accounts <strong>2012</strong>


