Structure of molybdenum oxide supported on silica SBA-15 studied ...
Structure of molybdenum oxide supported on silica SBA-15 studied ...
Structure of molybdenum oxide supported on silica SBA-15 studied ...

You also want an ePaper? Increase the reach of your titles
YUMPU automatically turns print PDFs into web optimized ePapers that Google loves.
<str<strong>on</strong>g>Structure</str<strong>on</strong>g> <str<strong>on</strong>g>of</str<strong>on</strong>g> <str<strong>on</strong>g>molybdenum</str<strong>on</strong>g> <str<strong>on</strong>g>oxide</str<strong>on</strong>g> <str<strong>on</strong>g>supported</str<strong>on</strong>g> <strong>on</strong> <strong>silica</strong> <strong>SBA</strong>-<strong>15</strong> <strong>studied</strong> by Raman, UV–Vis and X-ray absorpti<strong>on</strong> spectroscopy<br />
J. P. Thielemann et al.,<br />
Appl. Catal. A: General 399 (2011) 28-24<br />
Table 1: Surface and porosity characteristics <str<strong>on</strong>g>of</str<strong>on</strong>g> the MoxOy/<strong>SBA</strong>-<strong>15</strong> samples and bare <strong>SBA</strong>-<strong>15</strong><br />
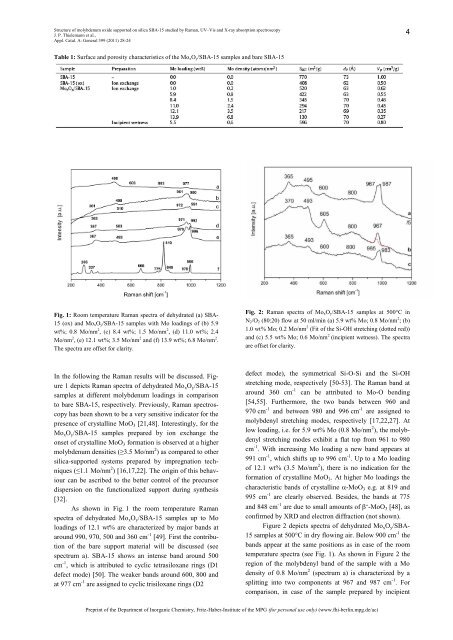
Fig. 1: Room temperature Raman spectra <str<strong>on</strong>g>of</str<strong>on</strong>g> dehydrated (a) <strong>SBA</strong>-<br />
<strong>15</strong> (ox) and MoxOy/<strong>SBA</strong>-<strong>15</strong> samples with Mo loadings <str<strong>on</strong>g>of</str<strong>on</strong>g> (b) 5.9<br />
wt%; 0.8 Mo/nm 2 , (c) 8.4 wt%; 1.5 Mo/nm 2 , (d) 11.0 wt%; 2.4<br />
Mo/nm 2 , (e) 12.1 wt%; 3.5 Mo/nm 2 and (f) 13.9 wt%; 6.8 Mo/nm 2 .<br />
The spectra are <str<strong>on</strong>g>of</str<strong>on</strong>g>fset for clarity.<br />
In the following the Raman results will be discussed. Figure<br />
1 depicts Raman spectra <str<strong>on</strong>g>of</str<strong>on</strong>g> dehydrated Mo xO y/<strong>SBA</strong>-<strong>15</strong><br />
samples at different <str<strong>on</strong>g>molybdenum</str<strong>on</strong>g> loadings in comparis<strong>on</strong><br />
to bare <strong>SBA</strong>-<strong>15</strong>, respectively. Previously, Raman spectroscopy<br />
has been shown to be a very sensitive indicator for the<br />
presence <str<strong>on</strong>g>of</str<strong>on</strong>g> crystalline MoO 3 [21,48]. Interestingly, for the<br />
Mo xO y/<strong>SBA</strong>-<strong>15</strong> samples prepared by i<strong>on</strong> exchange the<br />
<strong>on</strong>set <str<strong>on</strong>g>of</str<strong>on</strong>g> crystalline MoO 3 formati<strong>on</strong> is observed at a higher<br />
<str<strong>on</strong>g>molybdenum</str<strong>on</strong>g> densities (≥3.5 Mo/nm 2 ) as compared to other<br />
<strong>silica</strong>-<str<strong>on</strong>g>supported</str<strong>on</strong>g> systems prepared by impregnati<strong>on</strong> techniques<br />
(≤1.1 Mo/nm 2 ) [16,17,22]. The origin <str<strong>on</strong>g>of</str<strong>on</strong>g> this behaviour<br />
can be ascribed to the better c<strong>on</strong>trol <str<strong>on</strong>g>of</str<strong>on</strong>g> the precursor<br />
dispersi<strong>on</strong> <strong>on</strong> the functi<strong>on</strong>alized support during synthesis<br />
[32].<br />
As shown in Fig. 1 the room temperature Raman<br />
spectra <str<strong>on</strong>g>of</str<strong>on</strong>g> dehydrated Mo xO y/<strong>SBA</strong>-<strong>15</strong> samples up to Mo<br />
loadings <str<strong>on</strong>g>of</str<strong>on</strong>g> 12.1 wt% are characterized by major bands at<br />
around 990, 970, 500 and 360 cm -1 [49]. First the c<strong>on</strong>tributi<strong>on</strong><br />
<str<strong>on</strong>g>of</str<strong>on</strong>g> the bare support material will be discussed (see<br />
spectrum a). <strong>SBA</strong>-<strong>15</strong> shows an intense band around 500<br />
cm -1 , which is attributed to cyclic tetrasiloxane rings (D1<br />
defect mode) [50]. The weaker bands around 600, 800 and<br />
at 977 cm -1 are assigned to cyclic trisiloxane rings (D2<br />
Fig. 2: Raman spectra <str<strong>on</strong>g>of</str<strong>on</strong>g> MoxOy/<strong>SBA</strong>-<strong>15</strong> samples at 500°C in<br />
N2/O2 (80:20) flow at 50 ml/min (a) 5.9 wt% Mo; 0.8 Mo/nm 2 ; (b)<br />
1.0 wt% Mo; 0.2 Mo/nm 2 (Fit <str<strong>on</strong>g>of</str<strong>on</strong>g> the Si-OH stretching (dotted red))<br />
and (c) 5.5 wt% Mo; 0.6 Mo/nm 2 (incipient wetness). The spectra<br />
are <str<strong>on</strong>g>of</str<strong>on</strong>g>fset for clarity.<br />
defect mode), the symmetrical Si-O-Si and the Si-OH<br />
stretching mode, respectively [50-53]. The Raman band at<br />
around 360 cm -1 can be attributed to Mo-O bending<br />
[54,55]. Furthermore, the two bands between 960 and<br />
970 cm -1 and between 980 and 996 cm -1 are assigned to<br />
molybdenyl stretching modes, respectively [17,22,27]. At<br />
low loading, i.e. for 5.9 wt% Mo (0.8 Mo/nm 2 ), the molybdenyl<br />
stretching modes exhibit a flat top from 961 to 980<br />
cm -1 . With increasing Mo loading a new band appears at<br />
991 cm -1 , which shifts up to 996 cm -1 . Up to a Mo loading<br />
<str<strong>on</strong>g>of</str<strong>on</strong>g> 12.1 wt% (3.5 Mo/nm 2 ), there is no indicati<strong>on</strong> for the<br />
formati<strong>on</strong> <str<strong>on</strong>g>of</str<strong>on</strong>g> crystalline MoO 3. At higher Mo loadings the<br />
characteristic bands <str<strong>on</strong>g>of</str<strong>on</strong>g> crystalline �-MoO 3 e.g. at 819 and<br />
995 cm -1 are clearly observed. Besides, the bands at 775<br />
and 848 cm -1 are due to small amounts <str<strong>on</strong>g>of</str<strong>on</strong>g> �‘-MoO 3 [48], as<br />
c<strong>on</strong>firmed by XRD and electr<strong>on</strong> diffracti<strong>on</strong> (not shown).<br />
Figure 2 depicts spectra <str<strong>on</strong>g>of</str<strong>on</strong>g> dehydrated Mo xO y/<strong>SBA</strong>-<br />
<strong>15</strong> samples at 500°C in dry flowing air. Below 900 cm -1 the<br />
bands appear at the same positi<strong>on</strong>s as in case <str<strong>on</strong>g>of</str<strong>on</strong>g> the room<br />
temperature spectra (see Fig. 1). As shown in Figure 2 the<br />
regi<strong>on</strong> <str<strong>on</strong>g>of</str<strong>on</strong>g> the molybdenyl band <str<strong>on</strong>g>of</str<strong>on</strong>g> the sample with a Mo<br />
density <str<strong>on</strong>g>of</str<strong>on</strong>g> 0.8 Mo/nm 2 (spectrum a) is characterized by a<br />
splitting into two comp<strong>on</strong>ents at 967 and 987 cm -1 . For<br />
comparis<strong>on</strong>, in case <str<strong>on</strong>g>of</str<strong>on</strong>g> the sample prepared by incipient<br />
Preprint <str<strong>on</strong>g>of</str<strong>on</strong>g> the Department <str<strong>on</strong>g>of</str<strong>on</strong>g> Inorganic Chemistry, Fritz-Haber-Institute <str<strong>on</strong>g>of</str<strong>on</strong>g> the MPG (for pers<strong>on</strong>al use <strong>on</strong>ly) (www.fhi-berlin.mpg.de/ac)<br />
4