Structure of molybdenum oxide supported on silica SBA-15 studied ...
Structure of molybdenum oxide supported on silica SBA-15 studied ...
Structure of molybdenum oxide supported on silica SBA-15 studied ...

Create successful ePaper yourself
Turn your PDF publications into a flip-book with our unique Google optimized e-Paper software.
<str<strong>on</strong>g>Structure</str<strong>on</strong>g> <str<strong>on</strong>g>of</str<strong>on</strong>g> <str<strong>on</strong>g>molybdenum</str<strong>on</strong>g> <str<strong>on</strong>g>oxide</str<strong>on</strong>g> <str<strong>on</strong>g>supported</str<strong>on</strong>g> <strong>on</strong> <strong>silica</strong> <strong>SBA</strong>-<strong>15</strong> <strong>studied</strong> by Raman, UV–Vis and X-ray absorpti<strong>on</strong> spectroscopy<br />
J. P. Thielemann et al.,<br />
Appl. Catal. A: General 399 (2011) 28-24<br />
wetness impregnati<strong>on</strong> (0.6 Mo/nm 2 , spectrum c) the molybdenyl<br />
bands appear at very similar positi<strong>on</strong>s (965 cm -1 ,<br />
983 cm -1 ). Therefore, the effect <str<strong>on</strong>g>of</str<strong>on</strong>g> the preparati<strong>on</strong> procedure<br />
<strong>on</strong> the formed <str<strong>on</strong>g>molybdenum</str<strong>on</strong>g> <str<strong>on</strong>g>oxide</str<strong>on</strong>g> structures appears<br />
to be small. If the Mo density is further decreased to 0.2<br />
Mo/nm 2 <strong>on</strong>ly <strong>on</strong>e band with asymmetric shape is observed<br />
at 967 cm -1 . Normalising the Raman spectrum <str<strong>on</strong>g>of</str<strong>on</strong>g> <strong>SBA</strong>-<strong>15</strong><br />
(ox) recorded at 500°C under dehydrated c<strong>on</strong>diti<strong>on</strong>s to the<br />
<strong>silica</strong>-related bands at 605 and 800 cm -1 <str<strong>on</strong>g>of</str<strong>on</strong>g> spectrum (b)<br />
shows that the 967 cm -1 band comprises a c<strong>on</strong>tributi<strong>on</strong> <str<strong>on</strong>g>of</str<strong>on</strong>g><br />
the Si-OH stretching mode at 965 cm -1 . As reference Fig. 2<br />
shows the intensity <str<strong>on</strong>g>of</str<strong>on</strong>g> the Si-OH stretching mode for bare<br />
<strong>SBA</strong>-<strong>15</strong> as dotted line. Its c<strong>on</strong>tributi<strong>on</strong> to spectrum b will<br />
be reduced as a result <str<strong>on</strong>g>of</str<strong>on</strong>g> anchoring <str<strong>on</strong>g>of</str<strong>on</strong>g> <str<strong>on</strong>g>molybdenum</str<strong>on</strong>g> <str<strong>on</strong>g>oxide</str<strong>on</strong>g><br />
species to the support but will be still significant because <str<strong>on</strong>g>of</str<strong>on</strong>g><br />
the small Mo density (0.2 Mo/nm 2 ) as compared to the OH<br />
density <str<strong>on</strong>g>of</str<strong>on</strong>g> <strong>SBA</strong>-<strong>15</strong> determined by NMR<br />
(3.7 OH/nm 2 ) [56].<br />
Previously, <strong>on</strong> the basis <str<strong>on</strong>g>of</str<strong>on</strong>g> DFT calculati<strong>on</strong>s the two<br />
bands at 967 and 987 cm -1 have been assigned to the<br />
asymmetric and symmetric modes <str<strong>on</strong>g>of</str<strong>on</strong>g> a tetrahedral dimolybdenyl<br />
species [24]. Furthermore, a third mode at<br />
1020 cm -1 was observed and assigned to the molybdenyl<br />
vibrati<strong>on</strong> <str<strong>on</strong>g>of</str<strong>on</strong>g> a square pyramidal <str<strong>on</strong>g>molybdenum</str<strong>on</strong>g> <str<strong>on</strong>g>oxide</str<strong>on</strong>g> centre<br />
[31]. In a recent DFT study Gregoriades et al. use a more<br />
sophisticated, larger model to simulate <strong>silica</strong> <str<strong>on</strong>g>supported</str<strong>on</strong>g><br />
m<strong>on</strong>o <str<strong>on</strong>g>molybdenum</str<strong>on</strong>g> <str<strong>on</strong>g>oxide</str<strong>on</strong>g> centres and suggest instead that<br />
the assignment <str<strong>on</strong>g>of</str<strong>on</strong>g> the two bands at 988 and 1020 cm -1<br />
should be reversed [57]. Importantly, according to the latter<br />
assignment the two main molybdenyl bands at 967 and 987<br />
cm -1 represent different <str<strong>on</strong>g>molybdenum</str<strong>on</strong>g> <str<strong>on</strong>g>oxide</str<strong>on</strong>g> species. An<br />
assignment <str<strong>on</strong>g>of</str<strong>on</strong>g> these two bands to different species is <str<strong>on</strong>g>supported</str<strong>on</strong>g><br />
by the observati<strong>on</strong> that the presence <str<strong>on</strong>g>of</str<strong>on</strong>g> steam significantly<br />
changes their intensity ratio [58]. While detailed<br />
calculati<strong>on</strong>s for c<strong>on</strong>nected Mo xO y centres are not available<br />
and c<strong>on</strong>sidering the fact that missing M-O-M Raman signatures<br />
do not necessarily mean the absence <str<strong>on</strong>g>of</str<strong>on</strong>g> c<strong>on</strong>nected<br />
centres [33,35,36], the visible Raman spectra can not answer<br />
the questi<strong>on</strong> whether in the dehydrated state the surface<br />
<str<strong>on</strong>g>molybdenum</str<strong>on</strong>g> <str<strong>on</strong>g>oxide</str<strong>on</strong>g> species c<strong>on</strong>sist <str<strong>on</strong>g>of</str<strong>on</strong>g> isolated centres<br />
or c<strong>on</strong>nected centres or a mixture <str<strong>on</strong>g>of</str<strong>on</strong>g> both. Therefore, to<br />
gain further structural insight UV-Vis and X-ray absorpti<strong>on</strong><br />
spectroscopy were employed.<br />
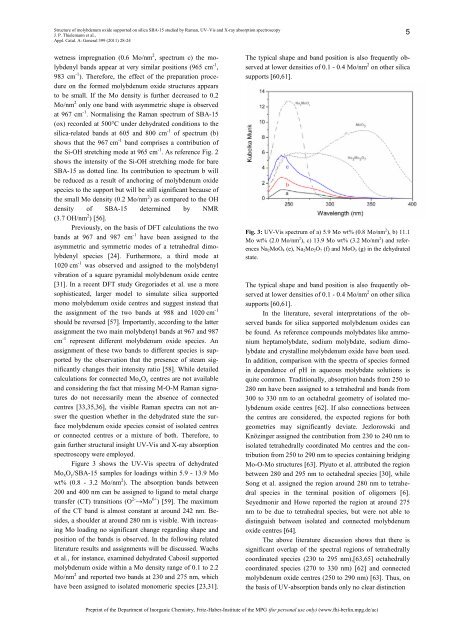
Figure 3 shows the UV-Vis spectra <str<strong>on</strong>g>of</str<strong>on</strong>g> dehydrated<br />
Mo xO y/<strong>SBA</strong>-<strong>15</strong> samples for loadings within 5.9 - 13.9 Mo<br />
wt% (0.8 - 3.2 Mo/nm 2 ). The absorpti<strong>on</strong> bands between<br />
200 and 400 nm can be assigned to ligand to metal charge<br />
transfer (CT) transiti<strong>on</strong>s (O 2- →Mo 6+ ) [59]. The maximum<br />
<str<strong>on</strong>g>of</str<strong>on</strong>g> the CT band is almost c<strong>on</strong>stant at around 242 nm. Besides,<br />
a shoulder at around 280 nm is visible. With increasing<br />
Mo loading no significant change regarding shape and<br />
positi<strong>on</strong> <str<strong>on</strong>g>of</str<strong>on</strong>g> the bands is observed. In the following related<br />
literature results and assignments will be discussed. Wachs<br />
et al., for instance, examined dehydrated Cabosil <str<strong>on</strong>g>supported</str<strong>on</strong>g><br />
<str<strong>on</strong>g>molybdenum</str<strong>on</strong>g> <str<strong>on</strong>g>oxide</str<strong>on</strong>g> within a Mo density range <str<strong>on</strong>g>of</str<strong>on</strong>g> 0.1 to 2.2<br />
Mo/nm 2 and reported two bands at 230 and 275 nm, which<br />
have been assigned to isolated m<strong>on</strong>omeric species [23,31].<br />
The typical shape and band positi<strong>on</strong> is also frequently observed<br />
at lower densities <str<strong>on</strong>g>of</str<strong>on</strong>g> 0.1 - 0.4 Mo/nm 2 <strong>on</strong> other <strong>silica</strong><br />
supports [60,61].<br />
Fig. 3: UV-Vis spectrum <str<strong>on</strong>g>of</str<strong>on</strong>g> a) 5.9 Mo wt% (0.8 Mo/nm 2 ), b) 11.1<br />
Mo wt% (2.0 Mo/nm 2 ), c) 13.9 Mo wt% (3.2 Mo/nm 2 ) and references<br />
Na2MoO4 (e), Na2Mo2O7 (f) and MoO3 (g) in the dehydrated<br />
state.<br />
The typical shape and band positi<strong>on</strong> is also frequently observed<br />
at lower densities <str<strong>on</strong>g>of</str<strong>on</strong>g> 0.1 - 0.4 Mo/nm 2 <strong>on</strong> other <strong>silica</strong><br />
supports [60,61].<br />
In the literature, several interpretati<strong>on</strong>s <str<strong>on</strong>g>of</str<strong>on</strong>g> the observed<br />
bands for <strong>silica</strong> <str<strong>on</strong>g>supported</str<strong>on</strong>g> <str<strong>on</strong>g>molybdenum</str<strong>on</strong>g> <str<strong>on</strong>g>oxide</str<strong>on</strong>g>s can<br />
be found. As reference compounds molybdates like amm<strong>on</strong>ium<br />
heptamolybdate, sodium molybdate, sodium dimolybdate<br />
and crystalline <str<strong>on</strong>g>molybdenum</str<strong>on</strong>g> <str<strong>on</strong>g>oxide</str<strong>on</strong>g> have been used.<br />
In additi<strong>on</strong>, comparis<strong>on</strong> with the spectra <str<strong>on</strong>g>of</str<strong>on</strong>g> species formed<br />
in dependence <str<strong>on</strong>g>of</str<strong>on</strong>g> pH in aqueous molybdate soluti<strong>on</strong>s is<br />
quite comm<strong>on</strong>. Traditi<strong>on</strong>ally, absorpti<strong>on</strong> bands from 250 to<br />
280 nm have been assigned to a tetrahedral and bands from<br />
300 to 330 nm to an octahedral geometry <str<strong>on</strong>g>of</str<strong>on</strong>g> isolated <str<strong>on</strong>g>molybdenum</str<strong>on</strong>g><br />
<str<strong>on</strong>g>oxide</str<strong>on</strong>g> centres [62]. If also c<strong>on</strong>necti<strong>on</strong>s between<br />
the centres are c<strong>on</strong>sidered, the expected regi<strong>on</strong>s for both<br />
geometries may significantly deviate. Jezlorowski and<br />
Knözinger assigned the c<strong>on</strong>tributi<strong>on</strong> from 230 to 240 nm to<br />
isolated tetrahedrally coordinated Mo centres and the c<strong>on</strong>tributi<strong>on</strong><br />
from 250 to 290 nm to species c<strong>on</strong>taining bridging<br />
Mo-O-Mo structures [63]. Plyuto et al. attributed the regi<strong>on</strong><br />
between 280 and 295 nm to octahedral species [30], while<br />
S<strong>on</strong>g et al. assigned the regi<strong>on</strong> around 280 nm to tetrahedral<br />
species in the terminal positi<strong>on</strong> <str<strong>on</strong>g>of</str<strong>on</strong>g> oligomers [6].<br />
Seyedm<strong>on</strong>ir and Howe reported the regi<strong>on</strong> at around 275<br />
nm to be due to tetrahedral species, but were not able to<br />
distinguish between isolated and c<strong>on</strong>nected <str<strong>on</strong>g>molybdenum</str<strong>on</strong>g><br />
<str<strong>on</strong>g>oxide</str<strong>on</strong>g> centres [64].<br />
The above literature discussi<strong>on</strong> shows that there is<br />
significant overlap <str<strong>on</strong>g>of</str<strong>on</strong>g> the spectral regi<strong>on</strong>s <str<strong>on</strong>g>of</str<strong>on</strong>g> tetrahedrally<br />
coordinated species (230 to 295 nm),[63,65] octahedrally<br />
coordinated species (270 to 330 nm) [62] and c<strong>on</strong>nected<br />
<str<strong>on</strong>g>molybdenum</str<strong>on</strong>g> <str<strong>on</strong>g>oxide</str<strong>on</strong>g> centres (250 to 290 nm) [63]. Thus, <strong>on</strong><br />
the basis <str<strong>on</strong>g>of</str<strong>on</strong>g> UV-absorpti<strong>on</strong> bands <strong>on</strong>ly no clear distincti<strong>on</strong><br />
Preprint <str<strong>on</strong>g>of</str<strong>on</strong>g> the Department <str<strong>on</strong>g>of</str<strong>on</strong>g> Inorganic Chemistry, Fritz-Haber-Institute <str<strong>on</strong>g>of</str<strong>on</strong>g> the MPG (for pers<strong>on</strong>al use <strong>on</strong>ly) (www.fhi-berlin.mpg.de/ac)<br />
5