Download - Southern University New Orleans
Download - Southern University New Orleans
Download - Southern University New Orleans
- No tags were found...

Create successful ePaper yourself
Turn your PDF publications into a flip-book with our unique Google optimized e-Paper software.
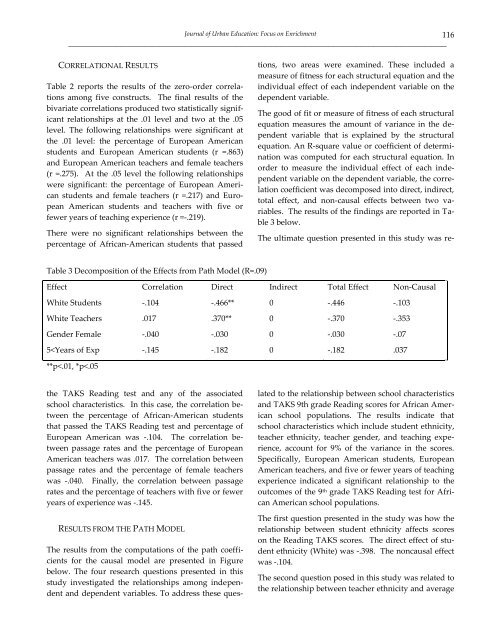
Journal of Urban Education: Focus on Enrichment116________________________________________________________________________________________________________CORRELATIONAL RESULTSTable 2 reports the results of the zero-order correlationsamong five constructs. The final results of thebivariate correlations produced two statistically significantrelationships at the .01 level and two at the .05level. The following relationships were significant atthe .01 level: the percentage of European Americanstudents and European American students (r =.863)and European American teachers and female teachers(r =.275). At the .05 level the following relationshipswere significant: the percentage of European Americanstudents and female teachers (r =.217) and EuropeanAmerican students and teachers with five orfewer years of teaching experience (r =-.219).There were no significant relationships between thepercentage of African-American students that passedThe results from the computations of the path coefficientsfor the causal model are presented in Figurebelow. The four research questions presented in thisstudy investigated the relationships among independentand dependent variables. To address these questions,two areas were examined. These included ameasure of fitness for each structural equation and theindividual effect of each independent variable on thedependent variable.The good of fit or measure of fitness of each structuralequation measures the amount of variance in the dependentvariable that is explained by the structuralequation. An R-square value or coefficient of determinationwas computed for each structural equation. Inorder to measure the individual effect of each independentvariable on the dependent variable, the correlationcoefficient was decomposed into direct, indirect,total effect, and non-causal effects between two variables.The results of the findings are reported in Table3 below.Table 3 Decomposition of the Effects from Path Model (R=.09)Effect Correlation Direct Indirect Total Effect Non-CausalWhite Students -.104 -.466** 0 -.446 -.103White Teachers .017 .370** 0 -.370 -.353Gender Female -.040 -.030 0 -.030 -.075