Name-Ethnicity Classification and Ethnicity ... - Dr. C. Lee Giles
Name-Ethnicity Classification and Ethnicity ... - Dr. C. Lee Giles
Name-Ethnicity Classification and Ethnicity ... - Dr. C. Lee Giles
- No tags were found...

Create successful ePaper yourself
Turn your PDF publications into a flip-book with our unique Google optimized e-Paper software.
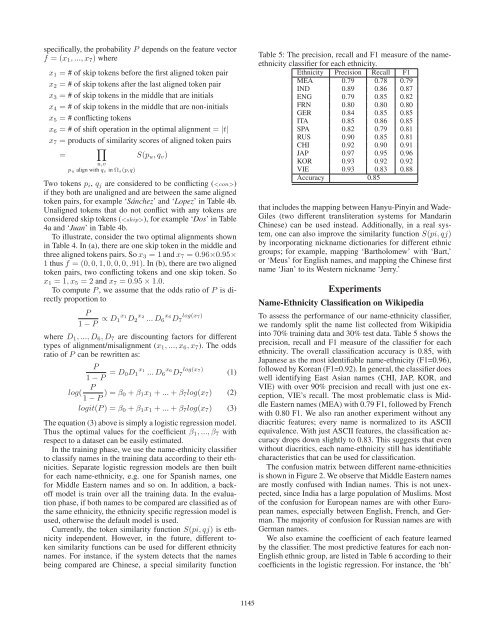
specifically, the probability P depends on the feature vectorf =(x 1 ,...,x 7 ) wherex 1 = # of skip tokens before the first aligned token pairx 2 = # of skip tokens after the last aligned token pairx 3 = # of skip tokens in the middle that are initialsx 4 = # of skip tokens in the middle that are non-initialsx 5 = # conflicting tokensx 6 = # of shift operation in the optimal alignment = |t|x 7 = products of similarity scores of aligned token pairs=S(p u ,q v )u,vp u align with q v in Ω s(p,q)Two tokens p i , q j are considered to be conflicting ()if they both are unaligned <strong>and</strong> are between the same alignedtoken pairs, for example ‘Sánchez’ <strong>and</strong> ‘Lopez’ in Table 4b.Unaligned tokens that do not conflict with any tokens areconsidered skip tokens (), for example ‘Dos’ in Table4a <strong>and</strong> ‘Juan’ in Table 4b.To illustrate, consider the two optimal alignments shownin Table 4. In (a), there are one skip token in the middle <strong>and</strong>three aligned tokens pairs. So x 3 =1<strong>and</strong> x 7 =0.96×0.95×1 thus f =(0, 0, 1, 0, 0, 0,.91). In (b), there are two alignedtoken pairs, two conflicting tokens <strong>and</strong> one skip token. Sox 1 =1,x 5 =2<strong>and</strong> x 7 =0.95 × 1.0.To compute P , we assume that the odds ratio of P is directlyproportion toP1 − P ∝ D 1 x1 D 2x 2... D 6x 6D 7log(x 7)where D 1 ,...,D 6 ,D 7 are discounting factors for differenttypes of alignment/misalignment (x 1 ,...,x 6 ,x 7 ). The oddsratio of P can be rewritten as:P1 − P = D x0D 1 x1 ... D 6 log(x6 D 7)7 (1)Plog(1 − P )=β 0 + β 1 x 1 + ... + β 7 log(x 7 ) (2)logit(P )=β 0 + β 1 x 1 + ... + β 7 log(x 7 ) (3)The equation (3) above is simply a logistic regression model.Thus the optimal values for the coefficient β 1 ,...,β 7 withrespect to a dataset can be easily estimated.In the training phase, we use the name-ethnicity classifierto classify names in the training data according to their ethnicities.Separate logistic regression models are then builtfor each name-ethnicity, e.g. one for Spanish names, onefor Middle Eastern names <strong>and</strong> so on. In addition, a backoffmodel is train over all the training data. In the evaluationphase, if both names to be compared are classified as ofthe same ethnicity, the ethnicity specific regression model isused, otherwise the default model is used.Currently, the token similarity function S(pi, qj) is ethnicityindependent. However, in the future, different tokensimilarity functions can be used for different ethnicitynames. For instance, if the system detects that the namesbeing compared are Chinese, a special similarity functionTable 5: The precision, recall <strong>and</strong> F1 measure of the nameethnicityclassifier for each ethnicity.<strong>Ethnicity</strong> Precision Recall F1MEA 0.79 0.78 0.79IND 0.89 0.86 0.87ENG 0.79 0.85 0.82FRN 0.80 0.80 0.80GER 0.84 0.85 0.85ITA 0.85 0.86 0.85SPA 0.82 0.79 0.81RUS 0.90 0.85 0.81CHI 0.92 0.90 0.91JAP 0.97 0.95 0.96KOR 0.93 0.92 0.92VIE 0.93 0.83 0.88Accuracy 0.85that includes the mapping between Hanyu-Pinyin <strong>and</strong> Wade-<strong>Giles</strong> (two different transliteration systems for M<strong>and</strong>arinChinese) can be used instead. Additionally, in a real system,one can also improve the similarity function S(pi, qj)by incorporating nickname dictionaries for different ethnicgroups; for example, mapping ‘Bartholomew’ with ‘Bart,’or ‘Meus’ for English names, <strong>and</strong> mapping the Chinese firstname ‘Jian’ to its Western nickname ‘Jerry.’Experiments<strong>Name</strong>-<strong>Ethnicity</strong> <strong>Classification</strong> on WikipediaTo assess the performance of our name-ethnicity classifier,we r<strong>and</strong>omly split the name list collected from Wikipidiainto 70% training data <strong>and</strong> 30% test data. Table 5 shows theprecision, recall <strong>and</strong> F1 measure of the classifier for eachethnicity. The overall classification accuracy is 0.85, withJapanese as the most identifiable name-ethnicity (F1=0.96),followed by Korean (F1=0.92). In general, the classifier doeswell identifying East Asian names (CHI, JAP, KOR, <strong>and</strong>VIE) with over 90% precision <strong>and</strong> recall with just one exception,VIE’s recall. The most problematic class is MiddleEastern names (MEA) with 0.79 F1, followed by Frenchwith 0.80 F1. We also ran another experiment without anydiacritic features; every name is normalized to its ASCIIequivalence. With just ASCII features, the classification accuracydrops down slightly to 0.83. This suggests that evenwithout diacritics, each name-ethnicity still has identifiablecharacteristics that can be used for classification.The confusion matrix between different name-ethnicitiesis shown in Figure 2. We observe that Middle Eastern namesare mostly confused with Indian names. This is not unexpected,since India has a large population of Muslims. Mostof the confusion for European names are with other Europeannames, especially between English, French, <strong>and</strong> German.The majority of confusion for Russian names are withGerman names.We also examine the coefficient of each feature learnedby the classifier. The most predictive features for each non-English ethnic group, are listed in Table 6 according to theircoefficients in the logistic regression. For instance, the ‘bh’1145