2010 CREST Annual Report - Alabama A&M University
2010 CREST Annual Report - Alabama A&M University
2010 CREST Annual Report - Alabama A&M University
- No tags were found...

You also want an ePaper? Increase the reach of your titles
YUMPU automatically turns print PDFs into web optimized ePapers that Google loves.
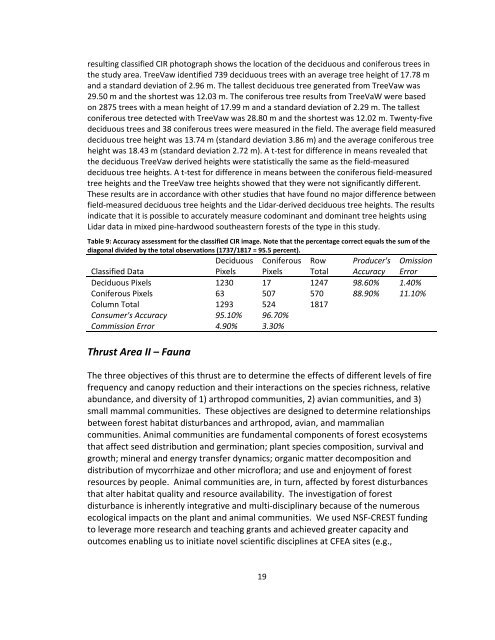
esulting classified CIR photograph shows the location of the deciduous and coniferous trees inthe study area. TreeVaw identified 739 deciduous trees with an average tree height of 17.78 mand a standard deviation of 2.96 m. The tallest deciduous tree generated from TreeVaw was29.50 m and the shortest was 12.03 m. The coniferous tree results from TreeVaW were basedon 2875 trees with a mean height of 17.99 m and a standard deviation of 2.29 m. The tallestconiferous tree detected with TreeVaw was 28.80 m and the shortest was 12.02 m. Twenty-fivedeciduous trees and 38 coniferous trees were measured in the field. The average field measureddeciduous tree height was 13.74 m (standard deviation 3.86 m) and the average coniferous treeheight was 18.43 m (standard deviation 2.72 m). A t-test for difference in means revealed thatthe deciduous TreeVaw derived heights were statistically the same as the field-measureddeciduous tree heights. A t-test for difference in means between the coniferous field-measuredtree heights and the TreeVaw tree heights showed that they were not significantly different.These results are in accordance with other studies that have found no major difference betweenfield-measured deciduous tree heights and the Lidar-derived deciduous tree heights. The resultsindicate that it is possible to accurately measure codominant and dominant tree heights usingLidar data in mixed pine-hardwood southeastern forests of the type in this study.Table 9: Accuracy assessment for the classified CIR image. Note that the percentage correct equals the sum of thediagonal divided by the total observations (1737/1817 = 95.5 percent).Classified DataDeciduousPixelsConiferousPixelsRowTotalProducer'sAccuracyOmissionErrorDeciduous Pixels 1230 17 1247 98.60% 1.40%Coniferous Pixels 63 507 570 88.90% 11.10%Column Total 1293 524 1817Consumer's Accuracy 95.10% 96.70%Commission Error 4.90% 3.30%Thrust Area II – FaunaThe three objectives of this thrust are to determine the effects of different levels of firefrequency and canopy reduction and their interactions on the species richness, relativeabundance, and diversity of 1) arthropod communities, 2) avian communities, and 3)small mammal communities. These objectives are designed to determine relationshipsbetween forest habitat disturbances and arthropod, avian, and mammaliancommunities. Animal communities are fundamental components of forest ecosystemsthat affect seed distribution and germination; plant species composition, survival andgrowth; mineral and energy transfer dynamics; organic matter decomposition anddistribution of mycorrhizae and other microflora; and use and enjoyment of forestresources by people. Animal communities are, in turn, affected by forest disturbancesthat alter habitat quality and resource availability. The investigation of forestdisturbance is inherently integrative and multi-disciplinary because of the numerousecological impacts on the plant and animal communities. We used NSF-<strong>CREST</strong> fundingto leverage more research and teaching grants and achieved greater capacity andoutcomes enabling us to initiate novel scientific disciplines at CFEA sites (e.g.,19