2010 CREST Annual Report - Alabama A&M University
2010 CREST Annual Report - Alabama A&M University
2010 CREST Annual Report - Alabama A&M University
- No tags were found...
Create successful ePaper yourself
Turn your PDF publications into a flip-book with our unique Google optimized e-Paper software.
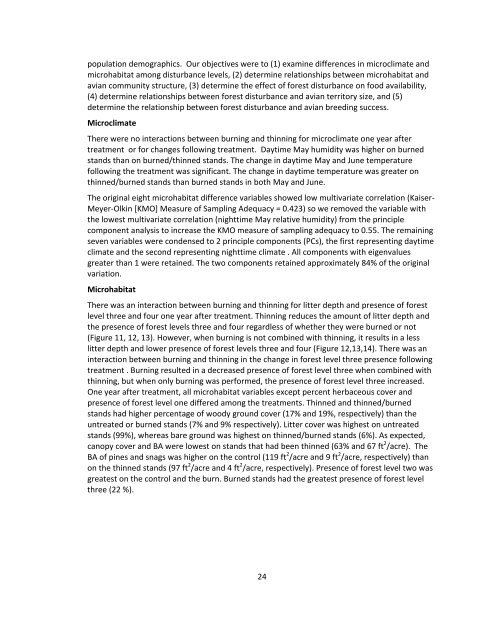
population demographics. Our objectives were to (1) examine differences in microclimate andmicrohabitat among disturbance levels, (2) determine relationships between microhabitat andavian community structure, (3) determine the effect of forest disturbance on food availability,(4) determine relationships between forest disturbance and avian territory size, and (5)determine the relationship between forest disturbance and avian breeding success.MicroclimateThere were no interactions between burning and thinning for microclimate one year aftertreatment or for changes following treatment. Daytime May humidity was higher on burnedstands than on burned/thinned stands. The change in daytime May and June temperaturefollowing the treatment was significant. The change in daytime temperature was greater onthinned/burned stands than burned stands in both May and June.The original eight microhabitat difference variables showed low multivariate correlation (Kaiser-Meyer-Olkin [KMO] Measure of Sampling Adequacy = 0.423) so we removed the variable withthe lowest multivariate correlation (nighttime May relative humidity) from the principlecomponent analysis to increase the KMO measure of sampling adequacy to 0.55. The remainingseven variables were condensed to 2 principle components (PCs), the first representing daytimeclimate and the second representing nighttime climate . All components with eigenvaluesgreater than 1 were retained. The two components retained approximately 84% of the originalvariation.MicrohabitatThere was an interaction between burning and thinning for litter depth and presence of forestlevel three and four one year after treatment. Thinning reduces the amount of litter depth andthe presence of forest levels three and four regardless of whether they were burned or not(Figure 11, 12, 13). However, when burning is not combined with thinning, it results in a lesslitter depth and lower presence of forest levels three and four (Figure 12,13,14). There was aninteraction between burning and thinning in the change in forest level three presence followingtreatment . Burning resulted in a decreased presence of forest level three when combined withthinning, but when only burning was performed, the presence of forest level three increased.One year after treatment, all microhabitat variables except percent herbaceous cover andpresence of forest level one differed among the treatments. Thinned and thinned/burnedstands had higher percentage of woody ground cover (17% and 19%, respectively) than theuntreated or burned stands (7% and 9% respectively). Litter cover was highest on untreatedstands (99%), whereas bare ground was highest on thinned/burned stands (6%). As expected,canopy cover and BA were lowest on stands that had been thinned (63% and 67 ft 2 /acre). TheBA of pines and snags was higher on the control (119 ft 2 /acre and 9 ft 2 /acre, respectively) thanon the thinned stands (97 ft 2 /acre and 4 ft 2 /acre, respectively). Presence of forest level two wasgreatest on the control and the burn. Burned stands had the greatest presence of forest levelthree (22 %).24


