Study of Laser Ablation and Mechanical Properties of Silicone ...
Study of Laser Ablation and Mechanical Properties of Silicone ...
Study of Laser Ablation and Mechanical Properties of Silicone ...
- No tags were found...

You also want an ePaper? Increase the reach of your titles
YUMPU automatically turns print PDFs into web optimized ePapers that Google loves.
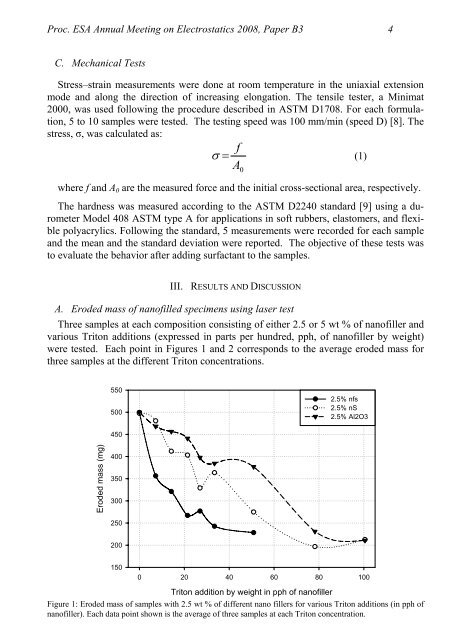
Proc. ESA Annual Meeting on Electrostatics 2008, Paper B3 4C. <strong>Mechanical</strong> TestsStress–strain measurements were done at room temperature in the uniaxial extensionmode <strong>and</strong> along the direction <strong>of</strong> increasing elongation. The tensile tester, a Minimat2000, was used following the procedure described in ASTM D1708. For each formulation,5 to 10 samples were tested. The testing speed was 100 mm/min (speed D) [8]. Thestress, σ, was calculated as:fσ =(1)A 0where f <strong>and</strong> A 0 are the measured force <strong>and</strong> the initial cross-sectional area, respectively.The hardness was measured according to the ASTM D2240 st<strong>and</strong>ard [9] using a durometerModel 408 ASTM type A for applications in s<strong>of</strong>t rubbers, elastomers, <strong>and</strong> flexiblepolyacrylics. Following the st<strong>and</strong>ard, 5 measurements were recorded for each sample<strong>and</strong> the mean <strong>and</strong> the st<strong>and</strong>ard deviation were reported. The objective <strong>of</strong> these tests wasto evaluate the behavior after adding surfactant to the samples.III. RESULTS AND DISCUSSIONA. Eroded mass <strong>of</strong> nan<strong>of</strong>illed specimens using laser testThree samples at each composition consisting <strong>of</strong> either 2.5 or 5 wt % <strong>of</strong> nan<strong>of</strong>iller <strong>and</strong>various Triton additions (expressed in parts per hundred, pph, <strong>of</strong> nan<strong>of</strong>iller by weight)were tested. Each point in Figures 1 <strong>and</strong> 2 corresponds to the average eroded mass forthree samples at the different Triton concentrations.5505002.5% nfs2.5% nS2.5% Al2O3450Eroded mass (mg)4003503002502001500 20 40 60 80 100Triton addition by weight in pph <strong>of</strong> nan<strong>of</strong>illerFigure 1: Eroded mass <strong>of</strong> samples with 2.5 wt % <strong>of</strong> different nano fillers for various Triton additions (in pph <strong>of</strong>nan<strong>of</strong>iller). Each data point shown is the average <strong>of</strong> three samples at each Triton concentration.